

1) Using the sample data shown in Table 2, For each gauge pressure reading, calculate the absolute...
Fantastic news! We've Found the answer you've been seeking!
Question:
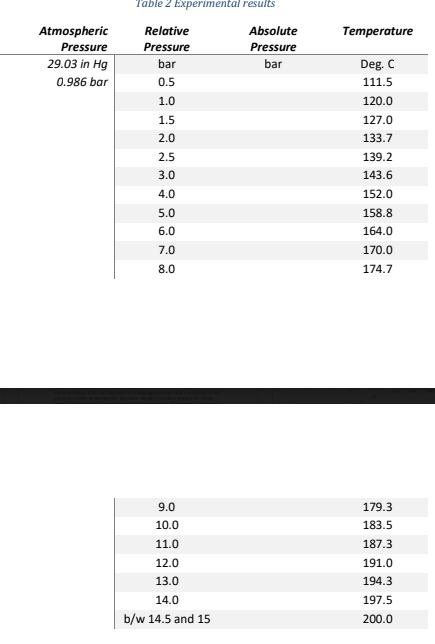
1) Using the sample data shown in Table 2, For each gauge pressure reading, calculate the absolute pressure and the corresponding pressure-temperature pairs from saturated steam tables (e.g., Table A-2 or A-3 in Moran and Shapiro’s Fundamentals of Engineering Thermodynamics). Remember: Steam tables are written in absolute pressure!
2) Plot both your absolute pressure versus temperature results and the steam table values, as two separate curves on one plot for comparison. Determine the maximum and average percentage difference between your results and the published steam table values. Provide some plausible reasons for any discrepancies.
Expert Answer:
To calculate the absolute pressure and corresponding pressuretemperature pairs we can use the given gauge pressure readings and the atmospheric pressu... View the full answer

Related Book For 

Introduction to Statistical Quality Control
ISBN: 978-1118146811
7th edition
Authors: Douglas C Montgomery
Posted Date:
