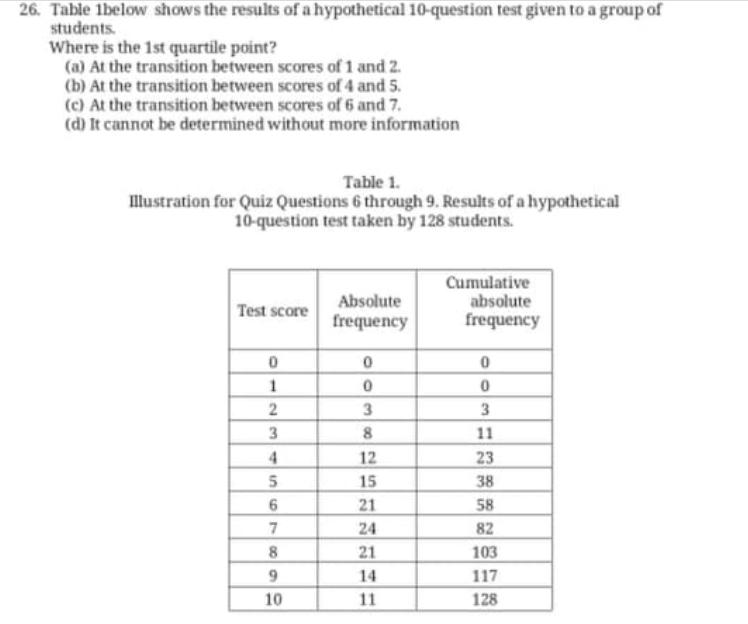
26. Table 1below shows the results of a hypothetical 10-question test given to a group of...
Fantastic news! We've Found the answer you've been seeking!
Question:
Transcribed Image Text:
26. Table 1below shows the results of a hypothetical 10-question test given to a group of students. Where is the 1st quartile point? (a) At the transition between scores of 1 and 2. (b) At the transition between scores of 4 and 5. (c) At the transition between scores of 6 and 7. (d) It cannot be determined without more information Table 1. Illustration for Quiz Questions 6 through 9. Results of a hypothetical 10-question test taken by 128 students. Cumulative absolute frequency Absolute Test score frequency 3. 8. 11 4 12 23 5n 15 38 21 58 82 24 8. 21 103 14 117 10 11 128 .27. What is the range for the scores achieved by students in the scenario of Table 1? (a) 5 (b) 8 (c) 10 (d) It cannot be determined without more information. 28. What is the interquartile range of the scores in Table 1? (a) 3 (b) 4 (c) 6 (d) It cannot be determined because it is ambiguous. 29. Suppose, in the scenario shown by Table 1, Maria. is one of the students taking the test, and she gets a score of 6. In what interval is Maria with respect to the class? (a) The bottom 25%. (b) The next-to-lowest 25%. (c) The next-to-highest 25%. (d) It cannot be determined because it is ambiguous. 26. Table 1below shows the results of a hypothetical 10-question test given to a group of students. Where is the 1st quartile point? (a) At the transition between scores of 1 and 2. (b) At the transition between scores of 4 and 5. (c) At the transition between scores of 6 and 7. (d) It cannot be determined without more information Table 1. Illustration for Quiz Questions 6 through 9. Results of a hypothetical 10-question test taken by 128 students. Cumulative absolute frequency Absolute Test score frequency 3. 8. 11 4 12 23 5n 15 38 21 58 82 24 8. 21 103 14 117 10 11 128 .27. What is the range for the scores achieved by students in the scenario of Table 1? (a) 5 (b) 8 (c) 10 (d) It cannot be determined without more information. 28. What is the interquartile range of the scores in Table 1? (a) 3 (b) 4 (c) 6 (d) It cannot be determined because it is ambiguous. 29. Suppose, in the scenario shown by Table 1, Maria. is one of the students taking the test, and she gets a score of 6. In what interval is Maria with respect to the class? (a) The bottom 25%. (b) The next-to-lowest 25%. (c) The next-to-highest 25%. (d) It cannot be determined because it is ambiguous.
Expert Answer:
Related Book For
Elementary Statistics Picturing the World
ISBN: 978-0321911216
6th edition
Authors: Ron Larson, Betsy Farber
Posted Date:
Students also viewed these mathematics questions
-
The contingency table below shows the results of a survey of online video viewing by age. Find the following probabilities or percentages: a. Probability that a viewer is aged 1834. b. Probability...
-
Table 3.13 shows the results of a retrospective study comparing radiation therapy with surgery in treating cancer of the larynx. The response indicates whether the cancer was controlled for at least...
-
Table 12.5.17 shows the results of a multiple regression analysis designed to explain the salaries of chief executive officers based on the sales of their firm and the industry group.36 The Y...
-
What is the result of the following? A. 0 B. 0.007 C. The code does not compile due to line 7. D. The code does not compile due to line 8. E. The code does not compile for another reason. 1: import...
-
Describe three of the main barriers to adoption of e-commerce by consumers and suggest how a company could counter these.
-
Equipment that cost $80,000 and has accumulated depreciation of $63,000 is exchanged for similar equipment with a fair value of $35,000 and $15,000 cash is received. The exchange lacked commercial...
-
Plaintiff visited South Chicago on January 10, 2008, seeking a new 2008 Nissan Versa (Versa) with manual transmission, anti-lock brakes, and other features. He was told by the employees of South...
-
As part of the budgeting process, Northview Corporations CFO is developing the overhead budget for next year for its Evans Division. The division estimates that it will manufacture 150,000 units...
-
You have calculated the historical dollar weighted return, annual geometric average return and annual arithmetic average return. You always reinvest your dividends and interest earned on the...
-
Formulate a linear program which can be used to generate a comprehensive plan for the whole Far Eastern operations. Clearly define every variable used in your formulation. Start your report with an...
-
Assume that there exists a small region that is subdivided into three independent local political jurisdictions. Building off of HW2, assume that there exists three different types of individuals i =...
-
An annuity has an income of 2 0 0 per year for 1 0 years at an interest rate of 1 0 % what is the present value.
-
1. Description - This assignment is an exploratory review conducted to have a better understanding about the topic below. 2. Topic - "Communication Management, Leadership, and Project Team...
-
The position function of a particular particle is given by f(t) = -t + 4t + 8. Assume that it is defined for t. (a) What is the velocity function of the particle? f'(t) = (b) What is the velocity of...
-
Your client Idris Elba has come back to you after you sent the email explaining how bridging finance works. He is a little concerned if he does not sell his property in the next 6-12 months he will...
-
Calculate the PV of a one - time $ 7 5 , 0 0 0 payment to be received in 8 years when the required rate of return ( discount rate ) is 5 % .
-
Given the following C# code, what value of j will be written to the console? int j =0; do if (j==0) 1-2; else j+=3; } while (j < 0); Console.WriteLine(j);
-
Sundial Technologies produces and sells customized network systems in New Brunswick. The company offers a 60-day, all software and labor-and an extra 90-day, parts-only- warranty on all of its...
-
The histograms shown below represent binomial distributions with the same number of trials n but different probabilities of success p. Match each probability with the correct graph. Explain your...
-
In Exercises 34, (a) Find the equation of the regression line, (b) Construct a scatter plot of the data and draw the regression line, (c) Construct a residual plot, (d) Determine whether there are...
-
Use technology to find the equation of the regression line for the salaries and average attendances at home games for the teams in Major League Baseball listed on page 469. a. Enter the data. b....
-
A researcher measured heart rate \((x)\) and oxygen uptake \((y)\) for one person under varying exercise conditions. He wishes to determine if heart rate, which is easier to measure, can be used to...
-
A researcher is investigating the relationship between yield of potatoes \((y)\) and level of fertilizer \((x\).\() She divides a eld into eight plots of equal\) size and applied fertilizer at a di...
-
The Police Department is interested in determining the e ect of alcohol consumption on driving performance. Twelve male drivers of similar weight, age, and driving experience were randomly assigned...
Study smarter with the SolutionInn App