

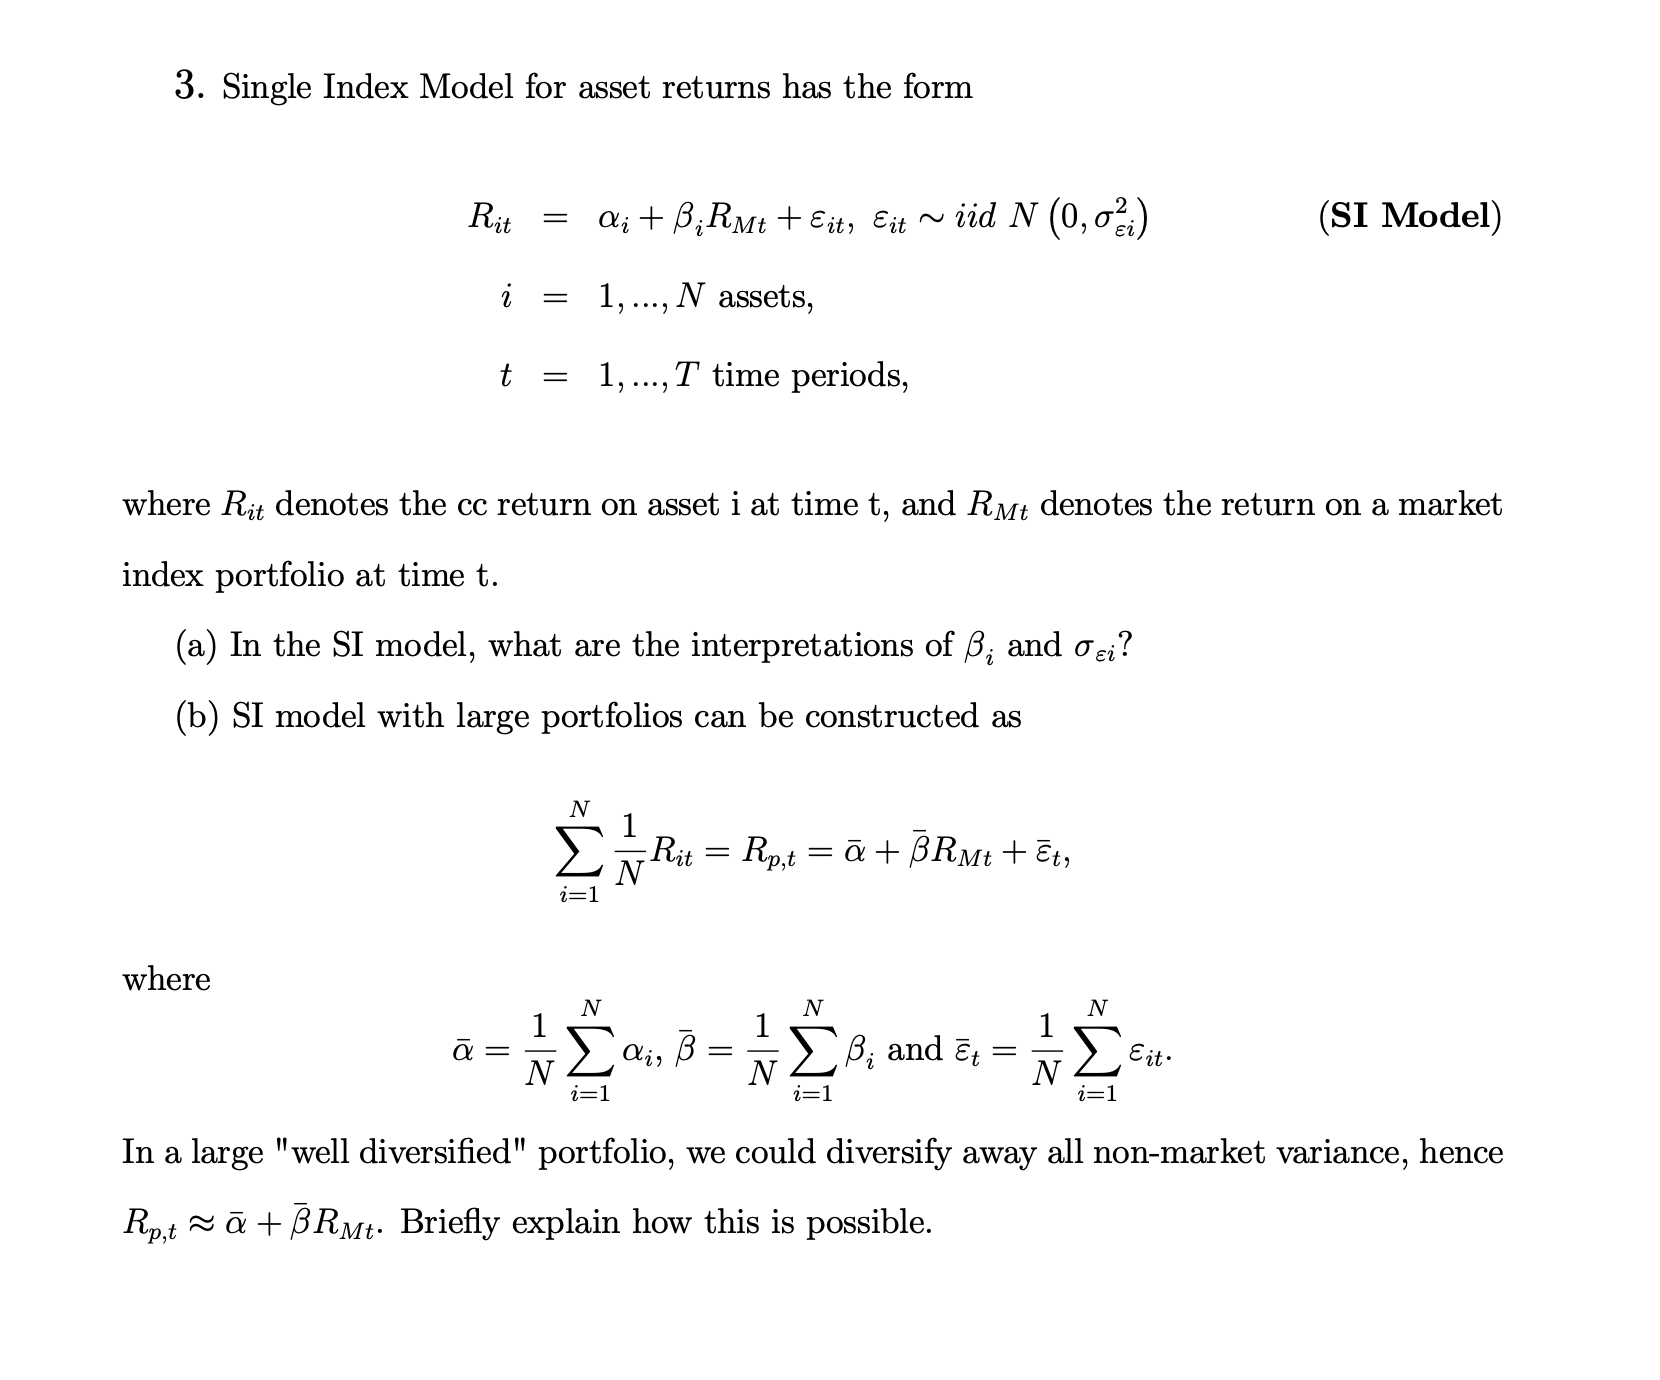
3. Single Index Model for asset returns has the form Rit where = i = t...
Fantastic news! We've Found the answer you've been seeking!
Question:
Transcribed Image Text:
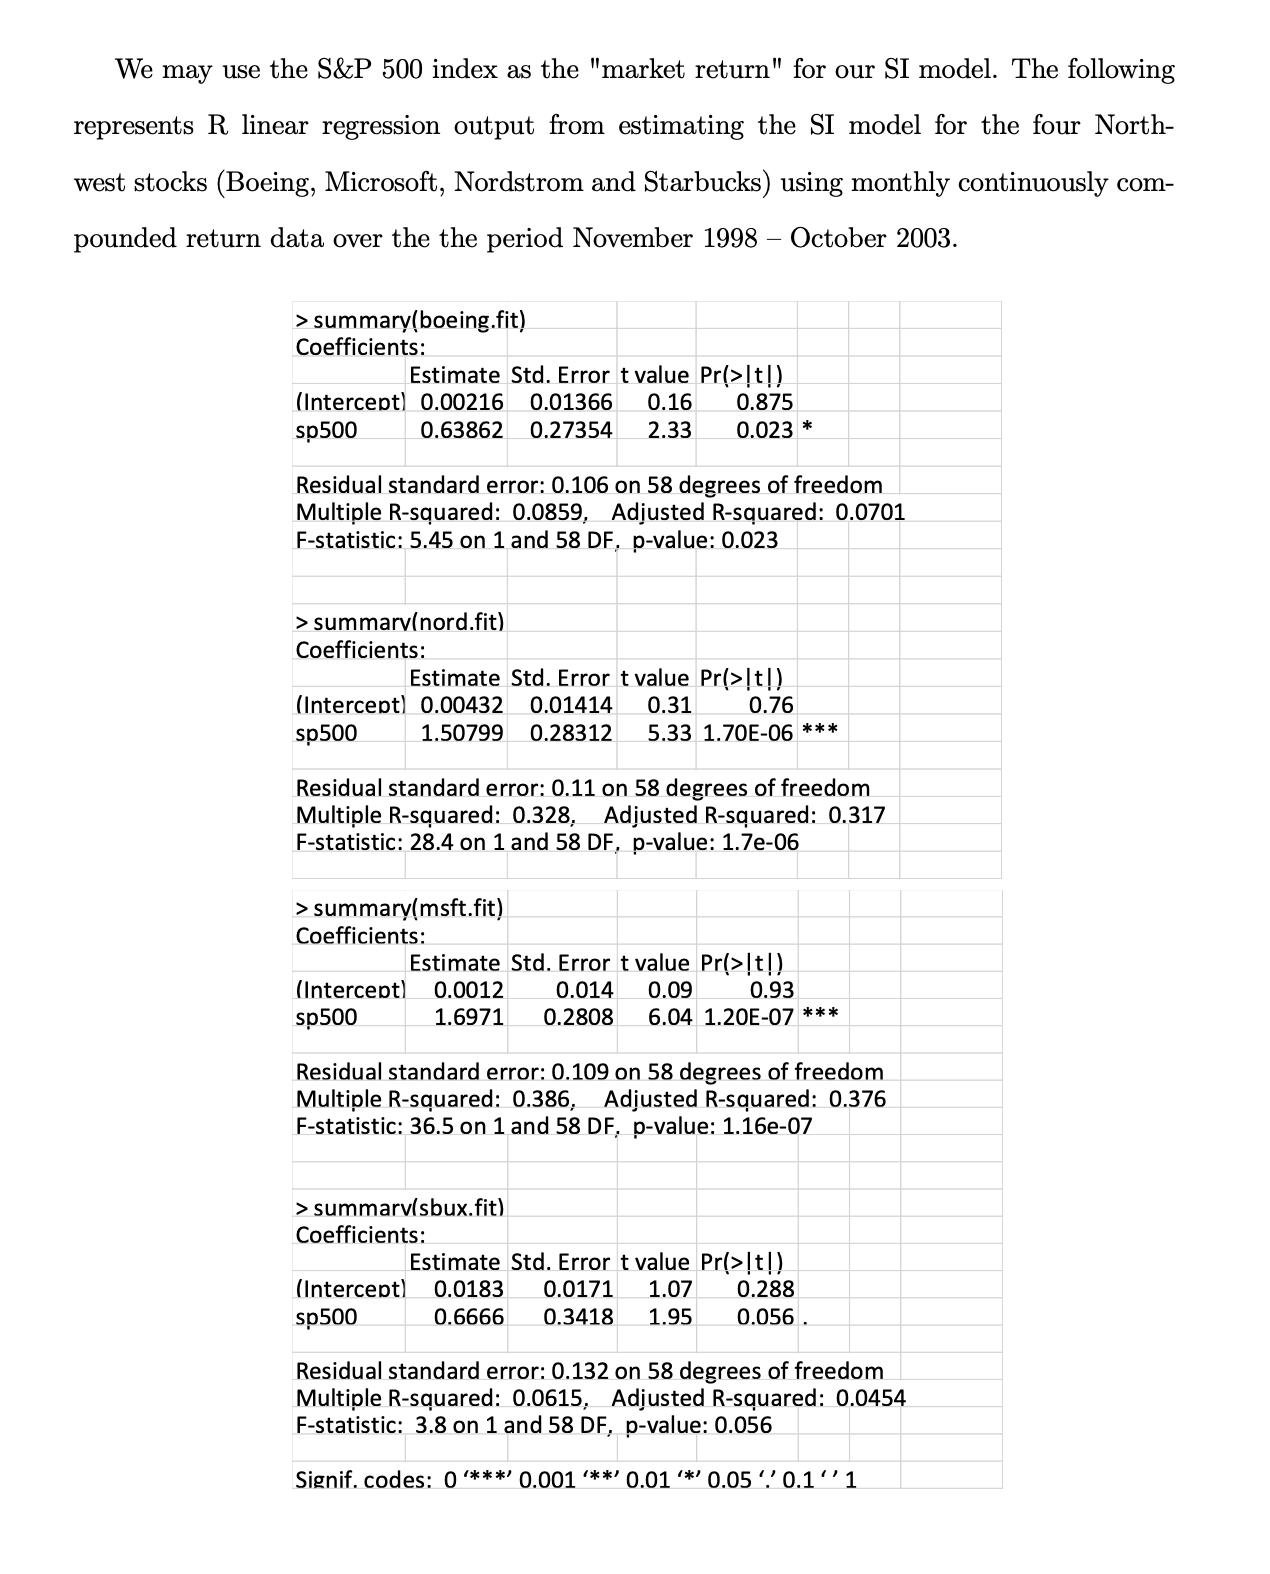
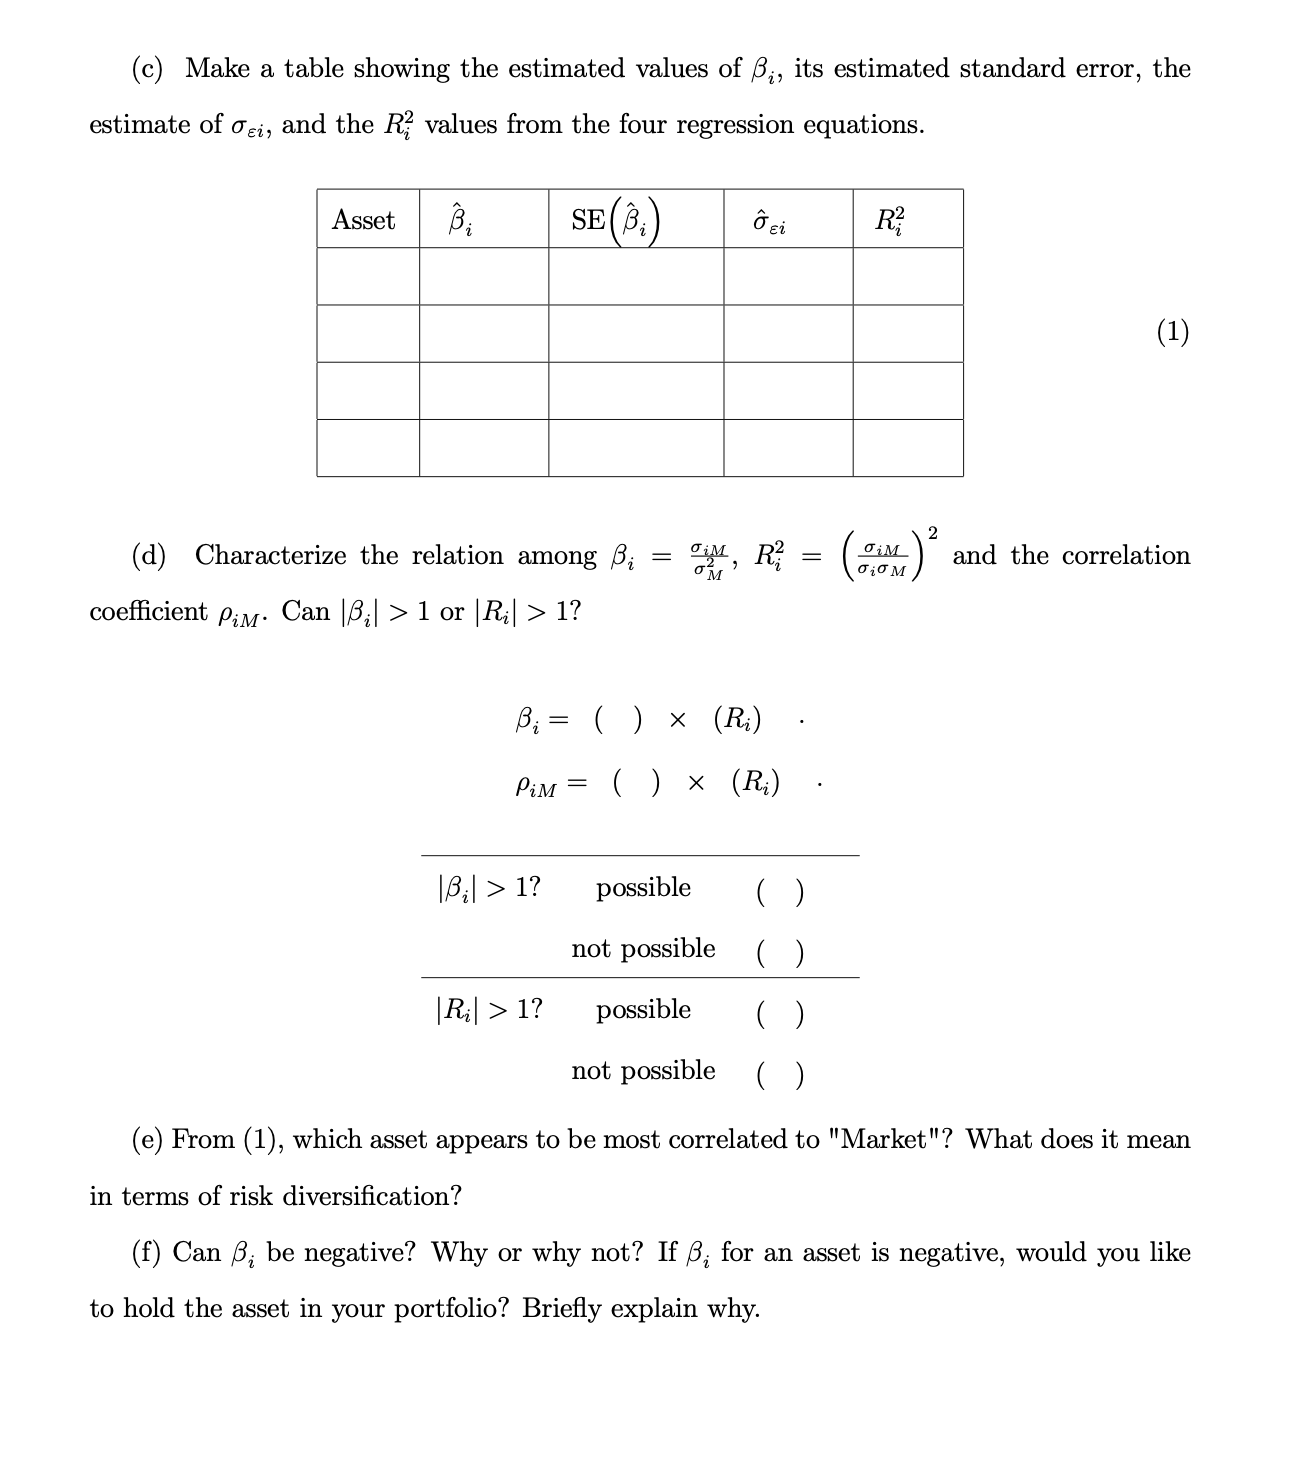
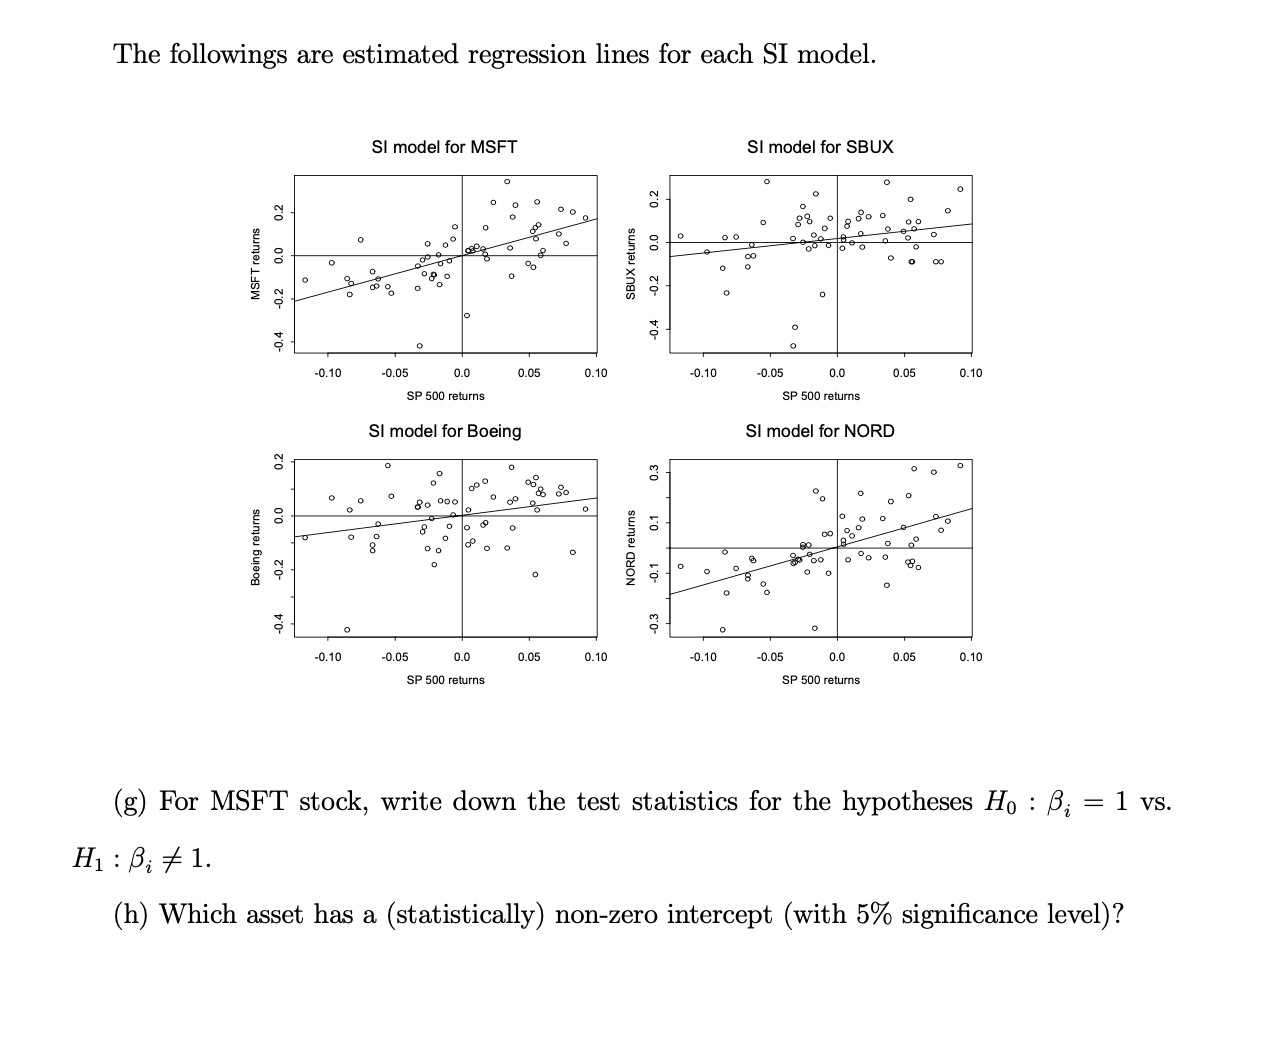
3. Single Index Model for asset returns has the form Rit where = i = t = = i + RMt + Eit, Eit ~ iid N (0,0) where Rit denotes the cc return on asset i at time t, and RMt denotes the return on a market index portfolio at time t. (a) In the SI model, what are the interpretations of ; and ei? (b) SI model with large portfolios can be constructed as N 1, ..., N assets, 1,..., T time periods, i=1 N - Rit i=1 N air = B Rp,t = + BRMt+t, In a large "well diversified" portfolio, we could diversify away all non-market variance, hence Rp.t +RMt. Briefly explain how this is possible. N i=1 B, and Et = N N (SI Model) i=1 E it. We may use the S&P 500 index as the "market return" for our SI model. The following represents R linear regression output from estimating the SI model for the four North- west stocks (Boeing, Microsoft, Nordstrom and Starbucks) using monthly continuously com- pounded return data over the the period November 1998 - October 2003. > summary(boeing.fit) Coefficients: Estimate Std. Error t value Pr(> [t]) (Intercept) 0.00216 0.01366 0.16 0.875 sp500 0.63862 0.27354 2.33 0.023 * Residual standard error: 0.106 on 58 degrees of freedom Multiple R-squared: 0.0859, Adjusted R-squared: 0.0701 F-statistic: 5.45 on 1 and 58 DF, p-value: 0.023 > summarv(nord.fit) Coefficients: Estimate Std. Error t value Pr(>[t!) (Intercept) 0.00432 0.01414 0.31 0.76 sp500 1.50799 0.28312 5.33 1.70E-06 *** Residual standard error: 0.11 on 58 degrees of freedom Multiple R-squared: 0.328, Adjusted R-squared: 0.317 F-statistic: 28.4 on 1 and 58 DF, p-value: 1.7e-06 > summary(msft.fit) Coefficients: Estimate Std. Error t value Pr(>[t!) (Intercept) 0.0012 sp500 0.014 0.09 0.93 1.6971 0.2808 6.04 1.20E-07 *** Residual standard error: 0.109 on 58 degrees of freedom Multiple R-squared: 0.386, Adjusted R-squared: 0.376 F-statistic: 36.5 on 1 and 58 DF, p-value: 1.16e-07 > summarv(sbux.fit) Coefficients: Estimate Std. Error t value Pr(>[t!) (Intercept) 0.0183 0.0171 1.07 0.288 sp500 0.6666 0.3418 1.95 0.056. Residual standard error: 0.132 on 58 degrees of freedom Multiple R-squared: 0.0615, Adjusted R-squared: 0.0454 F-statistic: 3.8 on 1 and 58 DF, p-value: 0.056 Signif. codes: 0 ***' 0.001 '**' 0.01 '*' 0.05 0.11 (c) Make a table showing the estimated values of ;, its estimated standard error, the estimate of oi, and the R values from the four regression equations. SE (3.) Asset 3. = (d) Characterize the relation among coefficient PM. Can |;| > 1 or | Ri| > 1? |B| B = ( ) (Ri) ci PiM ( ) (R) > 1? = |R| > 1? OM, R = (cm) R/ possible not possible possible not possible ( ) (e) From (1), which asset appears to be most correlated to "Market"? What does it mean in terms of risk diversification? ( ) (1) and the correlation (f) Can , be negative? Why or why not? If , for an asset is negative, would to hold the asset in your portfolio? Briefly explain why. you like The followings are estimated regression lines for each SI model. MSFT returns 0.2 -0.2 0.0 -0.4 0.2 0.0 Boeing returns -0.2 O -0.10 O -0.10 8 O O O o SI model for MSFT o 0 O 8 -0.05 O O o O -0.05 08 0 8 o 0 0.0 SP 500 returns SI model for Boeing 0 O 80 00 O O 28 0 00 0 8 9 0.0 SP 500 returns O O O o 0 0 0 O O S % 0.05 O % % 0.05 O 0.10 O 0.10 0.2 SBUX returns -0.2 0.0 0.4 0.3 0.1 NORD returns -0.1 8 0 O -0.10 O -0.10 00 O 0 O O SI model for SBUX O 00 O O -0.05 8 0 o O O -0.05 o O 0.0 SP 500 returns O SI model for NORD 00 0 O 8 00 O O 0 0.0 SP 500 returns O O O o O O 0 o 0.05 0 0 0.05 O O 00 O O 0.10 0.10 (g) For MSFT stock, write down the test statistics for the hypotheses Ho : ; = 1 vs. H : B; # 1. (h) Which asset has a (statistically) non-zero intercept (with 5% significance level)? 3. Single Index Model for asset returns has the form Rit where = i = t = = i + RMt + Eit, Eit ~ iid N (0,0) where Rit denotes the cc return on asset i at time t, and RMt denotes the return on a market index portfolio at time t. (a) In the SI model, what are the interpretations of ; and ei? (b) SI model with large portfolios can be constructed as N 1, ..., N assets, 1,..., T time periods, i=1 N - Rit i=1 N air = B Rp,t = + BRMt+t, In a large "well diversified" portfolio, we could diversify away all non-market variance, hence Rp.t +RMt. Briefly explain how this is possible. N i=1 B, and Et = N N (SI Model) i=1 E it. We may use the S&P 500 index as the "market return" for our SI model. The following represents R linear regression output from estimating the SI model for the four North- west stocks (Boeing, Microsoft, Nordstrom and Starbucks) using monthly continuously com- pounded return data over the the period November 1998 - October 2003. > summary(boeing.fit) Coefficients: Estimate Std. Error t value Pr(> [t]) (Intercept) 0.00216 0.01366 0.16 0.875 sp500 0.63862 0.27354 2.33 0.023 * Residual standard error: 0.106 on 58 degrees of freedom Multiple R-squared: 0.0859, Adjusted R-squared: 0.0701 F-statistic: 5.45 on 1 and 58 DF, p-value: 0.023 > summarv(nord.fit) Coefficients: Estimate Std. Error t value Pr(>[t!) (Intercept) 0.00432 0.01414 0.31 0.76 sp500 1.50799 0.28312 5.33 1.70E-06 *** Residual standard error: 0.11 on 58 degrees of freedom Multiple R-squared: 0.328, Adjusted R-squared: 0.317 F-statistic: 28.4 on 1 and 58 DF, p-value: 1.7e-06 > summary(msft.fit) Coefficients: Estimate Std. Error t value Pr(>[t!) (Intercept) 0.0012 sp500 0.014 0.09 0.93 1.6971 0.2808 6.04 1.20E-07 *** Residual standard error: 0.109 on 58 degrees of freedom Multiple R-squared: 0.386, Adjusted R-squared: 0.376 F-statistic: 36.5 on 1 and 58 DF, p-value: 1.16e-07 > summarv(sbux.fit) Coefficients: Estimate Std. Error t value Pr(>[t!) (Intercept) 0.0183 0.0171 1.07 0.288 sp500 0.6666 0.3418 1.95 0.056. Residual standard error: 0.132 on 58 degrees of freedom Multiple R-squared: 0.0615, Adjusted R-squared: 0.0454 F-statistic: 3.8 on 1 and 58 DF, p-value: 0.056 Signif. codes: 0 ***' 0.001 '**' 0.01 '*' 0.05 0.11 (c) Make a table showing the estimated values of ;, its estimated standard error, the estimate of oi, and the R values from the four regression equations. SE (3.) Asset 3. = (d) Characterize the relation among coefficient PM. Can |;| > 1 or | Ri| > 1? |B| B = ( ) (Ri) ci PiM ( ) (R) > 1? = |R| > 1? OM, R = (cm) R/ possible not possible possible not possible ( ) (e) From (1), which asset appears to be most correlated to "Market"? What does it mean in terms of risk diversification? ( ) (1) and the correlation (f) Can , be negative? Why or why not? If , for an asset is negative, would to hold the asset in your portfolio? Briefly explain why. you like The followings are estimated regression lines for each SI model. MSFT returns 0.2 -0.2 0.0 -0.4 0.2 0.0 Boeing returns -0.2 O -0.10 O -0.10 8 O O O o SI model for MSFT o 0 O 8 -0.05 O O o O -0.05 08 0 8 o 0 0.0 SP 500 returns SI model for Boeing 0 O 80 00 O O 28 0 00 0 8 9 0.0 SP 500 returns O O O o 0 0 0 O O S % 0.05 O % % 0.05 O 0.10 O 0.10 0.2 SBUX returns -0.2 0.0 0.4 0.3 0.1 NORD returns -0.1 8 0 O -0.10 O -0.10 00 O 0 O O SI model for SBUX O 00 O O -0.05 8 0 o O O -0.05 o O 0.0 SP 500 returns O SI model for NORD 00 0 O 8 00 O O 0 0.0 SP 500 returns O O O o O O 0 o 0.05 0 0 0.05 O O 00 O O 0.10 0.10 (g) For MSFT stock, write down the test statistics for the hypotheses Ho : ; = 1 vs. H : B; # 1. (h) Which asset has a (statistically) non-zero intercept (with 5% significance level)?
Expert Answer:
Answer rating: 100% (QA)
a In the SI model represents the sensitivity or the coefficient of asset i with respect to the market index portfolio return RMt It measures the assets systematic risk or market risk A higher value of ... View the full answer

Related Book For 

Posted Date:
Students also viewed these economics questions
-
Place the three steps in the financial planning process in order from beginning to end with the first step at the top. developing budgets, forecasting the firms financial needs, establishing...
-
re Regular Languages and Finite Automata (a) Let L be the set of all strings over the alphabet {a, b} that end in a and do not contain the substring bb. Describe a deterministic finite automaton...
-
The operating system typically provides each process with the illusion that it runs in a contiguous piece of memory. State the problem of external fragmentation in memory where processes have...
-
Scott incorporates his sole proprietorship as Superior Corporation and transfers its assets to Superior in exchange for all 100 shares of Superior stock and four $7,500 interest-bearing notes. The...
-
In view of its many attractive features, why has vapor degreasing become an unattractive process?
-
Assume the same facts as for Question 1 above. The fair value of the investment in Company E is $220,000 on December 31, 2015. Answer the following questions assuming the investment is recorded using...
-
Discuss the relationship between investment risk and the expected rate of return on an investment. Explain why accounting information is useful in evaluating the risk/return trade-off inherent in all...
-
The comparative balance sheets of Nike, Inc. are presented here. Instructions(a) Prepare a horizontal analysis of the balance sheet data for Nike, using 2008 as a base.(Show the amount of increase or...
-
(Selecting a benchmark company) Here you will find the income statements and balance sheets for Sears Holdings (SHLD) and Target Corp (TGT). Assume that you are a financial manager at Sears and want...
-
Wayland Custom Woodworking is a firm that manufactures custom cabinets and woodwork for business and residential customers. Students will have the opportunity to establish payroll records and to...
-
Simon Company's high and low level of activity last year was 60,000 units of product produced in May and 20,000 units produced in November. Machine maintenance costs were $78,000 in May and $30,000...
-
Indicate how do you think that you will benefit both personally and professionally by taking Introduction to economic course?
-
In this project you are going to design a traffic-light controller for the street intersection shown in the figure below to prevent accidental collisions. Objects on street A can move in both...
-
You re going to have a party at your house. Your friends will bring their own alcohol and / or recreational drugs. What if one of your friends gets intoxicated, leaves your house, gets into their...
-
Use the data to compute daily returns for Microsoft, the S&P index, and gold. Compute returns from the previous trading day's price to the current day's (You will lose one observation). The risk-free...
-
Consider the series 8 n=1 (4x)n n Find the interval of convergence of this power series by first using the ratio test to find its radius of convergence and then testing the series' behavior at the...
-
I am currently working on a project involving the use of physics and programming. I do not have any information with me because I just found a problem online and I cant find it but lets say...
-
14. In testing the existence assertion, an auditor ordinarily works from the a. Financial statements to the accounting records. b. General journal to the general ledger. c. Supporting evidence to the...
-
Fill in each blank so that the resulting statement is true. In 2000, 31% of U.S. adults viewed a college education as essential for success. For the period from 2000 through 2010, this percentage...
-
In Exercises 4170, use properties of logarithms to condense each logarithmic expression. Write the expression as a single logarithm whose coefficient is 1. Where possible, evaluate logarithmic...
-
Use the graph of the rational function in the figure shown to complete each statement in Exercises 1520. 1 -5 -4 -3 -2 -1 Vertical asymptoto: x = -2 y 2+ - 1+ -1+ 1 2 Horizontal asymptoto: y = 1 + 3...
-
The multiple linear regression model (5.6) can be viewed as a first-order approximation of the general model \[ \begin{equation*} Y=g(\boldsymbol{x})+\varepsilon \tag{5.42} \end{equation*} \] where...
-
Table 5. 6 shows data from an agricultural experiment where crop yield was measured for two levels of pesticide and three levels of fertilizer. There are three responses for each combination. (a)...
-
Prove (5.37) and (5.38).

Study smarter with the SolutionInn App