

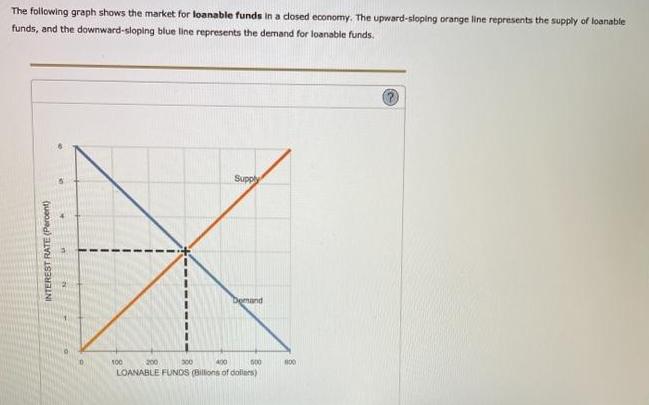
The following graph shows the market for loanable funds in a dosed economy. The upward-sloping orange...
Fantastic news! We've Found the answer you've been seeking!
Question:
Transcribed Image Text:
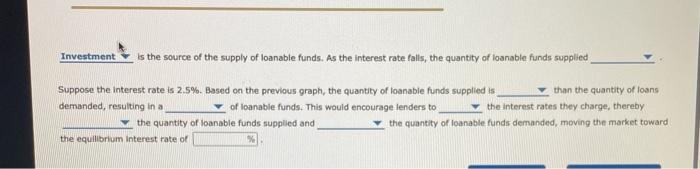
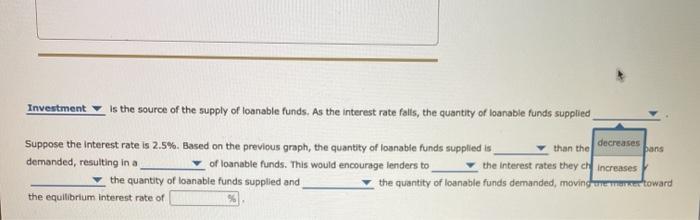
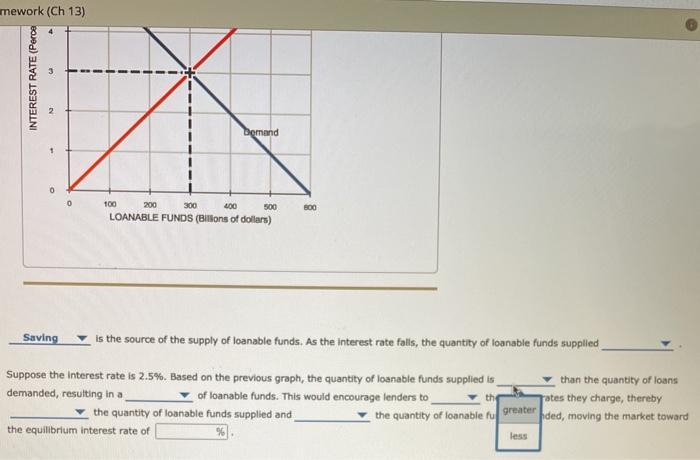
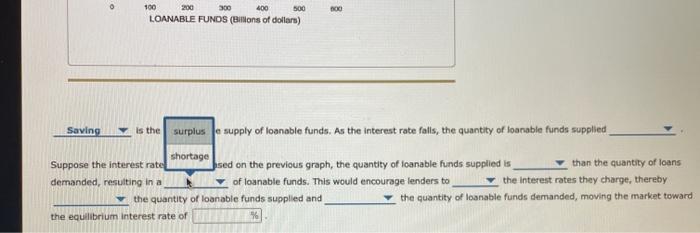
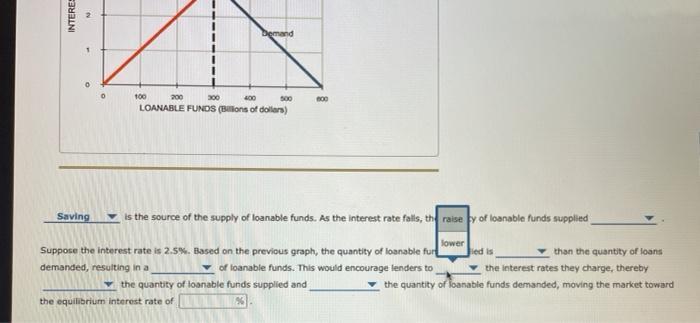
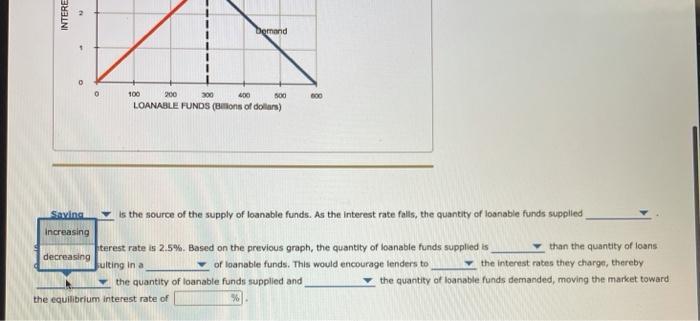
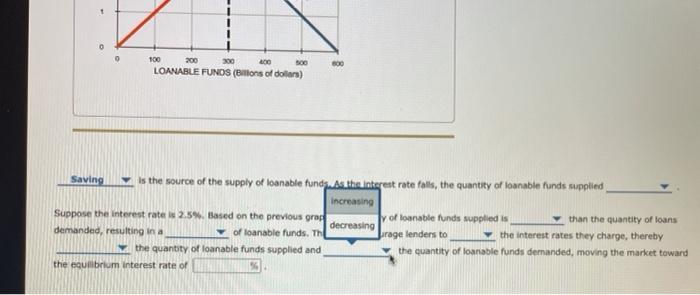
The following graph shows the market for loanable funds in a dosed economy. The upward-sloping orange line represents the supply of loanable funds, and the downward-sloping blue line represents the demand for loanable funds. Supply Demand 100 200 300 400 s00 LOANABLE FUNDS (BIllons of dollars) INTEREST RATE (Percent) Investment is the source of the supply of loanable funds. As the interest rate falls, the quantity of loanable funds supplied Suppose the interest rate is 2.5%. Based on the previous graph, the quantity of loanable funds supplied is demanded, resulting in a than the quantity of loans v of loanable funds. This would encourage lenders to v the interest rates they charge, thereby V the quantity of loanable funds supplied and the quantity of loanable funds demanded, moving the market toward the equilibrium interest rate of Investment Is the source of the supply of loanable funds. As the interest rate falls, the quantity of loanable funds supplied Suppose the Interest rate is 2.5%. Based on the previous graph, the quantity of loanable funds supplied is than the decreases pans demanded, resulting in a of loanable funds. This would encourage lenders to the interest rates they ch increases the quantity of loanable funds supplied and the quantity of loanable funds demanded, moving emanertoward the equilibrium Interest rate of mework (Ch 13) bemand 100 200 300 400 500 600 LOANABLE FUNDS (BIllons of dollars) Saving is the source of the supply of loanable funds. As the interest rate falls, the quantity of loanable funds supplied Suppose the interest rate is 2.5%. Based on the previous graph, the quantity of loanable funds supplied is than the quantity of loans demanded, resulting in a of loanable funds. This would encourage lenders to the greater rates they charge, thereby the quantity of loanable funds supplied and the quantity of loanable fu ded, moving the market toward the equilibrlum interest rate of less INTEREST RATE (Perce 100 200 300 400 500 LOANABLE FUNDS (BIlons of dollars) Saving is the surplus e supply of loanable funds. As the interest rate falls, the quantity of loanable funds supplied shortage Suppose the interest rate sed on the previous graph, the quantity of loanable funds supplied is than the quantity of loans demanded, resulting in a v of loanable funds. This would encourage lenders to the interest rates they charge, thereby v the quantity of loanable funds supplied and the quantity of loanable funds demanded, moving the market toward the equilibrium interest rate of Demand 100 200 300 400 500 LOANABLE FUNDS (Blons of dollars) Saving is the source of the supply of loanable funds. As the interest rate falls, the raise y of loanable funds supplied lower Suppose the interest rate is 2.5%. Based on the previous graph, the quantity of loanable fur ied is than the quantity of loans demanded, resulting in a v of loanable funds. This would encourage lenders to v the interest rates they charge, thereby - the quantity of loanable funds demanded, moving the market toward Y the quantity of loanable funds supplied and the equilibrium interest rate of INTERE Demand 100 200 300 400 500 600 LOANABLE FUNDS (Blons of dollars) Saving is the source of the supply of loanable funds. As the interest rate falls, the quantity of loanable funds supplied increasing terest rate is 2.5%. Based on the previous graph, the quantity of loanable funds supplied is v of loanable funds. This would encourage lenders to than the quantity of loans decreasing sulting in a v the interest rates they charge, thereby the quantity of loanable funds supplied and the quantity of loanable funds demanded, moving the market toward the equilibrium interest rate of INTERE 100 200 300 400 s00 600 LOANABLE FUNDS (BIllons of dollars) Saving is the source of the supply of loanable funds. As the interest rate falls, the quantity of loanable funds supplied increasing Suppose the interest rate is 2.5%. Based on the previous grap y of loanable funds supplied is than the quantity of loans v the interest rates they charge, thereby the quantity of loanable funds demanded, moving the market toward decreasing demanded, resulting in a v of loanable funds. Th Jarage lenders to the quantity of loanable funds supplied and the equilibrium interest rate of The following graph shows the market for loanable funds in a dosed economy. The upward-sloping orange line represents the supply of loanable funds, and the downward-sloping blue line represents the demand for loanable funds. Supply Demand 100 200 300 400 s00 LOANABLE FUNDS (BIllons of dollars) INTEREST RATE (Percent) Investment is the source of the supply of loanable funds. As the interest rate falls, the quantity of loanable funds supplied Suppose the interest rate is 2.5%. Based on the previous graph, the quantity of loanable funds supplied is demanded, resulting in a than the quantity of loans v of loanable funds. This would encourage lenders to v the interest rates they charge, thereby V the quantity of loanable funds supplied and the quantity of loanable funds demanded, moving the market toward the equilibrium interest rate of Investment Is the source of the supply of loanable funds. As the interest rate falls, the quantity of loanable funds supplied Suppose the Interest rate is 2.5%. Based on the previous graph, the quantity of loanable funds supplied is than the decreases pans demanded, resulting in a of loanable funds. This would encourage lenders to the interest rates they ch increases the quantity of loanable funds supplied and the quantity of loanable funds demanded, moving emanertoward the equilibrium Interest rate of mework (Ch 13) bemand 100 200 300 400 500 600 LOANABLE FUNDS (BIllons of dollars) Saving is the source of the supply of loanable funds. As the interest rate falls, the quantity of loanable funds supplied Suppose the interest rate is 2.5%. Based on the previous graph, the quantity of loanable funds supplied is than the quantity of loans demanded, resulting in a of loanable funds. This would encourage lenders to the greater rates they charge, thereby the quantity of loanable funds supplied and the quantity of loanable fu ded, moving the market toward the equilibrlum interest rate of less INTEREST RATE (Perce 100 200 300 400 500 LOANABLE FUNDS (BIlons of dollars) Saving is the surplus e supply of loanable funds. As the interest rate falls, the quantity of loanable funds supplied shortage Suppose the interest rate sed on the previous graph, the quantity of loanable funds supplied is than the quantity of loans demanded, resulting in a v of loanable funds. This would encourage lenders to the interest rates they charge, thereby v the quantity of loanable funds supplied and the quantity of loanable funds demanded, moving the market toward the equilibrium interest rate of Demand 100 200 300 400 500 LOANABLE FUNDS (Blons of dollars) Saving is the source of the supply of loanable funds. As the interest rate falls, the raise y of loanable funds supplied lower Suppose the interest rate is 2.5%. Based on the previous graph, the quantity of loanable fur ied is than the quantity of loans demanded, resulting in a v of loanable funds. This would encourage lenders to v the interest rates they charge, thereby - the quantity of loanable funds demanded, moving the market toward Y the quantity of loanable funds supplied and the equilibrium interest rate of INTERE Demand 100 200 300 400 500 600 LOANABLE FUNDS (Blons of dollars) Saving is the source of the supply of loanable funds. As the interest rate falls, the quantity of loanable funds supplied increasing terest rate is 2.5%. Based on the previous graph, the quantity of loanable funds supplied is v of loanable funds. This would encourage lenders to than the quantity of loans decreasing sulting in a v the interest rates they charge, thereby the quantity of loanable funds supplied and the quantity of loanable funds demanded, moving the market toward the equilibrium interest rate of INTERE 100 200 300 400 s00 600 LOANABLE FUNDS (BIllons of dollars) Saving is the source of the supply of loanable funds. As the interest rate falls, the quantity of loanable funds supplied increasing Suppose the interest rate is 2.5%. Based on the previous grap y of loanable funds supplied is than the quantity of loans v the interest rates they charge, thereby the quantity of loanable funds demanded, moving the market toward decreasing demanded, resulting in a v of loanable funds. Th Jarage lenders to the quantity of loanable funds supplied and the equilibrium interest rate of
Expert Answer:
Answer rating: 100% (QA)
a Saving is the source of the loanable funds b As the interest rate falls the quantity ... View the full answer

Posted Date:
Students also viewed these marketing questions
-
The most likely reason is because of our supply and demand for questions. There are two scenarios: You have skipped through all available questions Once a question is skipped, it will never come back...
-
The following graph represents the domestic supply and demand for coal. a. In the absence of trade, what is the equilibrium price and equilibrium quantity? b. The government opens the market to free...
-
The weekly supply and demand for fast-food cheeseburgers in your city is shown in Figure 6P-3. In an effort to curb a looming budget deficit, the mayor recently proposed a tax that would be levied on...
-
Given the following data: Calculate ÎH for the reaction On the basis of enthalpy change, is this a useful reaction for the synthesis of ammonia? AH - 92 kJ () + AH = -484 k (g) ON OH 88
-
What forms of conflict are on display at Barcelona? What structural and personal factors are likely causes of this conflict?
-
Valley Stores, a U.S. department store chain, annually negotiates a contract with Alpine Watch Company, located in Switzerland, to purchase a large shipment of watches. On November 15, 2001, Valley...
-
What are conversion costs? In a job costing system, at least some conversion costs are assigned directly to products. Why do all conversion costs need to be assigned to processing departments in a...
-
The Sports Equipment Division of Brandon McCarthy Company is operated as a profit center. Sales for the division were budgeted for 2010 at $900,000. The only variable costs budgeted for the division...
-
When an object is placed between the pole(P) and focus(F) of a concave mirror, the image formed is (i) behind the mirror (ii) virtual and erect and (iii) larger than the object (or magnified) M A' E...
-
Part One: In 2015, Fran Lexa opened Fran's Flowers, a small shop selling floral arrangements. On December 31, 2016, her accounting records show the following: Sales revenue...
-
Q1 - Analyse 3 types of buyer-supplier relationships and identify which you belive to be the most beneficial in achieving long term goals between buyers and suppliers .Substantiate your answer . Q2 -...
-
An astronaut on the International Space Station gently releases a satellite that has a mass much smaller than the mass of the station. Describe the motion of the satellite after release.
-
What process do you follow to make decisions for these different circumstances, and are you satisfied with the results?
-
What is the gravitational potential energy of the EarthSun system?
-
At December 31, Beijing Supply prepares an adjusting entry for a product warranty contract. Which of the following accounts is/are included in the entry? a. Miscellaneous Expense. b. Warranty...
-
The parabolic orbit of any comet around the Sun might be described as a collision between the two objects. Would it be better described as an elastic collision or an inelastic collision?
-
The VP of Marketing of a large store finds sales declining inspite of increase in dollars spent on advertising and promotion. As market research professionals what would your advice be to him/her?
-
Write the binomial probability in words. Then, use a continuity correction to convert the binomial probability to a normal distribution probability. P(x 110)
-
Grill Master Company sells total outdoor grilling solutions, providing gas and charcoal grills, accessories, and installation services for custom patio grilling stations. Instructions Respond to the...
-
Refer to the revenue arrangement in P18-1. Instructions Consider the following information and respond to the requirements indicated. (a) In response to competitive pressures for the Internet access...
-
Tablet Tailors sells tablet PCs combined with Internet service (Tablet Bundle A) that permits the tablet to connect to the Internet anywhere (set up a Wi-Fi hot spot). The price for the tablet and a...

Study smarter with the SolutionInn App