

9 7/11 points Download the data set called FIFA_Data from canvas and open it in JMP....
Fantastic news! We've Found the answer you've been seeking!
Question:
Transcribed Image Text:
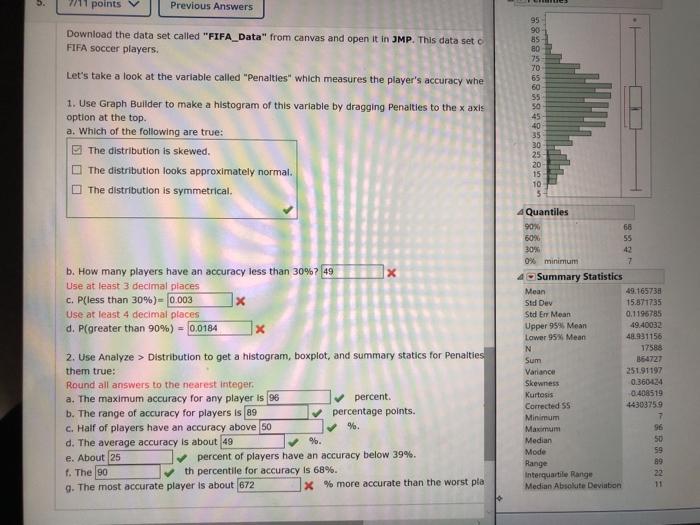
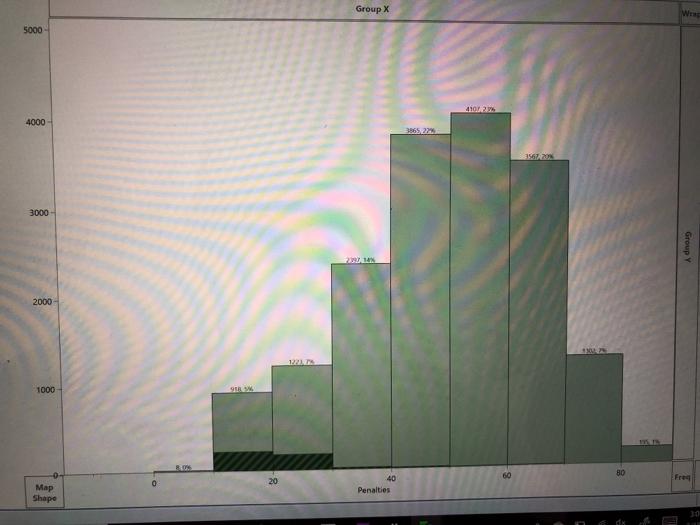
9 7/11 points Download the data set called "FIFA_Data" from canvas and open it in JMP. This data set c FIFA soccer players. Let's take a look at the variable called "Penalties" which measures the player's accuracy whe 1. Use Graph Builder to make a histogram of this variable by dragging Penalties to the x axis option at the top. a. Which of the following are true: The distribution is skewed. Previous Answers The distribution looks approximately normal. The distribution is symmetrical. b. How many players have an accuracy less than 30% ? 49 Use at least 3 decimal places c. P(less than 30%) = 0.003 Use at least 4 decimal places d. P(greater than 90%) = 0.0184 x 2. Use Analyze > Distribution to get a histogram, boxplot, and summary statics for Penalties them true: Round all answers to the nearest Integer. a. The maximum accuracy for any player is 96 b. The range of accuracy for players is 89 c. Half of players have an accuracy above 50 d. The average accuracy is about 49 e. About 25 x f. The 90 g. The most accurate player is about 672 percent. percentage points. ✓ %. ✓ percent of players have an accuracy below 39%. th percentile for accuracy is 68%. X% more accurate than the worst pla 95 90 85 80 75 70 65 60 55 50 45 40 35 30 25 20 15 10 5 4 Quantiles 90% 60% 30% 0% minimum Summary Statistics Mean Std Dev Std Err Mean Upper 95% Mean Lower 95% Mean N Sum Variance Skewness Kurtosis Corrected 55 Minimum Maximum Median Mode Range Interquartile Range Median Absolute Deviation 68 55 42 7 49.165738 15.871735 0.1196785 49.40032 48.931156 17588 864727 251.91197 0.360424 0.408519 4430375.9 7 96 50 59 89 22 11 5000- 4000 3000 2000 1000 Map Shape 20 1221, 7 Group X 2397,14% 40 Penalties 3865,27% 4107 27% 60 3567-20% 1300. P 15. 15 Wrap Group Y Freq 9 7/11 points Download the data set called "FIFA_Data" from canvas and open it in JMP. This data set c FIFA soccer players. Let's take a look at the variable called "Penalties" which measures the player's accuracy whe 1. Use Graph Builder to make a histogram of this variable by dragging Penalties to the x axis option at the top. a. Which of the following are true: The distribution is skewed. Previous Answers The distribution looks approximately normal. The distribution is symmetrical. b. How many players have an accuracy less than 30% ? 49 Use at least 3 decimal places c. P(less than 30%) = 0.003 Use at least 4 decimal places d. P(greater than 90%) = 0.0184 x 2. Use Analyze > Distribution to get a histogram, boxplot, and summary statics for Penalties them true: Round all answers to the nearest Integer. a. The maximum accuracy for any player is 96 b. The range of accuracy for players is 89 c. Half of players have an accuracy above 50 d. The average accuracy is about 49 e. About 25 x f. The 90 g. The most accurate player is about 672 percent. percentage points. ✓ %. ✓ percent of players have an accuracy below 39%. th percentile for accuracy is 68%. X% more accurate than the worst pla 95 90 85 80 75 70 65 60 55 50 45 40 35 30 25 20 15 10 5 4 Quantiles 90% 60% 30% 0% minimum Summary Statistics Mean Std Dev Std Err Mean Upper 95% Mean Lower 95% Mean N Sum Variance Skewness Kurtosis Corrected 55 Minimum Maximum Median Mode Range Interquartile Range Median Absolute Deviation 68 55 42 7 49.165738 15.871735 0.1196785 49.40032 48.931156 17588 864727 251.91197 0.360424 0.408519 4430375.9 7 96 50 59 89 22 11 5000- 4000 3000 2000 1000 Map Shape 20 1221, 7 Group X 2397,14% 40 Penalties 3865,27% 4107 27% 60 3567-20% 1300. P 15. 15 Wrap Group Y Freq
Expert Answer:

Related Book For 

Posted Date:
Students also viewed these accounting questions
-
Use statistics software to make a histogram of this data set: 44, 45, 51, 40, 28, 46, 34, 19. a. Based on the histogram, predict what a box plot of the data will look like. b. Use the software to...
-
Take a look at Figure 21-1. Suppose that Q1 = 10 acres and P1 = $2,000 per acre. What is the dollar amount of economic rents received during the current period, and why is this amount classified as...
-
In this assignment, we will take a look at science and the scientific method. Then, you will design a (pretend) scientific study to answer a specific question based upon a observation. First choose...
-
All of the following are advantages of licensing EXCEPT: the foreign country gains employment by having the product manufactured locally. the licensee gains information that allows it to start with a...
-
What is the compounding period for most bonds sold in the United States?
-
Dillman Corporation has nexus in States A and B. Dillmans activities for the year are summarized below. Determine the apportionment factors for A and B assuming that A uses a three-factor...
-
Consider the series circuit in Figure 3. 16 with \(L=1.00 \mathrm{H}, R_{1}=R_{2}=\) \(1.00 \times 10^{2} \Omega, C=1.00 \times 10^{-4} \mathrm{~F}\), and \(V_{0}=1.00 \times 10^{3} \mathrm{~V}\). a....
-
Britains Health and Safety Executive (HSE) is a national regulatory body overseeing workplace health and safety. In its 2007 performance report, HSE reported the following statistics: 241 workers...
-
Hansco borrowed $5237 paying interest at 4.74%compounded annually. If the loan is repaid by payments of $278 madeat the end of each year. Find the number of payments.Round your answer to 8 decimal 2...
-
Lopez Company reported the following current-year data for its only product. The company uses a periodic inventory system, and its ending inventory consists of 150 units50 from each of the last three...
-
David Ding Baseball Bat Company currently has $3 million in debt outstanding, bearing an interest rate of 12 percent. It wishes to finance a $4 million expansion program and is considering three...
-
Who performs tests on engineered products to determine their reliability and suitability?
-
Consider the pitching motion of an automobile. The figure below on the left shows a simplified model of the auto body and rear and front springs. The figure below on the right shows the coupling of...
-
The graph depicts a series of changes in the market for oil. The initial demand curve is D1, and the initial (short-run) supply curve is SSR. First, the demand for oil changes from D1 to D2. This...
-
What item can sell to a larger company with many competitiors. ( such as selling a shoe fitting duffle bag to Nike) Company profile. Provide a description of the company you are selling your product...
-
Who is liable if a customer purchased a home with known issues but you didn't offer additional options to cover them.
-
describes the impact of feminist critiques within the history of family therapy. Explain the shortcomings that feminist critiques addressed in the early days of Family Therapy that have contributed...
-
Nate prepares slides for his microscope. In 1 day he prepared 12 different slides. Which equation best represents y, the total number of slides Nate prepares in x days if he continues at this rate? A...
-
What is a market offering? Give a recent example of a market offering that has satisfied your need or want.
-
Describe the strategies market challengers can adopt and explain why challengers might have an advantage over market leaders?
-
What competitive thinking moved Volkswagen, one of the world's major automakers, to cheat on emission standards rather than comply with them? How could Volkswagen have prevented this scandal, and...
-
\(P(60
-
\(P(x <55)\) In Exercises 27-32, the random variable \(x\) is normally distributed with mean \(\mu=74\) and standard deviation \(\sigma=8\). Find the indicated probability.
-
\(P(x <84)\) In Exercises 27-32, the random variable \(x\) is normally distributed with mean \(\mu=74\) and standard deviation \(\sigma=8\). Find the indicated probability.

Study smarter with the SolutionInn App