

6 8 The table containing the realized return of the S&P 500 from 1929-2014 is given...
Fantastic news! We've Found the answer you've been seeking!
Question:
Transcribed Image Text:
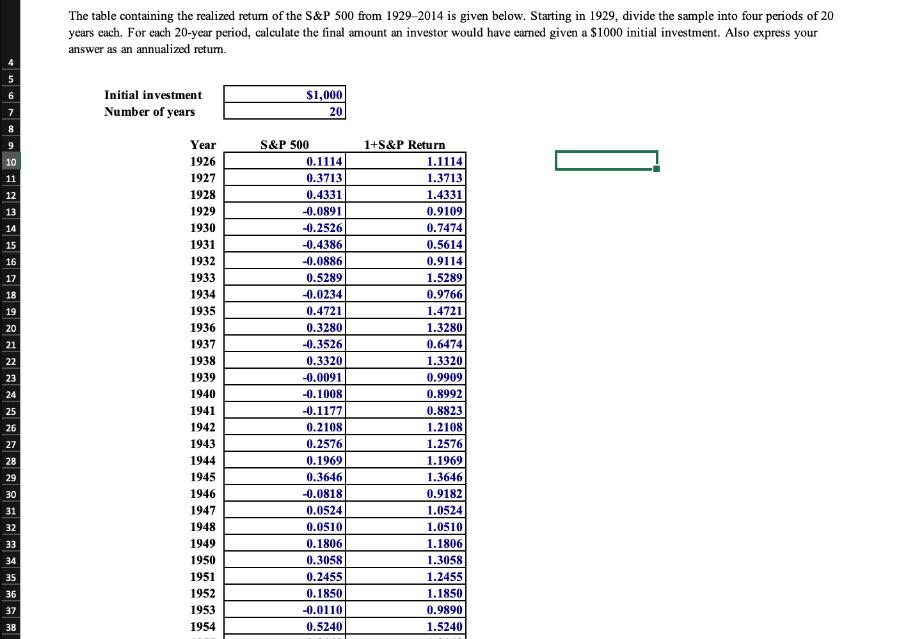
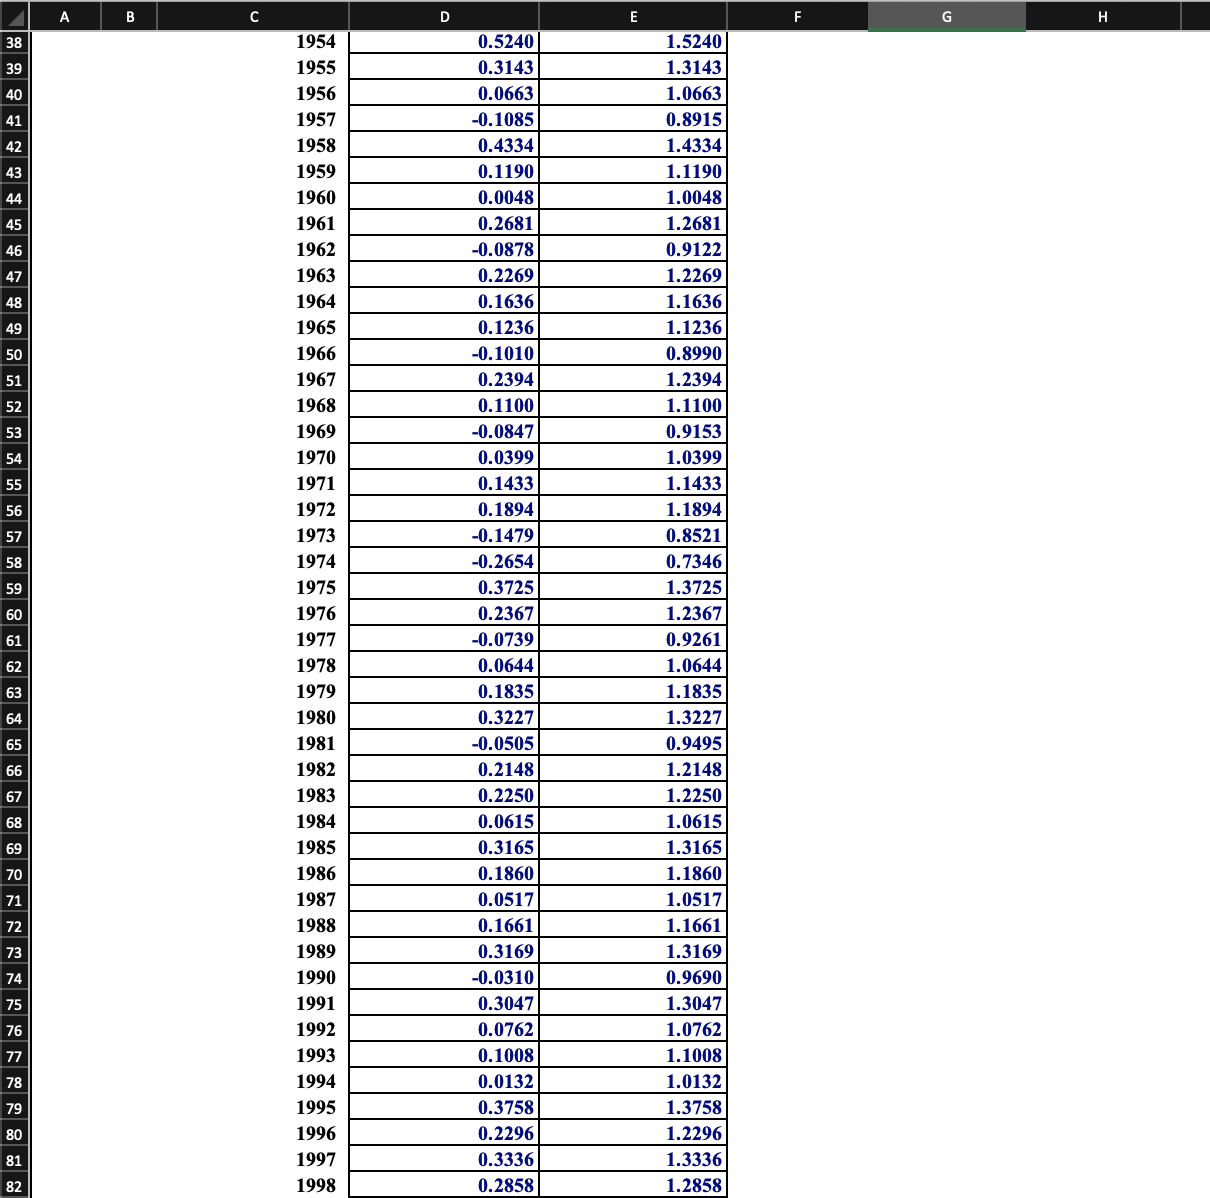
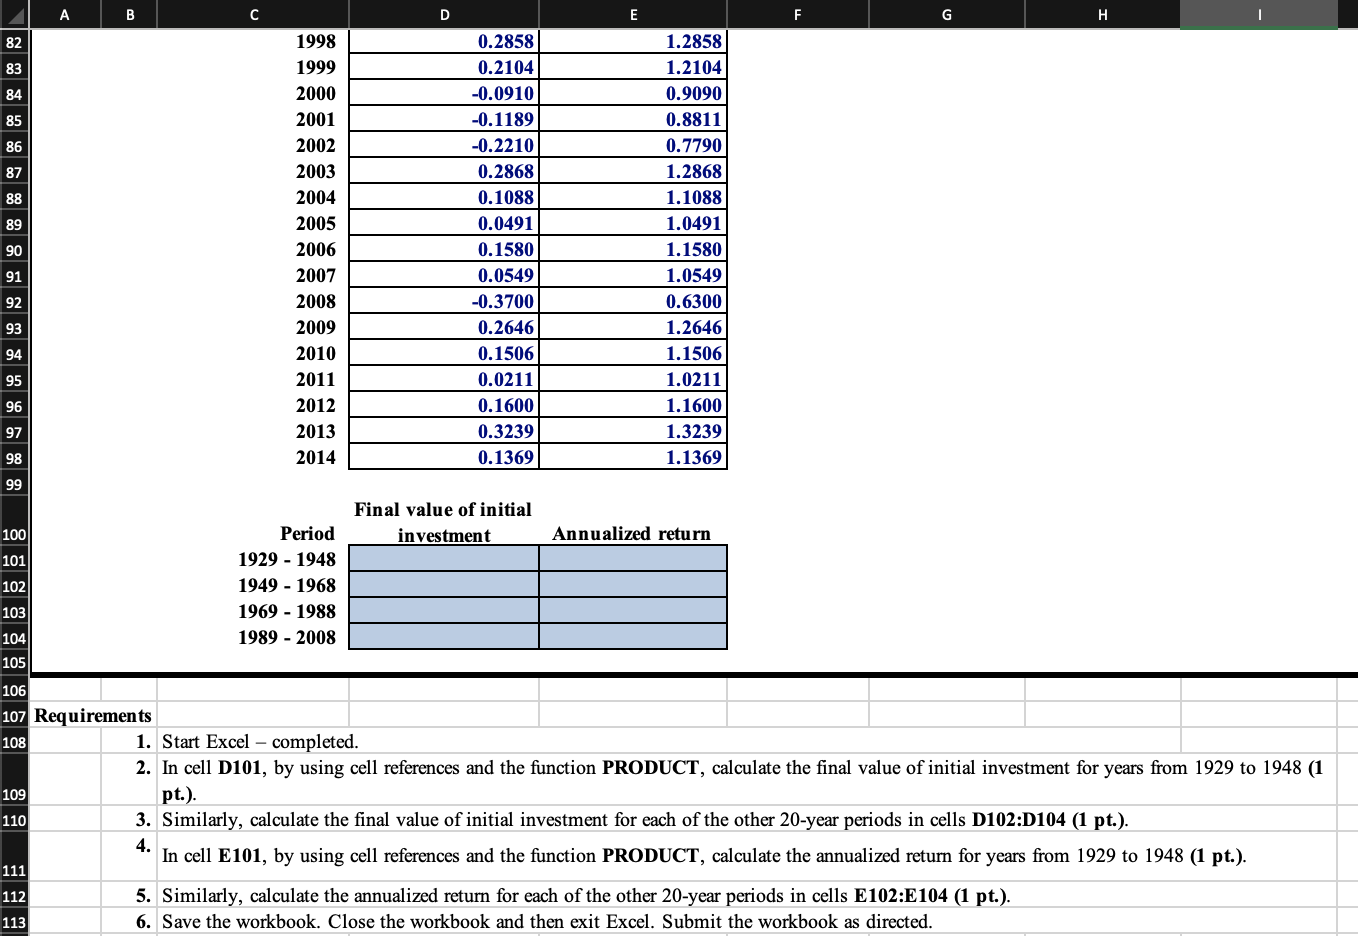
6 8 The table containing the realized return of the S&P 500 from 1929-2014 is given below. Starting in 1929, divide the sample into four periods of 20 years each. For each 20-year period, calculate the final amount an investor would have earned given a $1000 initial investment. Also express your answer as an annualized return. Initial investment Number of years $1,000 20 Year S&P 500 1+S&P Return 10 1926 0.1114 1.1114 11 1927 0.3713 1.3713 12 1928 0.4331 1.4331 13 1929 -0.0891 0.9109 14 1930 -0.2526 0.7474 15 1931 -0.4386 0.5614 16 1932 -0.0886 0.9114 17 1933 0.5289 1.5289 18 1934 -0.0234 0.9766 19 1935 0.4721 1.4721 20 1936 0.3280 1.3280 21 1937 -0.3526 0.6474 22 1938 0.3320 1.3320 23 1939 -0.0091 0.9909 24 1940 -0.1008 0.8992 25 1941 -0.1177 0.8823 26 1942 0.2108 1.2108 27 1943 0.2576 1.2576 28 1944 0.1969 1.1969 29 1945 0.3646 1.3646 30 1946 -0.0818 0.9182 31 1947 0.0524 1.0524 32 1948 0.0510 1.0510 33 1949 0.1806 1.1806 34 1950 0.3058 1.3058 35 1951 0.2455 1.2455 36 1952 0.1850 1.1850 37 1953 -0.0110 0.9890 38 1954 0.5240 1.5240 B D E F H 69 79 80 8 8 & & R ^ R R 1954 0.5240 1.5240 39 1955 0.3143 1.3143 40 41 42 1956 0.0663 1.0663 1957 -0.1085 0.8915 1958 0.4334 1.4334 43 1959 0.1190 1.1190 1960 0.0048 1.0048 45 1961 0.2681 1.2681 46 1962 -0.0878 0.9122 1963 0.2269 1.2269 48 1964 0.1636 1.1636 49 1965 0.1236 1.1236 50 1966 -0.1010 0.8990 51 1967 0.2394 1.2394 52 1968 0.1100 1.1100 53 1969 -0.0847 0.9153 54 1970 0.0399 1.0399 55 1971 0.1433 1.1433 56 1972 0.1894 1.1894 57 1973 -0.1479 0.8521 58 1974 -0.2654 0.7346 59 1975 0.3725 1.3725 1976 0.2367 1.2367 61 1977 -0.0739 0.9261 62 1978 0.0644 1.0644 63 1979 0.1835 1.1835 64 1980 0.3227 1.3227 65 1981 -0.0505 0.9495 1982 0.2148 1.2148 1983 0.2250 1.2250 68 1984 0.0615 1.0615 1985 0.3165 1.3165 1986 0.1860 1.1860 71 1987 0.0517 1.0517 72 1988 0.1661 1.1661 73 1989 0.3169 1.3169 74 1990 -0.0310 0.9690 1991 0.3047 1.3047 76 1992 0.0762 1.0762 1993 0.1008 1.1008 78 1994 0.0132 1.0132 1995 0.3758 1.3758 1996 0.2296 1.2296 81 1997 0.3336 1.3336 82 1998 0.2858 1.2858 A B C D E F G H 8 6 8 8 8 8 8 1998 0.2858 1.2858 1999 0.2104 1.2104 2000 -0.0910 0.9090 2001 -0.1189 0.8811 2002 -0.2210 0.7790 2003 0.2868 1.2868 2004 0.1088 1.1088 2005 0.0491 1.0491 2006 0.1580 1.1580 2007 0.0549 1.0549 2008 -0.3700 0.6300 2009 0.2646 1.2646 2010 0.1506 1.1506 2011 0.0211 1.0211 2012 0.1600 1.1600 2013 0.3239 1.3239 2014 0.1369 1.1369 100 Period Final value of initial investment Annualized return 101 1929-1948 102 1949-1968 103 1969-1988 104 1989 - 2008 105 106 107 Requirements 108 109 110 1. Start Excel - completed. 2. In cell D101, by using cell references and the function PRODUCT, calculate the final value of initial investment for years from 1929 to 1948 (1 pt.). 3. Similarly, calculate the final value of initial investment for each of the other 20-year periods in cells D102:D104 (1 pt.). 4. In cell E101, by using cell references and the function PRODUCT, calculate the annualized return for years from 1929 to 1948 (1 pt.). 111 112 5. Similarly, calculate the annualized return for each of the other 20-year periods in cells E102:E104 (1 pt.). 113 6. Save the workbook. Close the workbook and then exit Excel. Submit the workbook as directed. 6 8 The table containing the realized return of the S&P 500 from 1929-2014 is given below. Starting in 1929, divide the sample into four periods of 20 years each. For each 20-year period, calculate the final amount an investor would have earned given a $1000 initial investment. Also express your answer as an annualized return. Initial investment Number of years $1,000 20 Year S&P 500 1+S&P Return 10 1926 0.1114 1.1114 11 1927 0.3713 1.3713 12 1928 0.4331 1.4331 13 1929 -0.0891 0.9109 14 1930 -0.2526 0.7474 15 1931 -0.4386 0.5614 16 1932 -0.0886 0.9114 17 1933 0.5289 1.5289 18 1934 -0.0234 0.9766 19 1935 0.4721 1.4721 20 1936 0.3280 1.3280 21 1937 -0.3526 0.6474 22 1938 0.3320 1.3320 23 1939 -0.0091 0.9909 24 1940 -0.1008 0.8992 25 1941 -0.1177 0.8823 26 1942 0.2108 1.2108 27 1943 0.2576 1.2576 28 1944 0.1969 1.1969 29 1945 0.3646 1.3646 30 1946 -0.0818 0.9182 31 1947 0.0524 1.0524 32 1948 0.0510 1.0510 33 1949 0.1806 1.1806 34 1950 0.3058 1.3058 35 1951 0.2455 1.2455 36 1952 0.1850 1.1850 37 1953 -0.0110 0.9890 38 1954 0.5240 1.5240 B D E F H 69 79 80 8 8 & & R ^ R R 1954 0.5240 1.5240 39 1955 0.3143 1.3143 40 41 42 1956 0.0663 1.0663 1957 -0.1085 0.8915 1958 0.4334 1.4334 43 1959 0.1190 1.1190 1960 0.0048 1.0048 45 1961 0.2681 1.2681 46 1962 -0.0878 0.9122 1963 0.2269 1.2269 48 1964 0.1636 1.1636 49 1965 0.1236 1.1236 50 1966 -0.1010 0.8990 51 1967 0.2394 1.2394 52 1968 0.1100 1.1100 53 1969 -0.0847 0.9153 54 1970 0.0399 1.0399 55 1971 0.1433 1.1433 56 1972 0.1894 1.1894 57 1973 -0.1479 0.8521 58 1974 -0.2654 0.7346 59 1975 0.3725 1.3725 1976 0.2367 1.2367 61 1977 -0.0739 0.9261 62 1978 0.0644 1.0644 63 1979 0.1835 1.1835 64 1980 0.3227 1.3227 65 1981 -0.0505 0.9495 1982 0.2148 1.2148 1983 0.2250 1.2250 68 1984 0.0615 1.0615 1985 0.3165 1.3165 1986 0.1860 1.1860 71 1987 0.0517 1.0517 72 1988 0.1661 1.1661 73 1989 0.3169 1.3169 74 1990 -0.0310 0.9690 1991 0.3047 1.3047 76 1992 0.0762 1.0762 1993 0.1008 1.1008 78 1994 0.0132 1.0132 1995 0.3758 1.3758 1996 0.2296 1.2296 81 1997 0.3336 1.3336 82 1998 0.2858 1.2858 A B C D E F G H 8 6 8 8 8 8 8 1998 0.2858 1.2858 1999 0.2104 1.2104 2000 -0.0910 0.9090 2001 -0.1189 0.8811 2002 -0.2210 0.7790 2003 0.2868 1.2868 2004 0.1088 1.1088 2005 0.0491 1.0491 2006 0.1580 1.1580 2007 0.0549 1.0549 2008 -0.3700 0.6300 2009 0.2646 1.2646 2010 0.1506 1.1506 2011 0.0211 1.0211 2012 0.1600 1.1600 2013 0.3239 1.3239 2014 0.1369 1.1369 100 Period Final value of initial investment Annualized return 101 1929-1948 102 1949-1968 103 1969-1988 104 1989 - 2008 105 106 107 Requirements 108 109 110 1. Start Excel - completed. 2. In cell D101, by using cell references and the function PRODUCT, calculate the final value of initial investment for years from 1929 to 1948 (1 pt.). 3. Similarly, calculate the final value of initial investment for each of the other 20-year periods in cells D102:D104 (1 pt.). 4. In cell E101, by using cell references and the function PRODUCT, calculate the annualized return for years from 1929 to 1948 (1 pt.). 111 112 5. Similarly, calculate the annualized return for each of the other 20-year periods in cells E102:E104 (1 pt.). 113 6. Save the workbook. Close the workbook and then exit Excel. Submit the workbook as directed.
Expert Answer:

Related Book For 

Posted Date:
Students also viewed these finance questions
-
Table 6E.3 shows the number of earthquakes per year of magnitude 7.0 and higher since 1900 (source: Earthquake Data Base System of the U.S. Geological Survey, National Earthquake Information Center,...
-
Table P-18 contains the number of severe earthquakes (those with a Richter scale magnitude of 7 and above) per year for the years 1900-1999. a. Use Minitab to smooth the earthquake data with moving...
-
Peabody Coal acquired the mineral rights to a tract of land containing coal deposits. Total costs of acquisition, exploration, development were $1,200,000 and an ARO of $300,000 was recorded. The...
-
Describe with examples the role of governments in promoting national interests pertaining to business activities.
-
Determine the kinds of intermolecular forces that are present in each element or compound. a. Kr b. NCl 3 c. SiH 4 d. HF
-
Two soccer players kick two identical balls at the same time. Player 1 sends his ball at an impressive \(90 \mathrm{~km} / \mathrm{hr}\) at an angle of \(30^{\circ}\) above the horizontal. Player 2...
-
By examining first digits, Company XXX suspects fraud. You are asked to review the sample of invoices shown on the previous page to see if they make sense. You are familiar with several fraud...
-
1 2 34 What is "SWOT analysis? How do you carry it for a technical educationalinstitute? What is corporate planning? Explain the process of corporate planning? Discuss the process of strategy...
-
. Use truth tables to verify these equivalences. (a) p^ T = p (b) p^F = F (c) pvp = p (d) pVF = p (e) pVT = T (f) p^p=p (g) pvq=qVp (h) p^q=q^p (i) (pvg) vr=pV (qVr) (i) (p^g) ^r=p^ (q^r)
-
Ventiora SpA has a disused warehouse it is holding till land prices increase before selling to potential buyers. In option terminology, what type of option(s) does the company have on the warehouse?
-
What are the two options that many businesses have? Why does a traditional NPV analysis tend to underestimate the value of an investment opportunity? Explain.
-
Provide an overview of the private equity market. Why would firms wish to go private once they have listed on a stock exchange? In April 2015, Rangers International Football Club plc delisted from...
-
Raggio SpA has 100,000 shares of equity outstanding. Each share is worth 90, so the companys market value of equity is 9,000,000. Suppose the firm issues 20,000 new shares at the following prices:...
-
What is a convertible bond? What are the key features of such a security?
-
Write a short note on European infrastructure (from ancient times to modern times)
-
The Pletcher Transportation Company uses a responsibility reporting system to measure the performance of its three investment centers: Planes, Taxis, and Limos. Segment performance is measured using...
-
The imposition of new trade tariffs has resulted in tensions between the United States and some of its major trading partners. Suppose you are a small business owner in the United States. a. How...
-
Suppose you identify 10 possible investments whose payoffs are completely independent of one another. All the investments have the same expected value and standard deviation. You have $1,000 to...
-
The rise in wealth inequality in the United States has reduced the capacity of much of the population to cope with transitory income shocks. How might you expect that to impact workers preferences...

Study smarter with the SolutionInn App