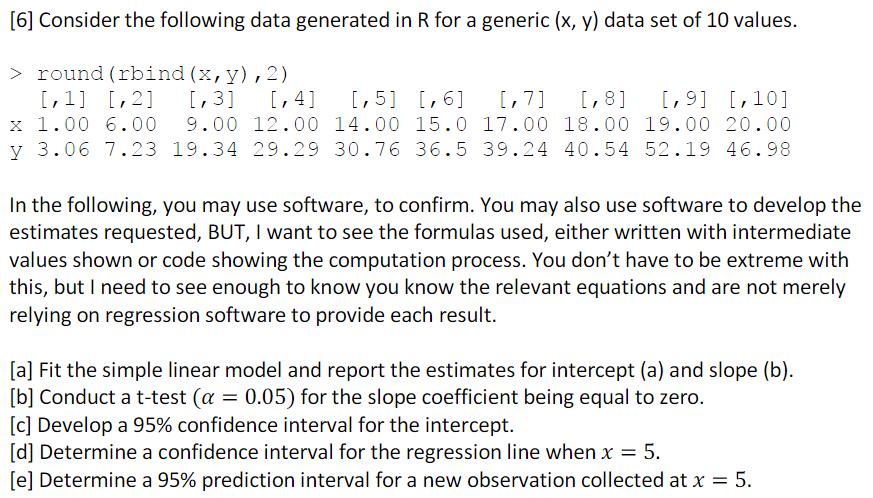
[6] Consider the following data generated in R for a generic (x, y) data set of...
Fantastic news! We've Found the answer you've been seeking!
Question:
Transcribed Image Text:
[6] Consider the following data generated in R for a generic (x, y) data set of 10 values. > round (rbind (x, y), 2) [1] [2] [3] [4] x 1.00 6.00 9.00 12.00 y 3.06 7.23 19.34 29.29 30.76 36.5 39.24 40.54 52.19 46.98 [5] [6] [7] [8] 14.00 15.0 17.00 18.00 [9] [10] 19.00 20.00 In the following, you may use software, to confirm. You may also use software to develop the estimates requested, BUT, I want to see the formulas used, either written with intermediate values shown or code showing the computation process. You don't have to be extreme with this, but I need to see enough to know you know the relevant equations and are not merely relying on regression software to provide each result. [a] Fit the simple linear model and report the estimates for intercept (a) and slope (b). [b] Conduct a t-test (a = 0.05) for the slope coefficient being equal to zero. [c] Develop a 95% confidence interval for the intercept. [d] Determine a confidence interval for the regression line when x = 5. [e] Determine a 95% prediction interval for a new observation collected at x = 5. [6] Consider the following data generated in R for a generic (x, y) data set of 10 values. > round (rbind (x, y), 2) [1] [2] [3] [4] x 1.00 6.00 9.00 12.00 y 3.06 7.23 19.34 29.29 30.76 36.5 39.24 40.54 52.19 46.98 [5] [6] [7] [8] 14.00 15.0 17.00 18.00 [9] [10] 19.00 20.00 In the following, you may use software, to confirm. You may also use software to develop the estimates requested, BUT, I want to see the formulas used, either written with intermediate values shown or code showing the computation process. You don't have to be extreme with this, but I need to see enough to know you know the relevant equations and are not merely relying on regression software to provide each result. [a] Fit the simple linear model and report the estimates for intercept (a) and slope (b). [b] Conduct a t-test (a = 0.05) for the slope coefficient being equal to zero. [c] Develop a 95% confidence interval for the intercept. [d] Determine a confidence interval for the regression line when x = 5. [e] Determine a 95% prediction interval for a new observation collected at x = 5.
Expert Answer:
Answer rating: 100% (QA)
Solution Griven Round 9 10 1 2 3 4 5 6 7 8 X 100 600 900 1200 1400 1500 1700 1800 ... View the full answer
Related Book For
Applied Regression Analysis and Other Multivariable Methods
ISBN: 978-1285051086
5th edition
Authors: David G. Kleinbaum, Lawrence L. Kupper, Azhar Nizam, Eli S. Rosenberg
Posted Date:
Students also viewed these mathematics questions
-
Consider the following data for three different companies: The patterns of cash flows for these firms differ. One firm is a growth firm that is expanding rapidly, another firm is in danger of...
-
Consider the following data regarding factory overhead: Using the above data, fill in the following blanks with the variance amounts. Use F for favorable or U for unfavorable for eachvariance. Total...
-
Consider the following data (in millions) from Midwest Financial, Inc., which has two main divisions: mortgage loans, and consumer loans: Required 1. Based on ROI, which division is more successful?...
-
Why must we recognize and address challenges caused by diversity and work to implement a more inclusive healthcare workforce?
-
Emergency calls to the 911 system of Durham, North Carolina, for the past 24 weeks are shown in the following table: a) Compute the exponentially smoothed forecast of calls for each week. Assume an...
-
Refer to the Churning Department information for Woodson Dairy in E5-31A. Requirements: 1. What journal entry(s) would have been made during the month to record manufacturing costs? (Use Wages...
-
A small machine tool of mass \(100 \mathrm{~kg}\) operates at \(600 \mathrm{rpm}\). Find the static deflection of an undamped isolator that provides 90 percent isolation.
-
Afton Co. Purchased $24,000 of 4%, 10-year Davis Country bonds on July 12, 2012, directly from the country at par value. The bonds pay semiannual interest on May 1 and November 1. On December 1,...
-
Create a use case diagram that demonstrates how the staff at Pet Vet will interact with an application to order medications to re-stock the clinic's inventory. Assume the staff uses a web browser to...
-
On January 1, 2020, Xiamen Company made amendments to its defined benefit pension plan that resulted in 62,800 yuan of past service cost. The plan has 5,130 active employees with an average expected...
-
Calculate percent of total revenue. Please show excel calculations. Common Size Statements of Cash Flow 12 Months Ended Consolidated Statements of Cash Flows Dec. 31, 2018 % of Total Revenue Dec. 31,...
-
Figure 7 shows a map of part of the Styx River catchment. The catchment has a paper pulp factory discharging polluted effluent into Lake A. As a consulting hydrogeologist you are commissioned to...
-
Given the Following information for a compound curve Leads with short curve 1 = 10558'12" TL 2,641.08 feet Ts=2,110.17 feet DL= 230'00" (chord definition) The length of the long curve, in feet, is:...
-
For example, decimal palindromic numbers that can be created from "8199" are: "1","8", "9", "99", "919" and "989". Among them, "989" has the largest value. Write a function: string solution (string...
-
Given the Mass Haul Diagram above and the following information: Excavation Cost: $4.25/cu. yd. Borrow Cost: $4.50/cu. yd. Overhaul Cost: $0.75/sta*cu. yd. Free Haul Limit: 500 ft. Compute the total...
-
The pandemic poses significant challenges to the planning function. The immediate impact is on supply chain disruptions, especially considering the international component of Smithfield's operations....
-
The following T-accounts show postings of selected transactions. Indicate the journal used in recording each of these postings a through e. Cash Accounts Receivable Inventory (d) 500 (e) 300 (b)...
-
In Problem 9, the first-order interactions between Z and the predictor variables X1, X3, and X4 were not included in the model selection process. Investigate whether this was appropriate, as follows...
-
Use the correlation matrix from Problem 1 to answer the following questions. a. Compute the semipartial rSBP(SMK|AGE). b. Compute the semipartial rSMK(SBP|AGE). c. Compare these correlations to the...
-
In an experiment to describe the toxic action of a certain chemical on silkworm larvae, the relationship of log 10 dose and log 10 larva weight to log 10 survival time was sought. The data, obtained...
-
Prove that van der Waals constants \((a, b)\) can be expressed in terms of critical temperature and pressure as follows: a = 27 R 2 T 2 c 64 P c b = R T c 8 P c a = 27 R 2 T c 2 64 P c b = R T c 8 P c
-
Show that where \[ \left(\frac{\partial U}{\partial V} ight)_{T}=\frac{T \beta}{\kappa}-P \] \(\beta=\) Coefficient of volume expansion \(\kappa=\) Isothermal compressibility.
-
Derive Maxwell's relations.
Study smarter with the SolutionInn App