7. Measures of relative standing (percentiles and quartiles), interquartile range A growth chart is a plot...
Fantastic news! We've Found the answer you've been seeking!
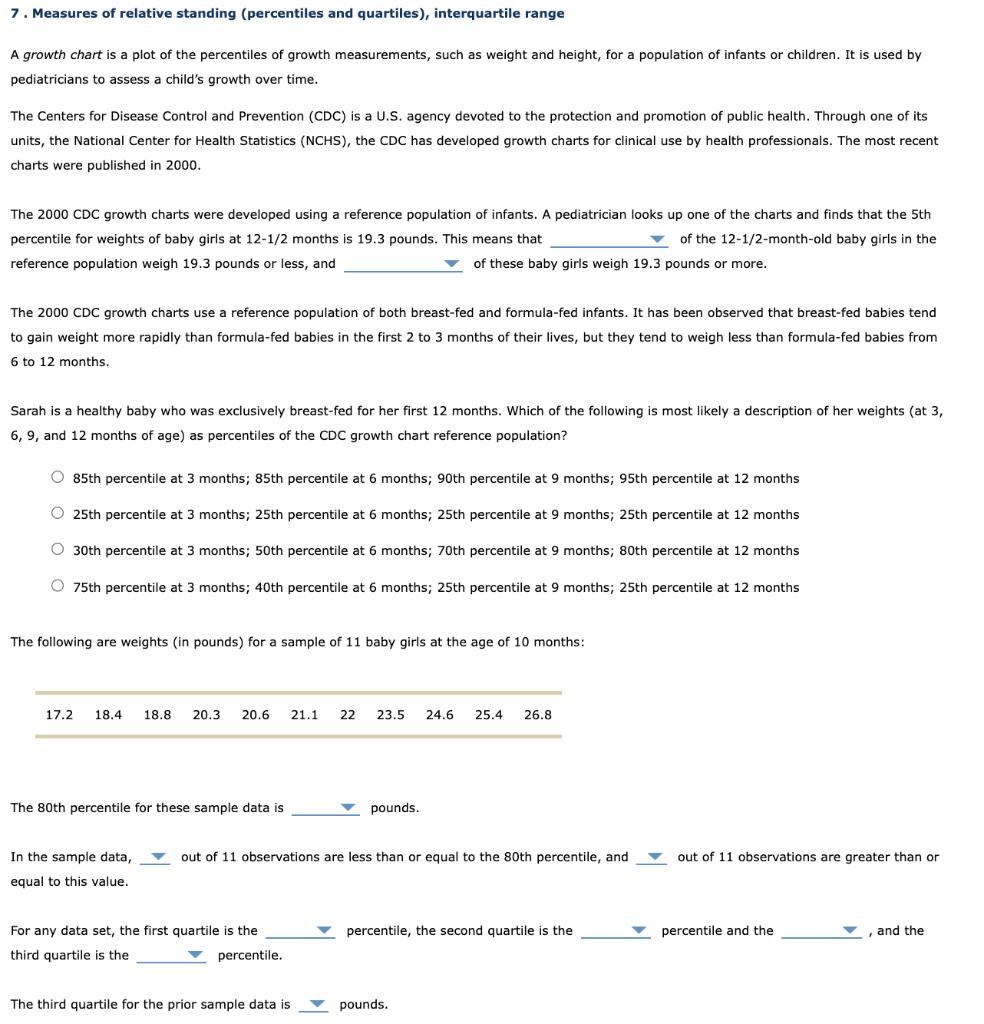
Question:
Transcribed Image Text:
7. Measures of relative standing (percentiles and quartiles), interquartile range A growth chart is a plot of the percentiles of growth measurements, such as weight and height, for a population of infants or children. It is used by pediatricians to assess a child's growth over time. The Centers for Disease Control and Prevention (CDC) is a U.S. agency devoted to the protection and promotion of public health. Through one of its units, the National Center for Health Statistics (NCHS), the CDC has developed growth charts for clinical use by health professionals. The most recent charts were published in 2000. The 2000 CDC growth charts were developed using a reference population of infants. A pediatrician looks up one of the charts and finds that the 5th percentile for weights of baby girls at 12-1/2 months is 19.3 pounds. This means that of the 12-1/2-month-old baby girls in the reference population weigh 19.3 pounds or less, and of these baby girls weigh 19.3 pounds or more. The 2000 CDC growth charts use a reference population of both breast-fed and formula-fed infants. It has been observed that breast-fed babies tend to gain weight more rapidly than formula-fed babies in the first 2 to 3 months of their lives, but they tend to weigh less than formula-fed babies from 6 to 12 months. Sarah is a healthy baby who was exclusively breast-fed for her first 12 months. Which of the following is most likely a description of her weights (at 3, 6, 9, and 12 months of age) as percentiles of the CDC growth chart reference population? 85th percentile at 3 months; 85th percentile at 6 months; 90th percentile at 9 months; 95th percentile at 12 months 25th percentile at 3 months; 25th percentile at 6 months; 25th percentile at 9 months; 25th percentile at 12 months 30th percentile at 3 months; 50th percentile at 6 months; 70th percentile at 9 months; 80th percentile at 12 months O 75th percentile at 3 months; 40th percentile at 6 months; 25th percentile at 9 months; 25th percentile at 12 months The following are weights (in pounds) for a sample of 11 baby girls at the age of 10 months: 17.2 18.4 18.8 20.3 20.6 21.1 22 23.5 24.6 25.4 26.8 The 80th percentile for these sample data is In the sample data, equal to this value. out of 11 observations are less than or equal to the 80th percentile, and For any data set, the first quartile is the third quartile is the ▾ percentile. pounds. The third quartile for the prior sample data is percentile, the second quartile is the pounds. out of 11 observations are greater than or percentile and the , and the 7. Measures of relative standing (percentiles and quartiles), interquartile range A growth chart is a plot of the percentiles of growth measurements, such as weight and height, for a population of infants or children. It is used by pediatricians to assess a child's growth over time. The Centers for Disease Control and Prevention (CDC) is a U.S. agency devoted to the protection and promotion of public health. Through one of its units, the National Center for Health Statistics (NCHS), the CDC has developed growth charts for clinical use by health professionals. The most recent charts were published in 2000. The 2000 CDC growth charts were developed using a reference population of infants. A pediatrician looks up one of the charts and finds that the 5th percentile for weights of baby girls at 12-1/2 months is 19.3 pounds. This means that of the 12-1/2-month-old baby girls in the reference population weigh 19.3 pounds or less, and of these baby girls weigh 19.3 pounds or more. The 2000 CDC growth charts use a reference population of both breast-fed and formula-fed infants. It has been observed that breast-fed babies tend to gain weight more rapidly than formula-fed babies in the first 2 to 3 months of their lives, but they tend to weigh less than formula-fed babies from 6 to 12 months. Sarah is a healthy baby who was exclusively breast-fed for her first 12 months. Which of the following is most likely a description of her weights (at 3, 6, 9, and 12 months of age) as percentiles of the CDC growth chart reference population? 85th percentile at 3 months; 85th percentile at 6 months; 90th percentile at 9 months; 95th percentile at 12 months 25th percentile at 3 months; 25th percentile at 6 months; 25th percentile at 9 months; 25th percentile at 12 months 30th percentile at 3 months; 50th percentile at 6 months; 70th percentile at 9 months; 80th percentile at 12 months O 75th percentile at 3 months; 40th percentile at 6 months; 25th percentile at 9 months; 25th percentile at 12 months The following are weights (in pounds) for a sample of 11 baby girls at the age of 10 months: 17.2 18.4 18.8 20.3 20.6 21.1 22 23.5 24.6 25.4 26.8 The 80th percentile for these sample data is In the sample data, equal to this value. out of 11 observations are less than or equal to the 80th percentile, and For any data set, the first quartile is the third quartile is the ▾ percentile. pounds. The third quartile for the prior sample data is percentile, the second quartile is the pounds. out of 11 observations are greater than or percentile and the , and the
Expert Answer:
Answer rating: 100% (QA)
7 Measures of relative standing percentiles and quartiles interquartile range The 80th percentile for the sample data given is 254 pounds This means t... View the full answer
Related Book For
Statistics The Exploration & Analysis of Data
ISBN: 978-1133164135
7th edition
Authors: Roxy Peck, Jay L. Devore
Posted Date:
Students also viewed these accounting questions
-
The U.S. Centers for Disease Control and Prevention (CDC) recommends people consume five servings of fruits and vegetables daily. A random sample of adults from various states was asked if they...
-
Centers for Disease Control and Prevention data from 2010 and projected to 2050 indicate that adult diabetes in the United States could dramatically increase. With x0 in 2000, the percent of U.S....
-
The following is a plot of the residuals against the fitted values for the hummingbird data of Exercise IV.10. (a) Which point in the residual plot corresponds to the circled point in the data...
-
Consider the following velocity distribution curves A and B. a. If the plots represent the velocity distribution of 1.0 L of He(g) at STP versus 1.0 L of Cl2(g) at STP, which plot corresponds to each...
-
Consider the following four force vectors: F150.0 new tons, due east F210.0 new tons, due east F340.0 new tons, due east F430.0 new tons, due east Which two vectors add together to give a resultant...
-
Suppose this study is a pilot study for a larger study. The investigators want to determine the sample size in the larger study so that (i) Power will be 90% (ii) A two-sided test is used with a =...
-
Whether hearsay evidence may be admissible under a hearsay exception?
-
Satu Company, a merchandiser, recently completed its 2015 operations. For the year, (1) all sales are credit sales, (2) all credits to Accounts Receivable reflect cash receipts from customers, (3)...
-
Discuss the characteristics of each global HRM staffing model. Conclude by stating which global staffing model you think might be most effective and why. Discuss with a specific country example how...
-
Multiple regression is used by accountants in cost analysis to shed light on the factors that cause costs to be incurred and the magnitudes of their effects. Sometimes, it is desirable to use...
-
Use the simplex method to find an improved solution for the linear programming problem represented by the following tableau. X1 $3 0 0 1 -1 b 11 27 90 X2 S1 S 1 1 0 1 1 0 1 2 5 0 0 -4 -6 0 0 The...
-
Discuss the importance of the measurement-enhancement loop in the value creation model.
-
Describe the major components of the C-MER value creation model.
-
Why is an understanding of business processes important? Describe the advantages of business processes in general.
-
Select the best answer for each of the following and explain the reason for your selection. a. Which of the following procedures is least likely to be completed before the balance sheet date? (1)...
-
Differentiate between profit maximization and value maximization.
-
ASSESSMENT 2 Individual Business Case 3rdOct, 24:00 PM LMS Submission Link 30% of final marks Excel Spreadsheet plus MS word document. The excel spreadsheet should contain your financial statement...
-
If M = 7, s = 2, and X = 9.5, what is z?
-
In a study of the effect of college student employment on academic performance, the following summary statistics for GPA were reported for a sample of students who worked and for a sample of students...
-
The paper Modeling and Measurements of Bus Service Reliability (Transportation Research [1978]: 253 256) studied various aspects of bus service and presented data on travel times (in minutes) from...
-
The paper Deception and Design: The Impact of Communication Technology on Lying Behavior (Computer-Human Interaction [2009]: 130136) describes an investigation into whether lying is less common in...
-
Figure 2.82 shows a metal block supported on two identical cylindrical rollers rotating in opposite directions at the same angular speed. When the center of gravity of the block is initially...
-
If two identical springs of stiffness \(k\) each are attached to the metal block of Problem 2.41 as shown in Fig. 2.83, determine the coefficient of friction between the block and the rollers. Data...
-
Draw the free-body diagram and derive the equation of motion using Newton's second law of motion for each of the systems shown in Figs. 2.85. 4r k 00000 -Pulley, mass moment of incrtia Jo m 1444 x(t)...
Study smarter with the SolutionInn App