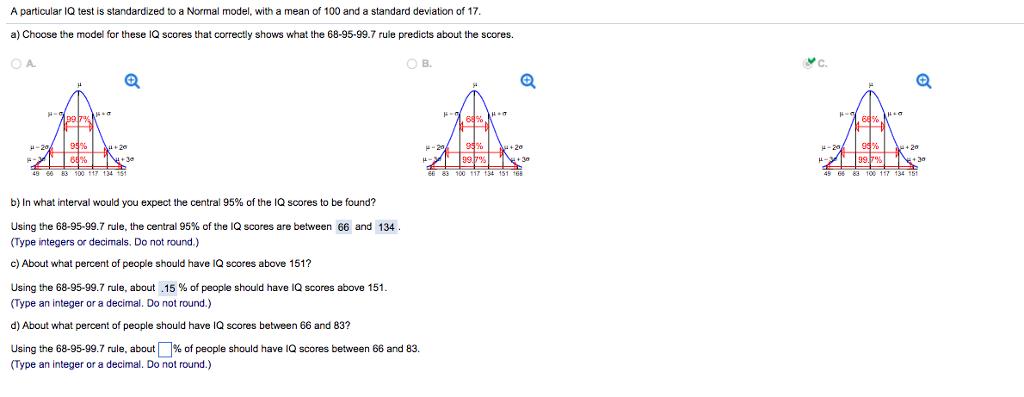
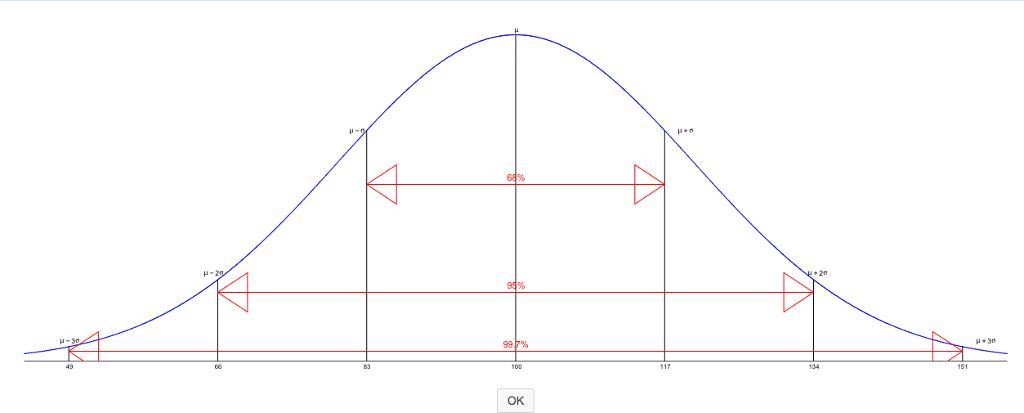
A particular IQ test is standardized to a Normal model, with a mean of 100 and...
Fantastic news! We've Found the answer you've been seeking!
Question:
Transcribed Image Text:
A particular IQ test is standardized to a Normal model, with a mean of 100 and a standard deviation of 17. a) Choose the model for these IQ scores that correctly shows what the 68-95-99.7 rule predicts about the scores. O A O B. Q +20 + 20 +20 99% 7 151 TRA 49 66 83 100 117 134 15 b) In what interval would you expect the central 95% of the IQ scores to be found? Using the 68-95-99.7 rule, the central 95% of the IQ scores are between 66 and 134. (Type integers or decimals. Do not round.) c) About what percent of people should have IQ scores above 151? Using the 68-95-99.7 rule, about .15 % of people should have 1Q scores above 151. (Type an integer or a decimal. Do not round.) d) About what percent of people should have IQ scores between 66 and 83? Using the 68-95-99.7 rule, about % of people should have IQ scores between 66 and 83. (Type an integer or a decimal. Do not round.) 64% ** 20 9% H 30 161 OK A particular IQ test is standardized to a Normal model, with a mean of 100 and a standard deviation of 17. a) Choose the model for these IQ scores that correctly shows what the 68-95-99.7 rule predicts about the scores. O A O B. Q +20 + 20 +20 99% 7 151 TRA 49 66 83 100 117 134 15 b) In what interval would you expect the central 95% of the IQ scores to be found? Using the 68-95-99.7 rule, the central 95% of the IQ scores are between 66 and 134. (Type integers or decimals. Do not round.) c) About what percent of people should have IQ scores above 151? Using the 68-95-99.7 rule, about .15 % of people should have 1Q scores above 151. (Type an integer or a decimal. Do not round.) d) About what percent of people should have IQ scores between 66 and 83? Using the 68-95-99.7 rule, about % of people should have IQ scores between 66 and 83. (Type an integer or a decimal. Do not round.) 64% ** 20 9% H 30 161 OK A particular IQ test is standardized to a Normal model, with a mean of 100 and a standard deviation of 17. a) Choose the model for these IQ scores that correctly shows what the 68-95-99.7 rule predicts about the scores. O A O B. Q +20 + 20 +20 99% 7 151 TRA 49 66 83 100 117 134 15 b) In what interval would you expect the central 95% of the IQ scores to be found? Using the 68-95-99.7 rule, the central 95% of the IQ scores are between 66 and 134. (Type integers or decimals. Do not round.) c) About what percent of people should have IQ scores above 151? Using the 68-95-99.7 rule, about .15 % of people should have 1Q scores above 151. (Type an integer or a decimal. Do not round.) d) About what percent of people should have IQ scores between 66 and 83? Using the 68-95-99.7 rule, about % of people should have IQ scores between 66 and 83. (Type an integer or a decimal. Do not round.) 64% ** 20 9% H 30 161 OK A particular IQ test is standardized to a Normal model, with a mean of 100 and a standard deviation of 17. a) Choose the model for these IQ scores that correctly shows what the 68-95-99.7 rule predicts about the scores. O A O B. Q +20 + 20 +20 99% 7 151 TRA 49 66 83 100 117 134 15 b) In what interval would you expect the central 95% of the IQ scores to be found? Using the 68-95-99.7 rule, the central 95% of the IQ scores are between 66 and 134. (Type integers or decimals. Do not round.) c) About what percent of people should have IQ scores above 151? Using the 68-95-99.7 rule, about .15 % of people should have 1Q scores above 151. (Type an integer or a decimal. Do not round.) d) About what percent of people should have IQ scores between 66 and 83? Using the 68-95-99.7 rule, about % of people should have IQ scores between 66 and 83. (Type an integer or a decimal. Do not round.) 64% ** 20 9% H 30 161 OK A particular IQ test is standardized to a Normal model, with a mean of 100 and a standard deviation of 17. a) Choose the model for these IQ scores that correctly shows what the 68-95-99.7 rule predicts about the scores. O A O B. Q +20 + 20 +20 99% 7 151 TRA 49 66 83 100 117 134 15 b) In what interval would you expect the central 95% of the IQ scores to be found? Using the 68-95-99.7 rule, the central 95% of the IQ scores are between 66 and 134. (Type integers or decimals. Do not round.) c) About what percent of people should have IQ scores above 151? Using the 68-95-99.7 rule, about .15 % of people should have 1Q scores above 151. (Type an integer or a decimal. Do not round.) d) About what percent of people should have IQ scores between 66 and 83? Using the 68-95-99.7 rule, about % of people should have IQ scores between 66 and 83. (Type an integer or a decimal. Do not round.) 64% ** 20 9% H 30 161 OK A particular IQ test is standardized to a Normal model, with a mean of 100 and a standard deviation of 17. a) Choose the model for these IQ scores that correctly shows what the 68-95-99.7 rule predicts about the scores. O A O B. Q +20 + 20 +20 99% 7 151 TRA 49 66 83 100 117 134 15 b) In what interval would you expect the central 95% of the IQ scores to be found? Using the 68-95-99.7 rule, the central 95% of the IQ scores are between 66 and 134. (Type integers or decimals. Do not round.) c) About what percent of people should have IQ scores above 151? Using the 68-95-99.7 rule, about .15 % of people should have 1Q scores above 151. (Type an integer or a decimal. Do not round.) d) About what percent of people should have IQ scores between 66 and 83? Using the 68-95-99.7 rule, about % of people should have IQ scores between 66 and 83. (Type an integer or a decimal. Do not round.) 64% ** 20 9% H 30 161 OK
Expert Answer:
Answer rating: 100% (QA)
Solution Mean 100 sd 17 As per Empirical rule Approx 6... View the full answer
Related Book For
Stats Data and Models
ISBN: 978-0321986498
4th edition
Authors: Richard D. De Veaux, Paul D. Velleman, David E. Bock
Posted Date:
Students also viewed these accounting questions
-
IQ scores are normally distributed with a mean of 100 and a standard deviation of 16. Assume that many samples of size n are taken from a large population of people and the mean IQ score is computed...
-
IQ scores are normally distributed with a mean of 100 and a standard deviation of 15. Mensa is an organization for people with high IQs, and eligibility requires an IQ above 131.5. a. If someone is...
-
IQ scores are normally distributed with a mean of 100 and a standard deviation of 15. If we define a genius to be someone in the top 1% of IQ scores, find the score separating geniuses from the rest...
-
Which of the following is not true regarding a promissory note? a. Promissory notes may not be transferred to another party by endorsement. b. Promissory notes may be sold to another party. c....
-
Wildlife populations are monitored with aerial photographs.The number of animals and their locations relative to areas inhabited by the human population are useful information. Sometimes it is...
-
A 35-g glass thermometer reads 21.6oC before it is places in 135mL of water. When the water and thermometer come to equilibrium, the thermometer reads 39.2oC. What was the original temperature of the...
-
Compute the expected frequencies. Exercises 49 refer to the following data: Electric motors are assembled on four different production lines. Random samples of motors are taken from each line and...
-
The assets of Fonzarelli Corporation are presented on the next page (000s omitted).InstructionsIndicate the deficiencies, if any, in the foregoing presentation of Fonzarelli Corporation??sassets....
-
iv. Provide a brief explanation to a client on the importance of the values of market risk premium, CAPM and unlevered beta when making investment decisions.
-
Consider the graph with 8 nodes A1, A2, A3, A4, H, T, F1, F2. Ai is connected to Ai+1 for all i, each Ai is connected to H, H is connected to T, and T is connected to each Fi. Find a 3-coloring of...
-
Define atomic number, atomic mass, atomic weight, isotope and radioisotope in detail with examples
-
According to Percival and Lee (2022), what are the key barriers and catalysts to collective mobilization in the creative industries? Name each barrier and catalysator and explain how they hinder or...
-
Consider the two investments shown in the table. Find the present value of each at Year 0 assuming an interest rate of 5%. What is the percentage difference in the present values (with Investment 1...
-
The purpose of this task is to provide you the opportunity to apply theoretical concepts covered in topics from: Part 1 of Communication for Business and the Professions: Strategies and Skills (Dwyer...
-
In Jan 2019, Thomas attended a Computer Assembly and repairs training program in Melbourne. The training ran for 5 days and his employer paid for the flights, accommodation, training fee and provided...
-
Assume that you are one of investment analysts working with Do-It. Your investment manager asked you to prepare an investment plan. All RM1,000,000 that is available must be invested. Your investment...
-
You want to retire in 25 years. You currently have $200,000 saved and you believe you need $1,200,000 at retirement. Wha annual interest rate will you need to earn to meet your goal? %
-
During 2012, Cheng Book Store paid $483,000 for land and built a store in Georgetown. Prior to construction, the city of Georgetown charged Cheng $1,300 for a building permit, which Cheng paid. Cheng...
-
In Exercise 50, Chapter 4, we looked at data from an experiment to determine whether visual information about an image helped "see" the image in 3D. 2-Sample t-interval for (1 - (2 Conf level = 90%...
-
The National Hurricane Center provides data that list the numbers of large (category 3, 4, or 5) hurricanes that have struck the United States, by decade since 1851 (www.nhc.noaa.gov/dcmi.shtml). The...
-
Consider again the auto repair rates described in Exercise 27. If you own two cars, what is the probability that a) Neither will need repair? b) Both will need repair? c) At least one car will need...
-
A plot that represents how much of something there is may be misleading if the baseline is not at ______________________. In Exercises 3 and 4, fill in each blank with the appropriate word or phrase.
-
The population of country A is twice as large as the population of country B. True or false: If images are used to represent the populations, both the height and width of the image for country A...
-
If the baseline of a bar graph or time-series plot is not at zero, then the differences may appear to be __________________ than they actually are.
Study smarter with the SolutionInn App