

Accounting 1C Long Term Project- Master Budget You need to prepare a Master Budget for the...
Fantastic news! We've Found the answer you've been seeking!
Question:
Transcribed Image Text:
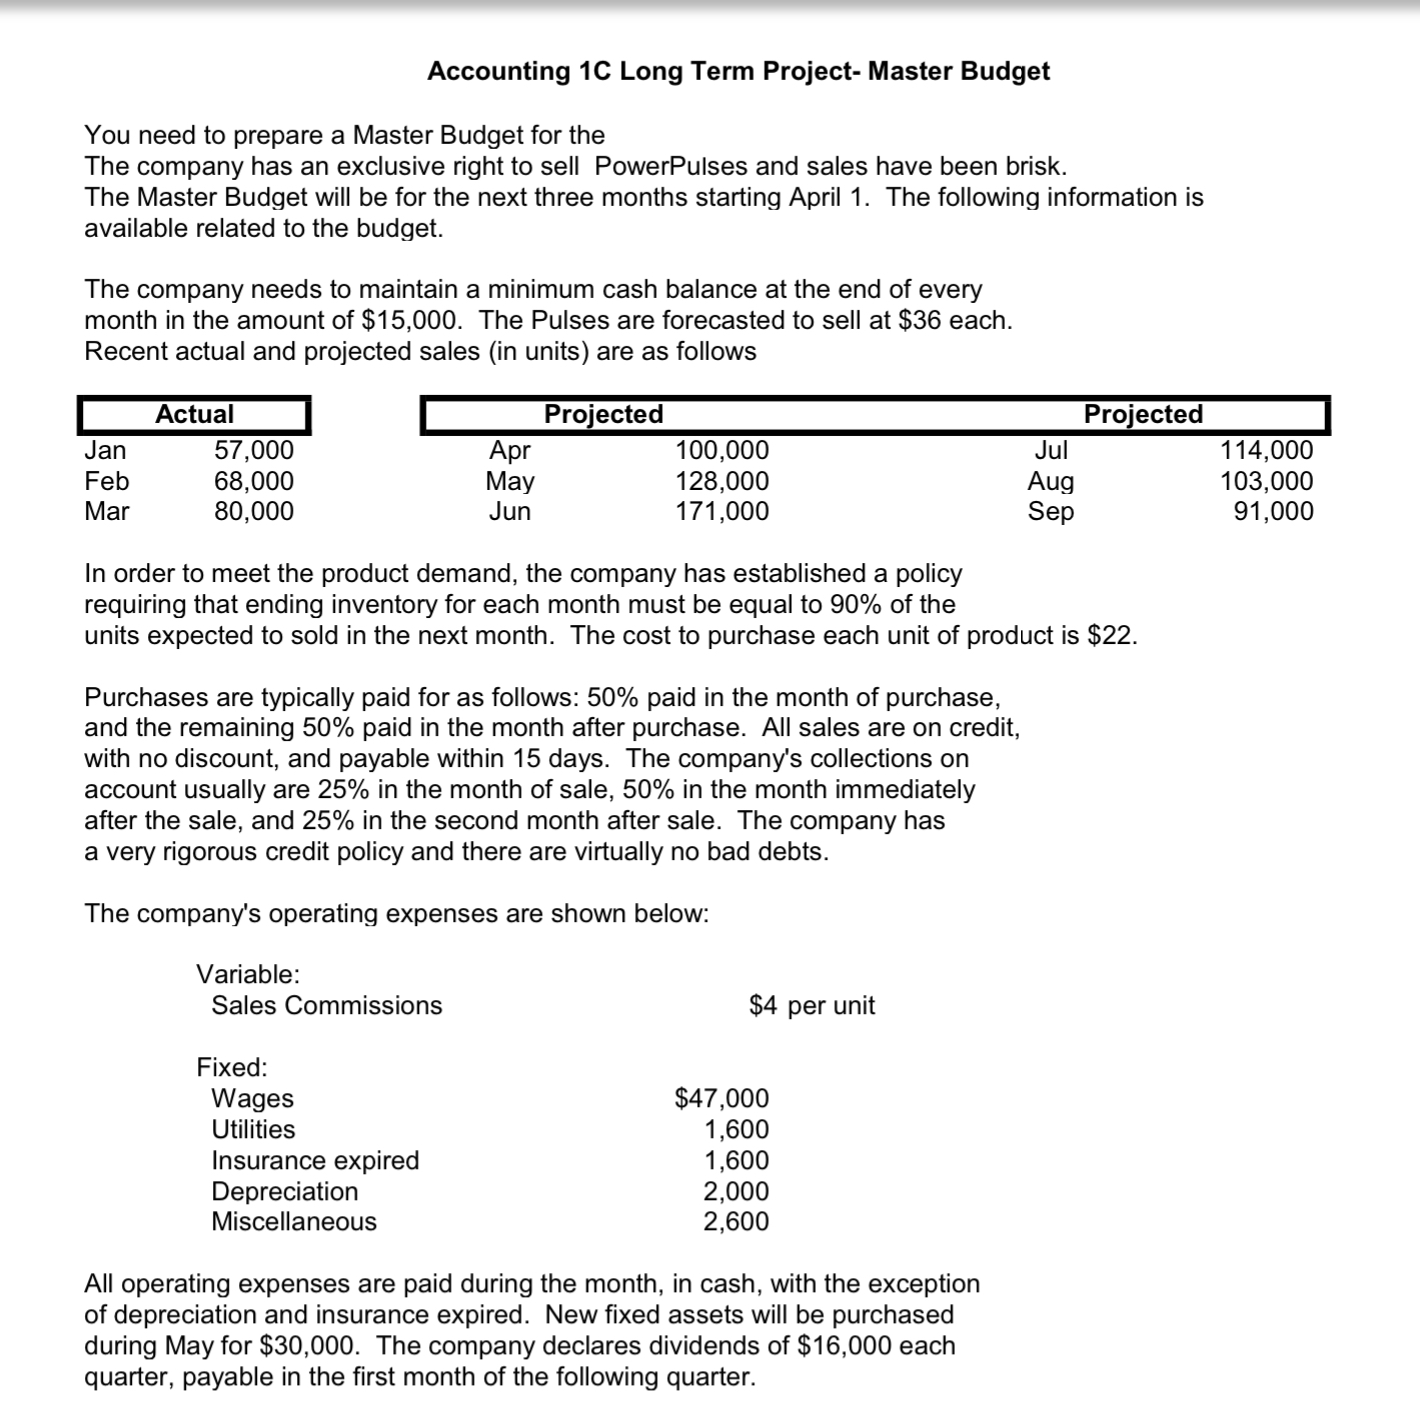
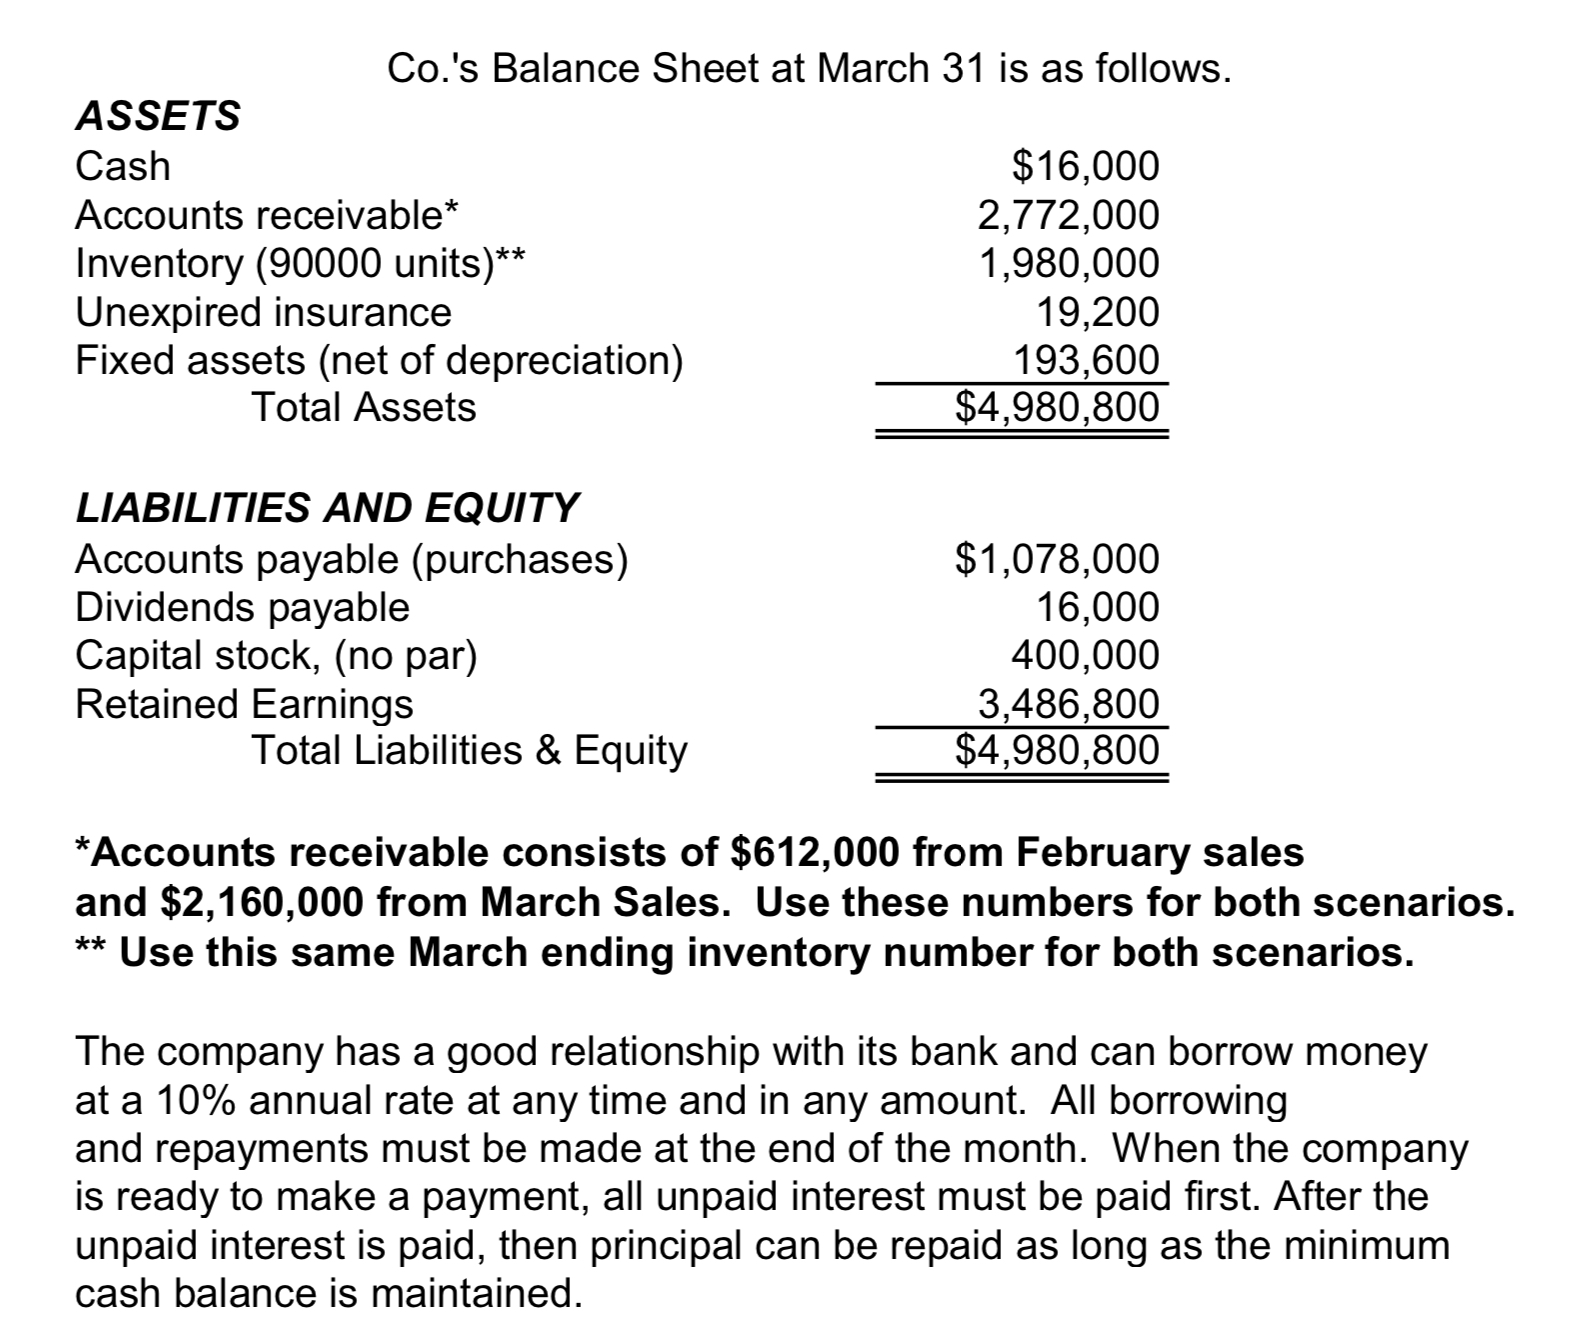
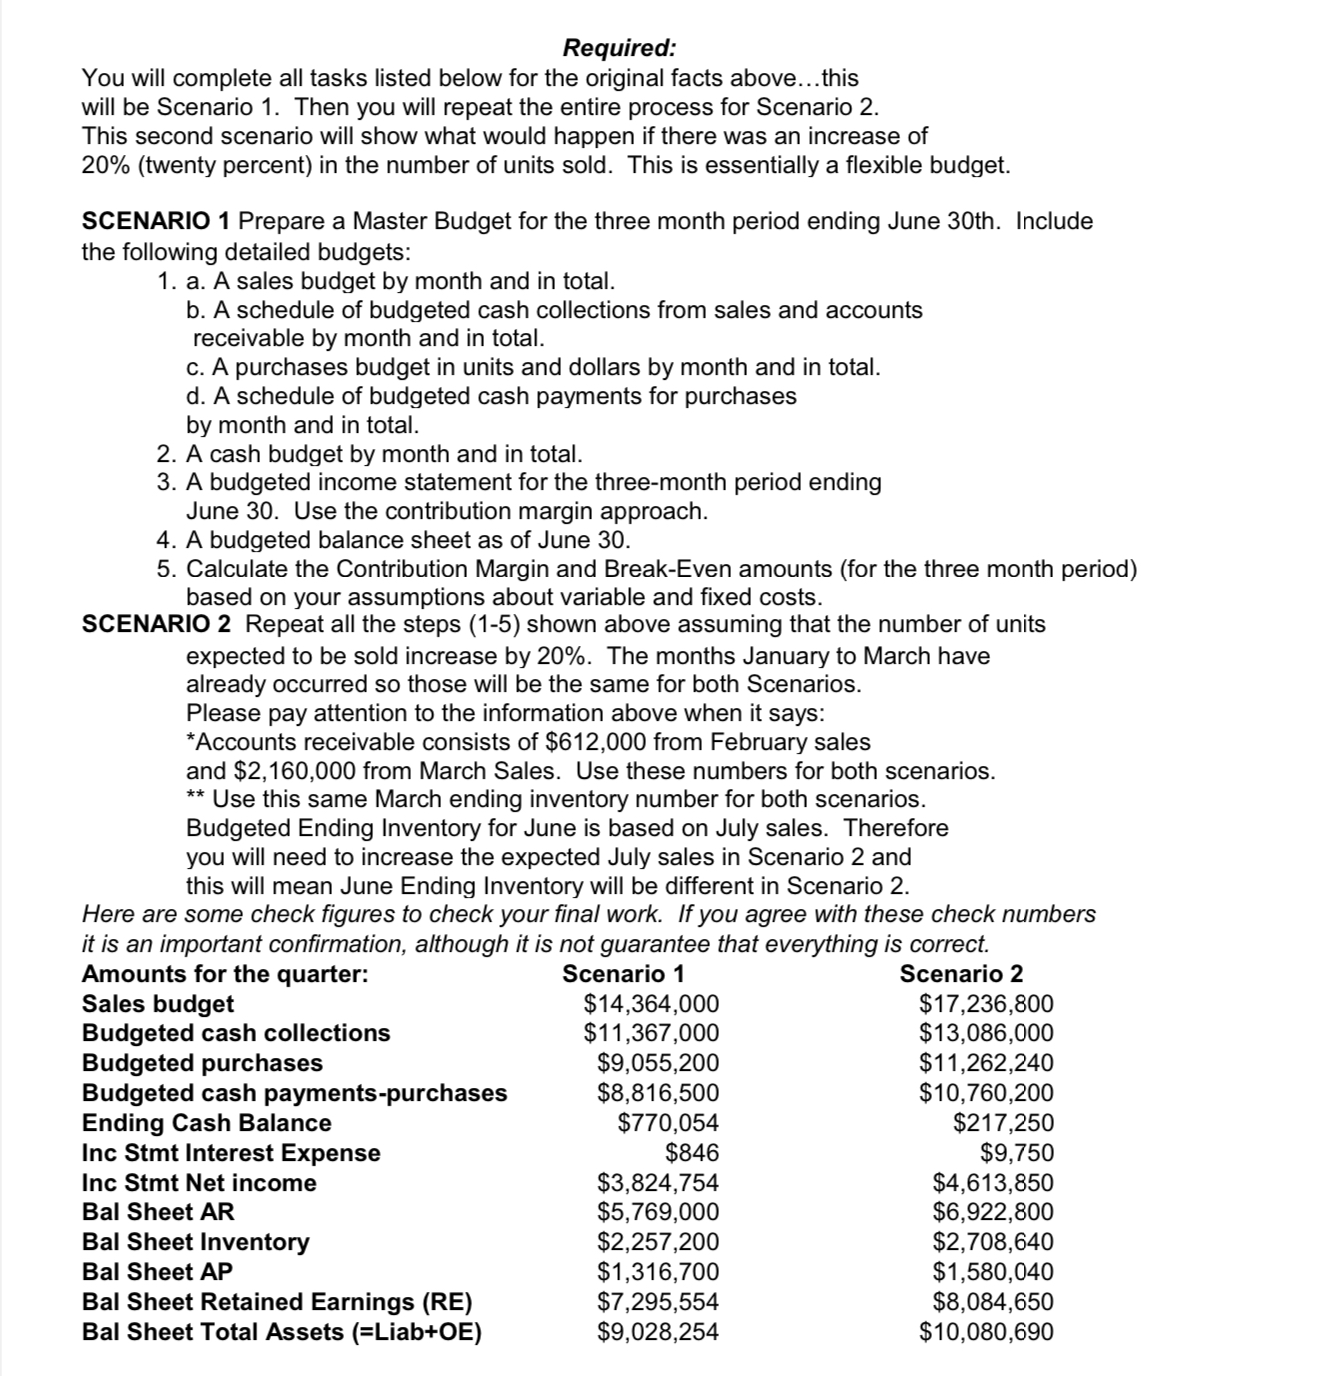
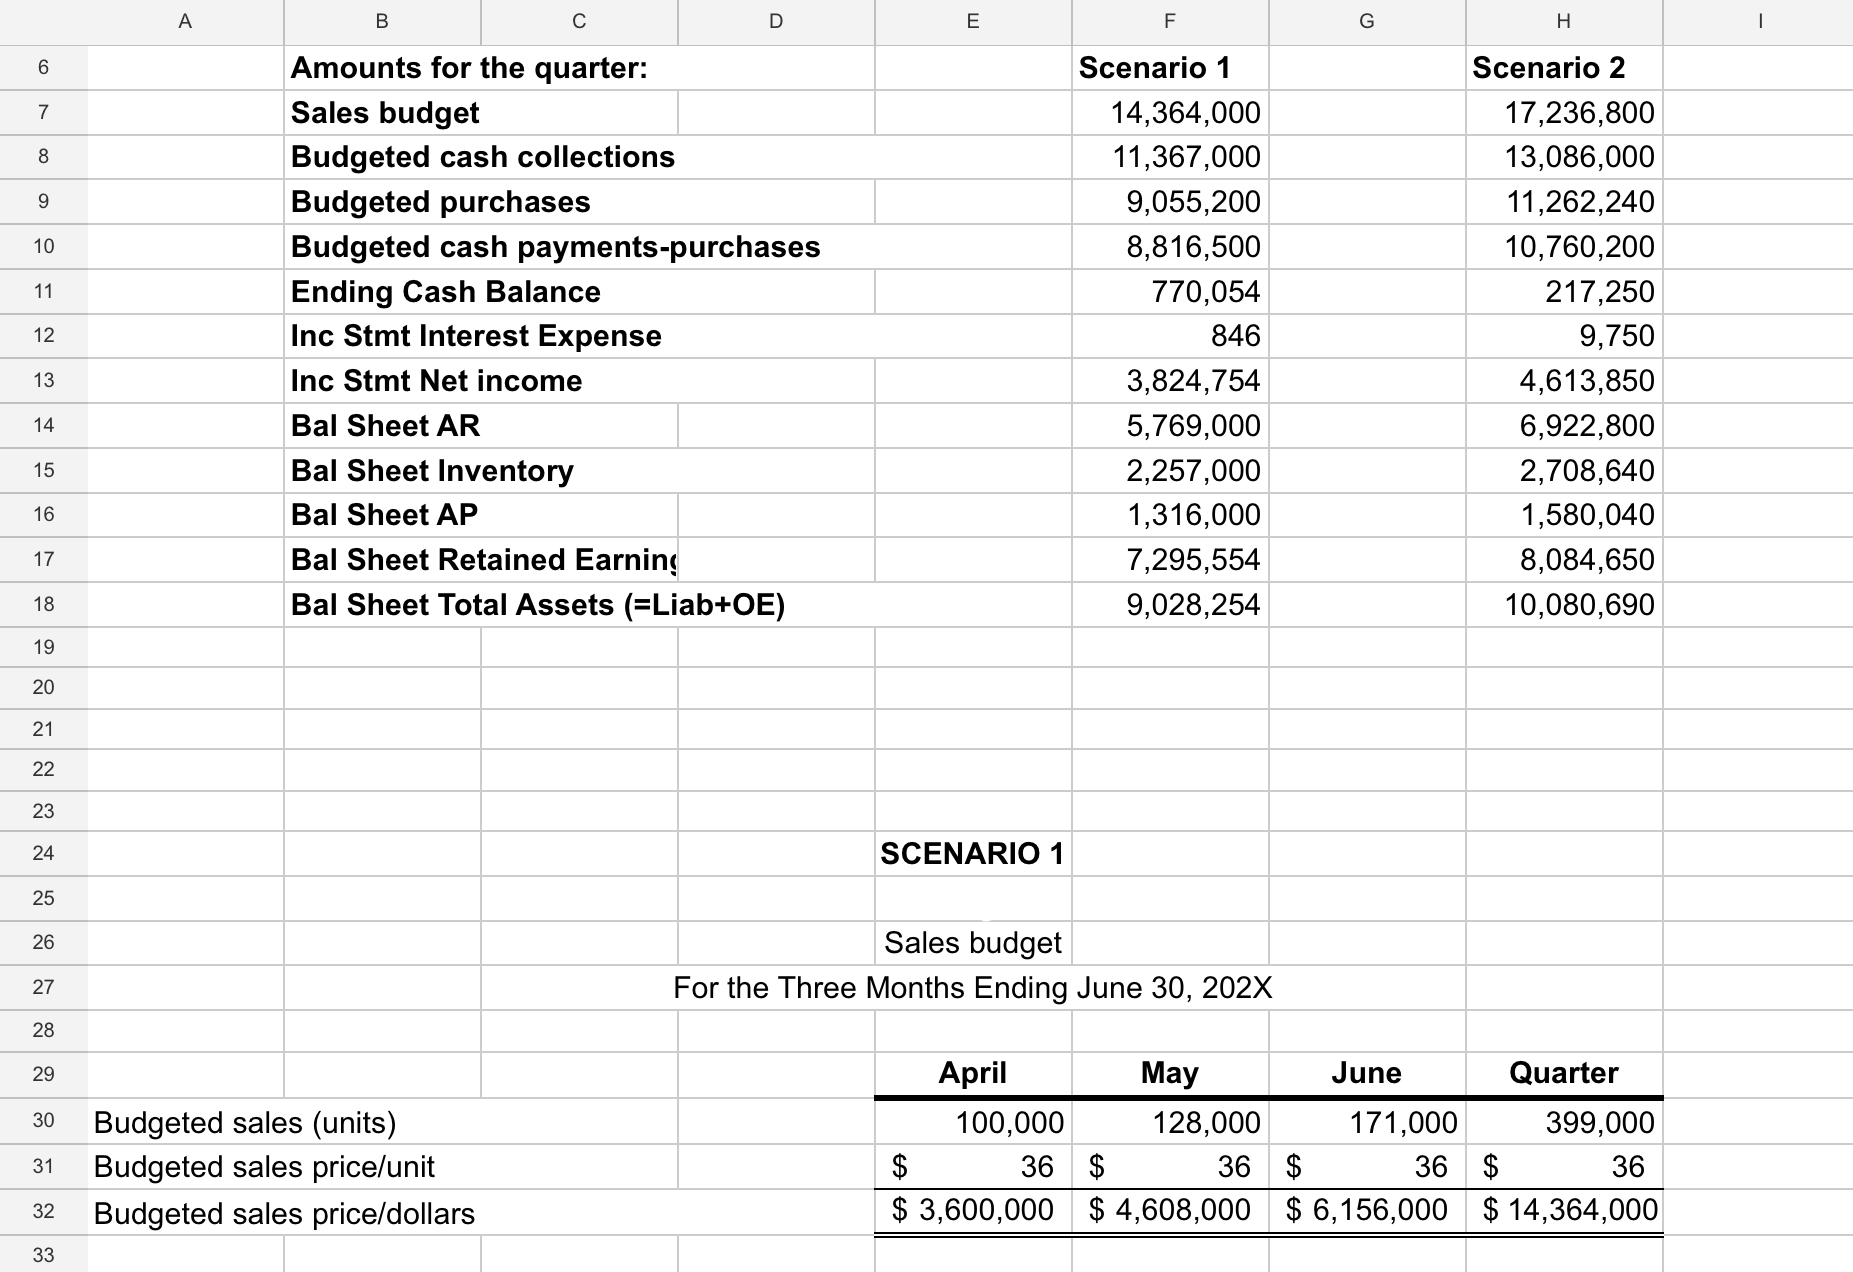
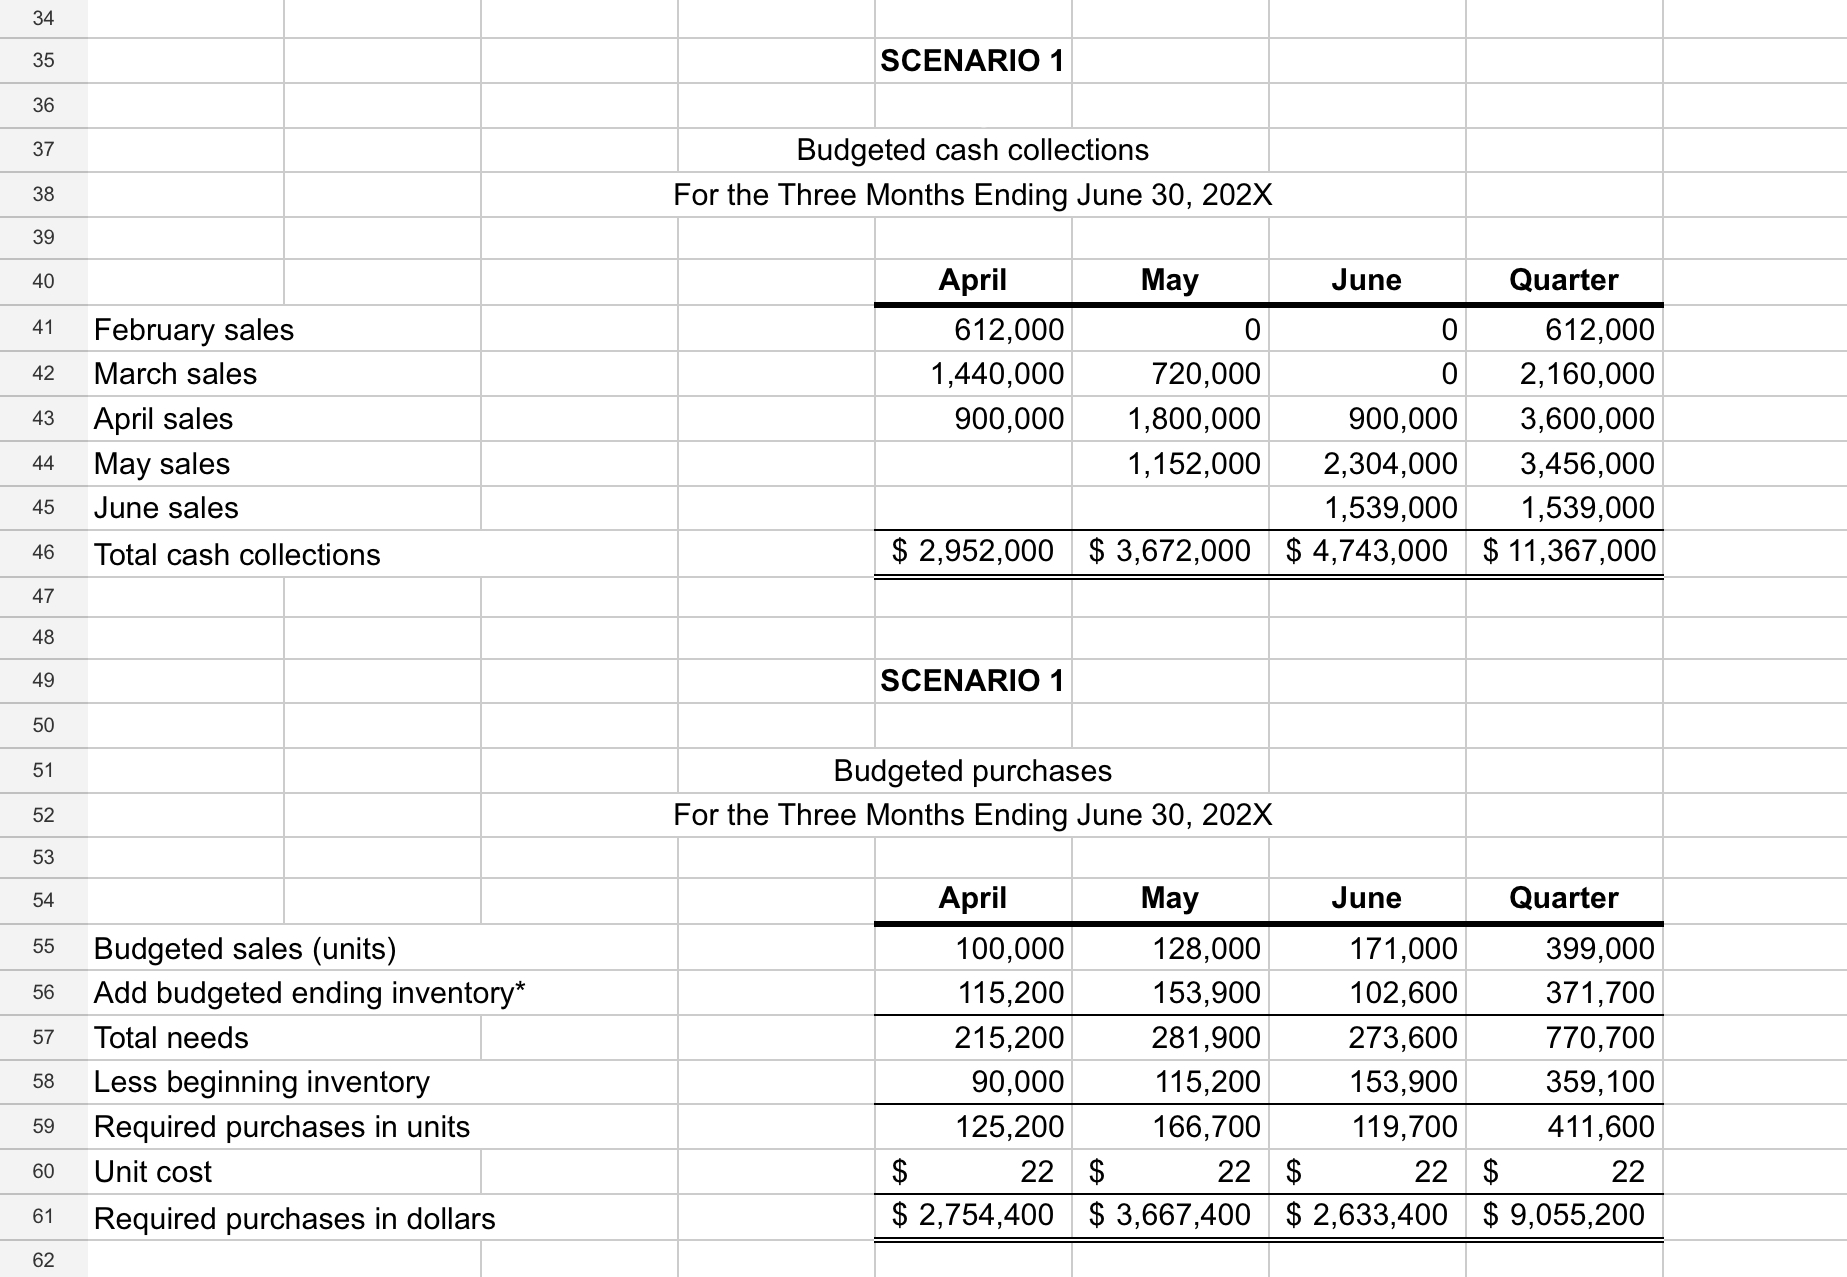
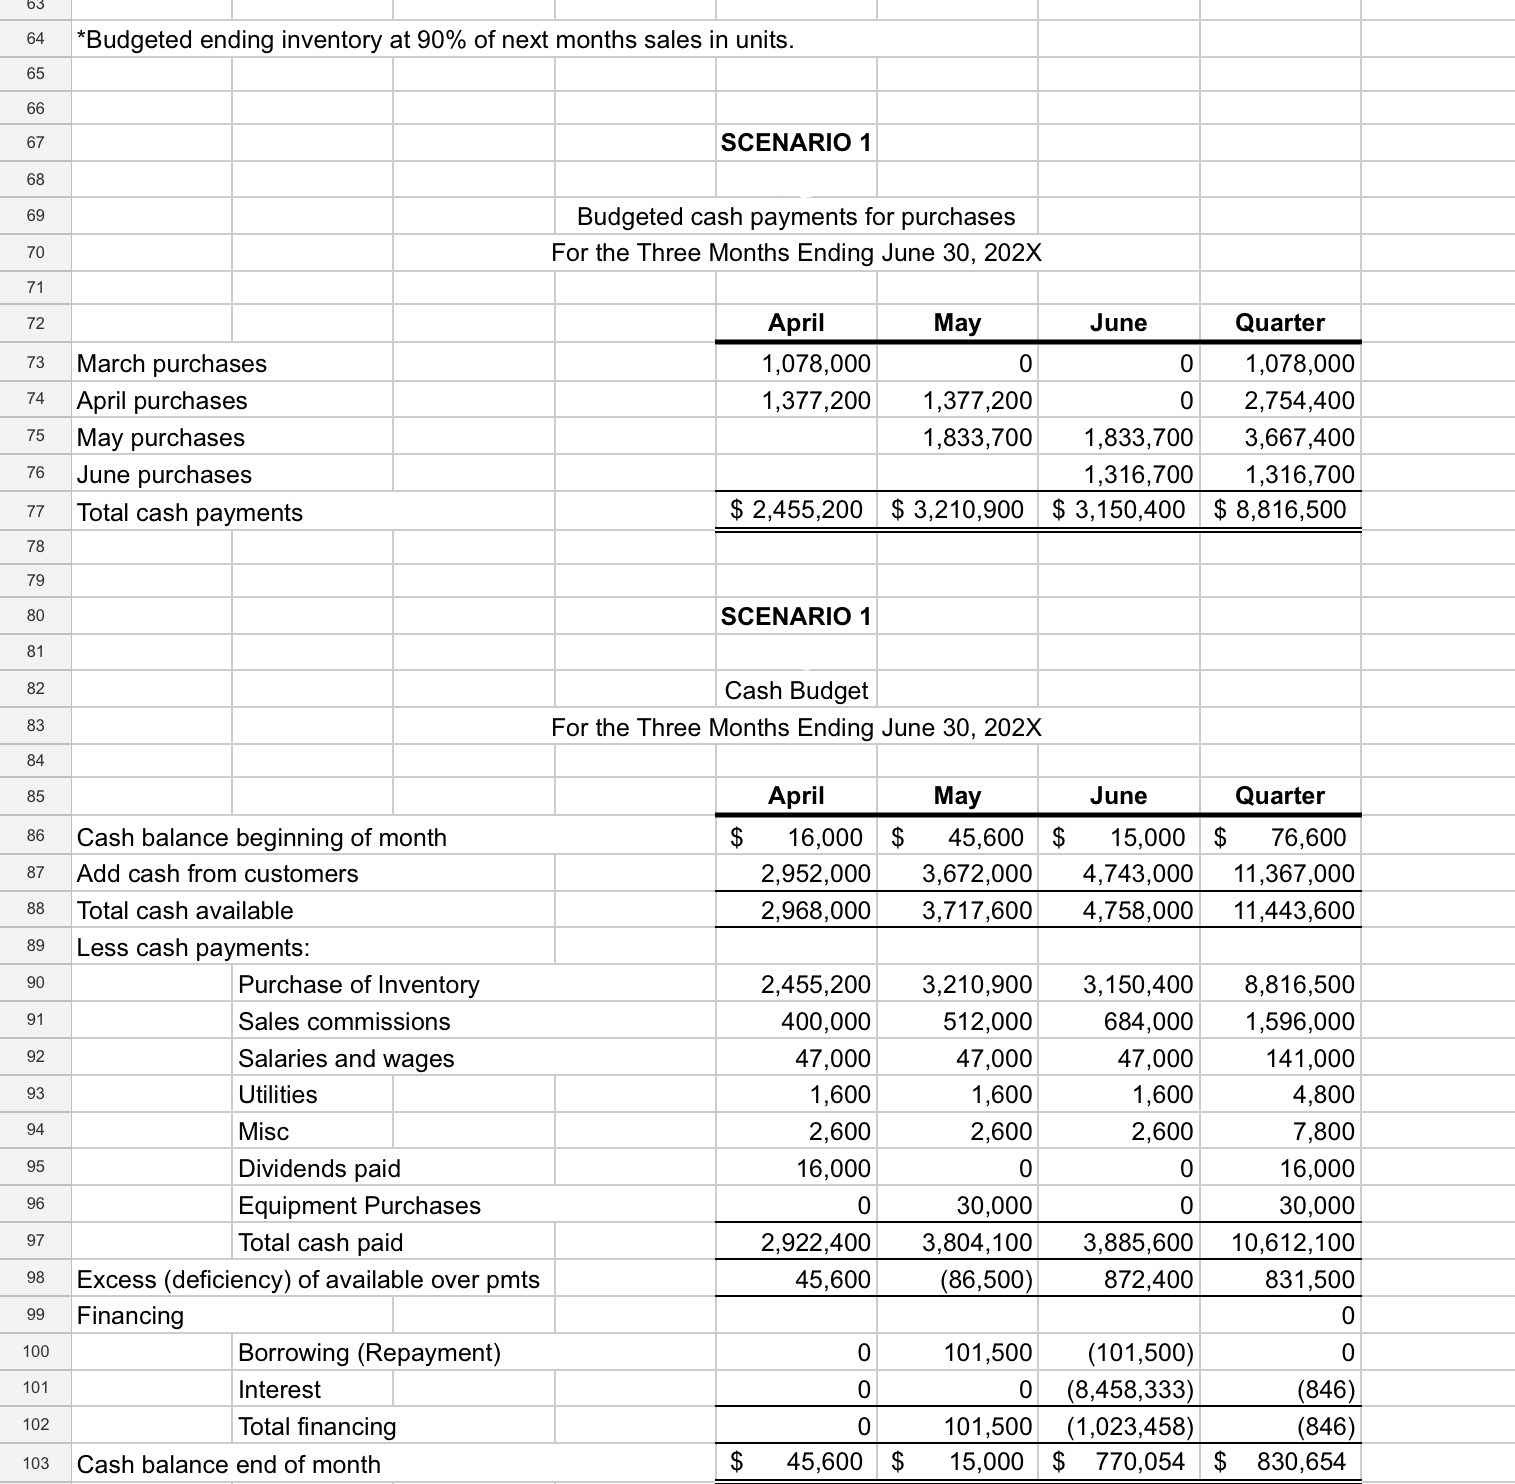
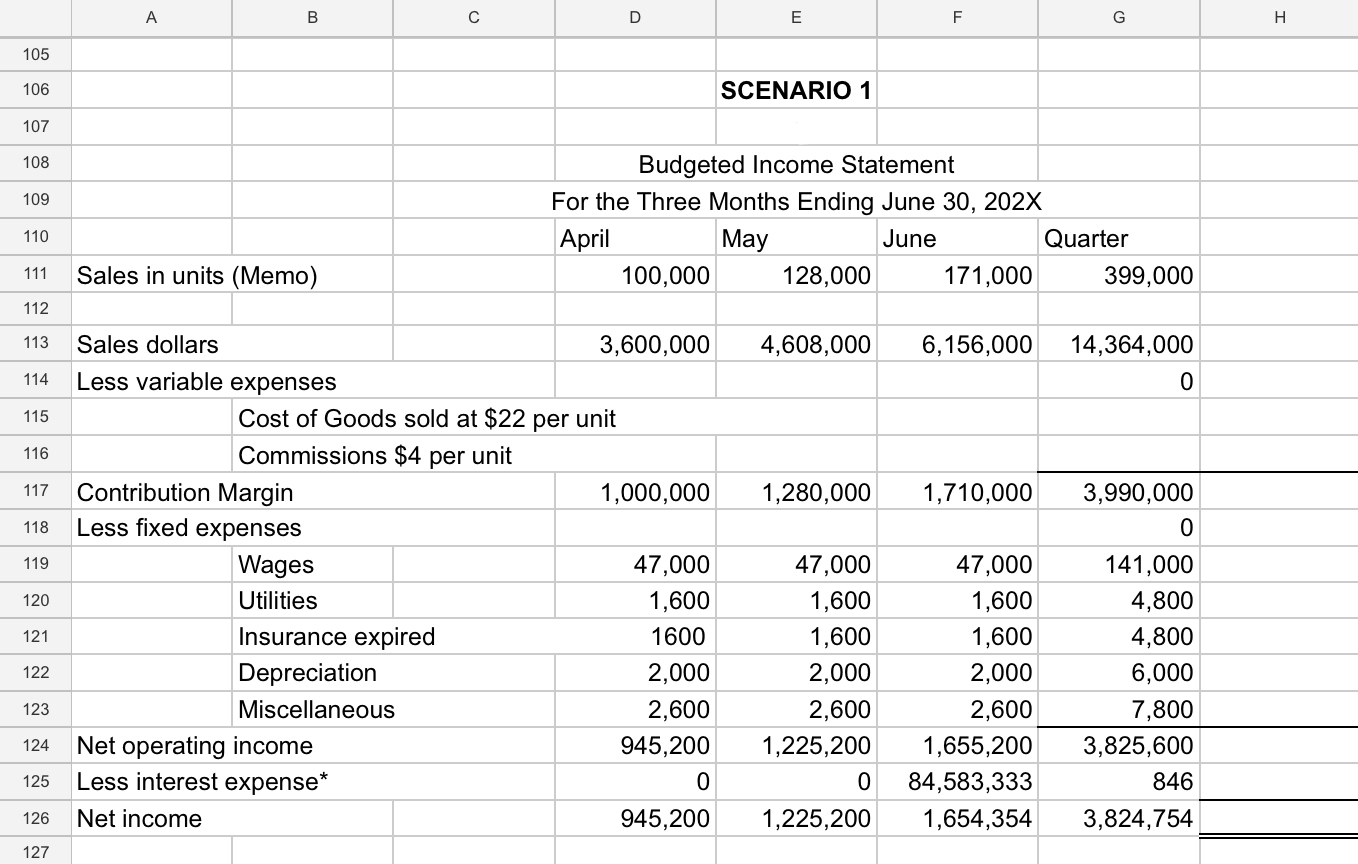
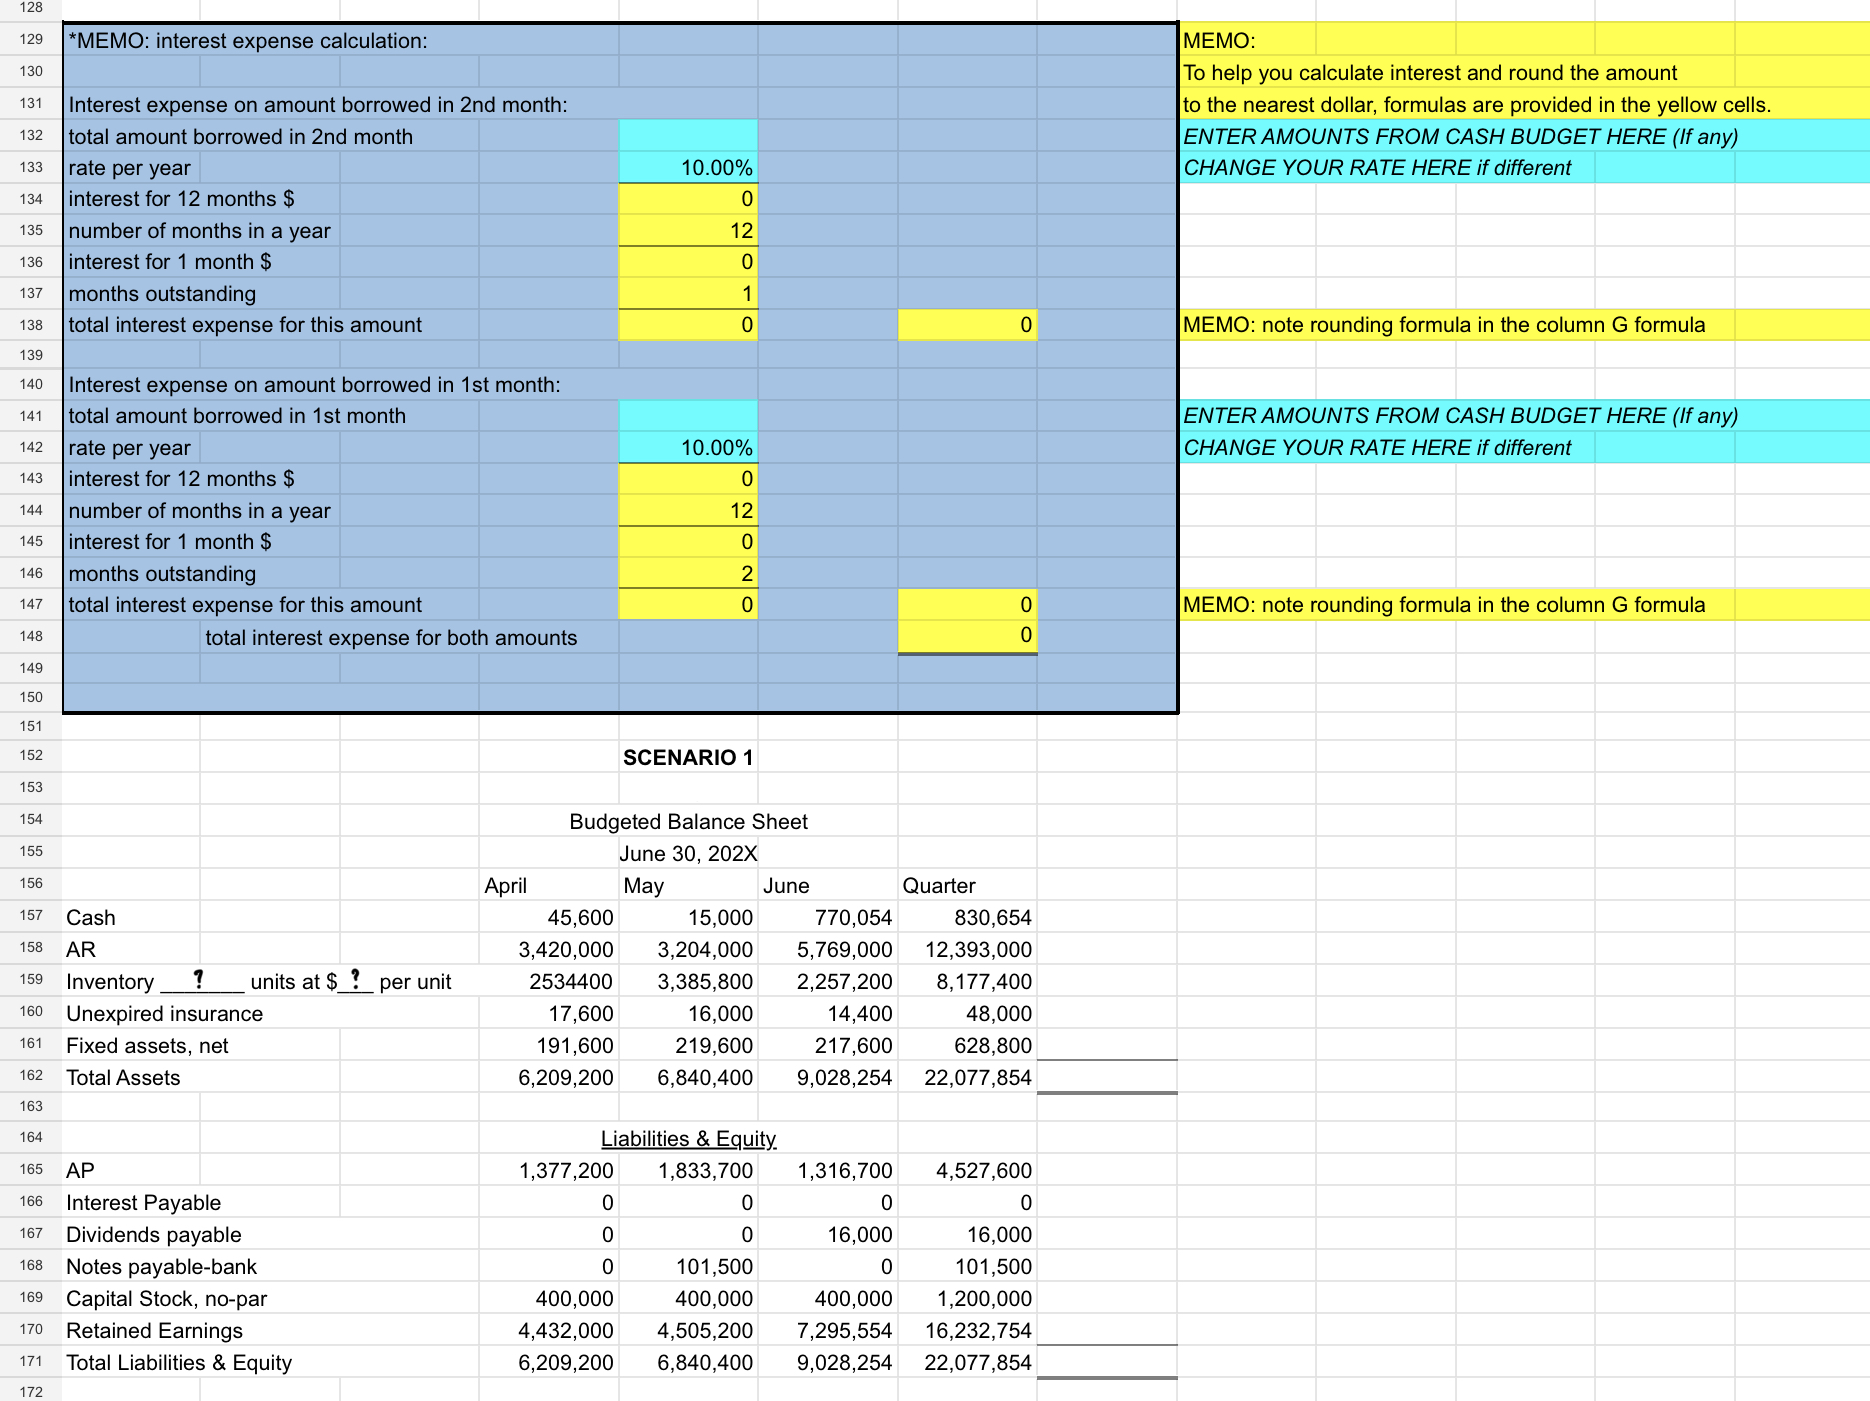
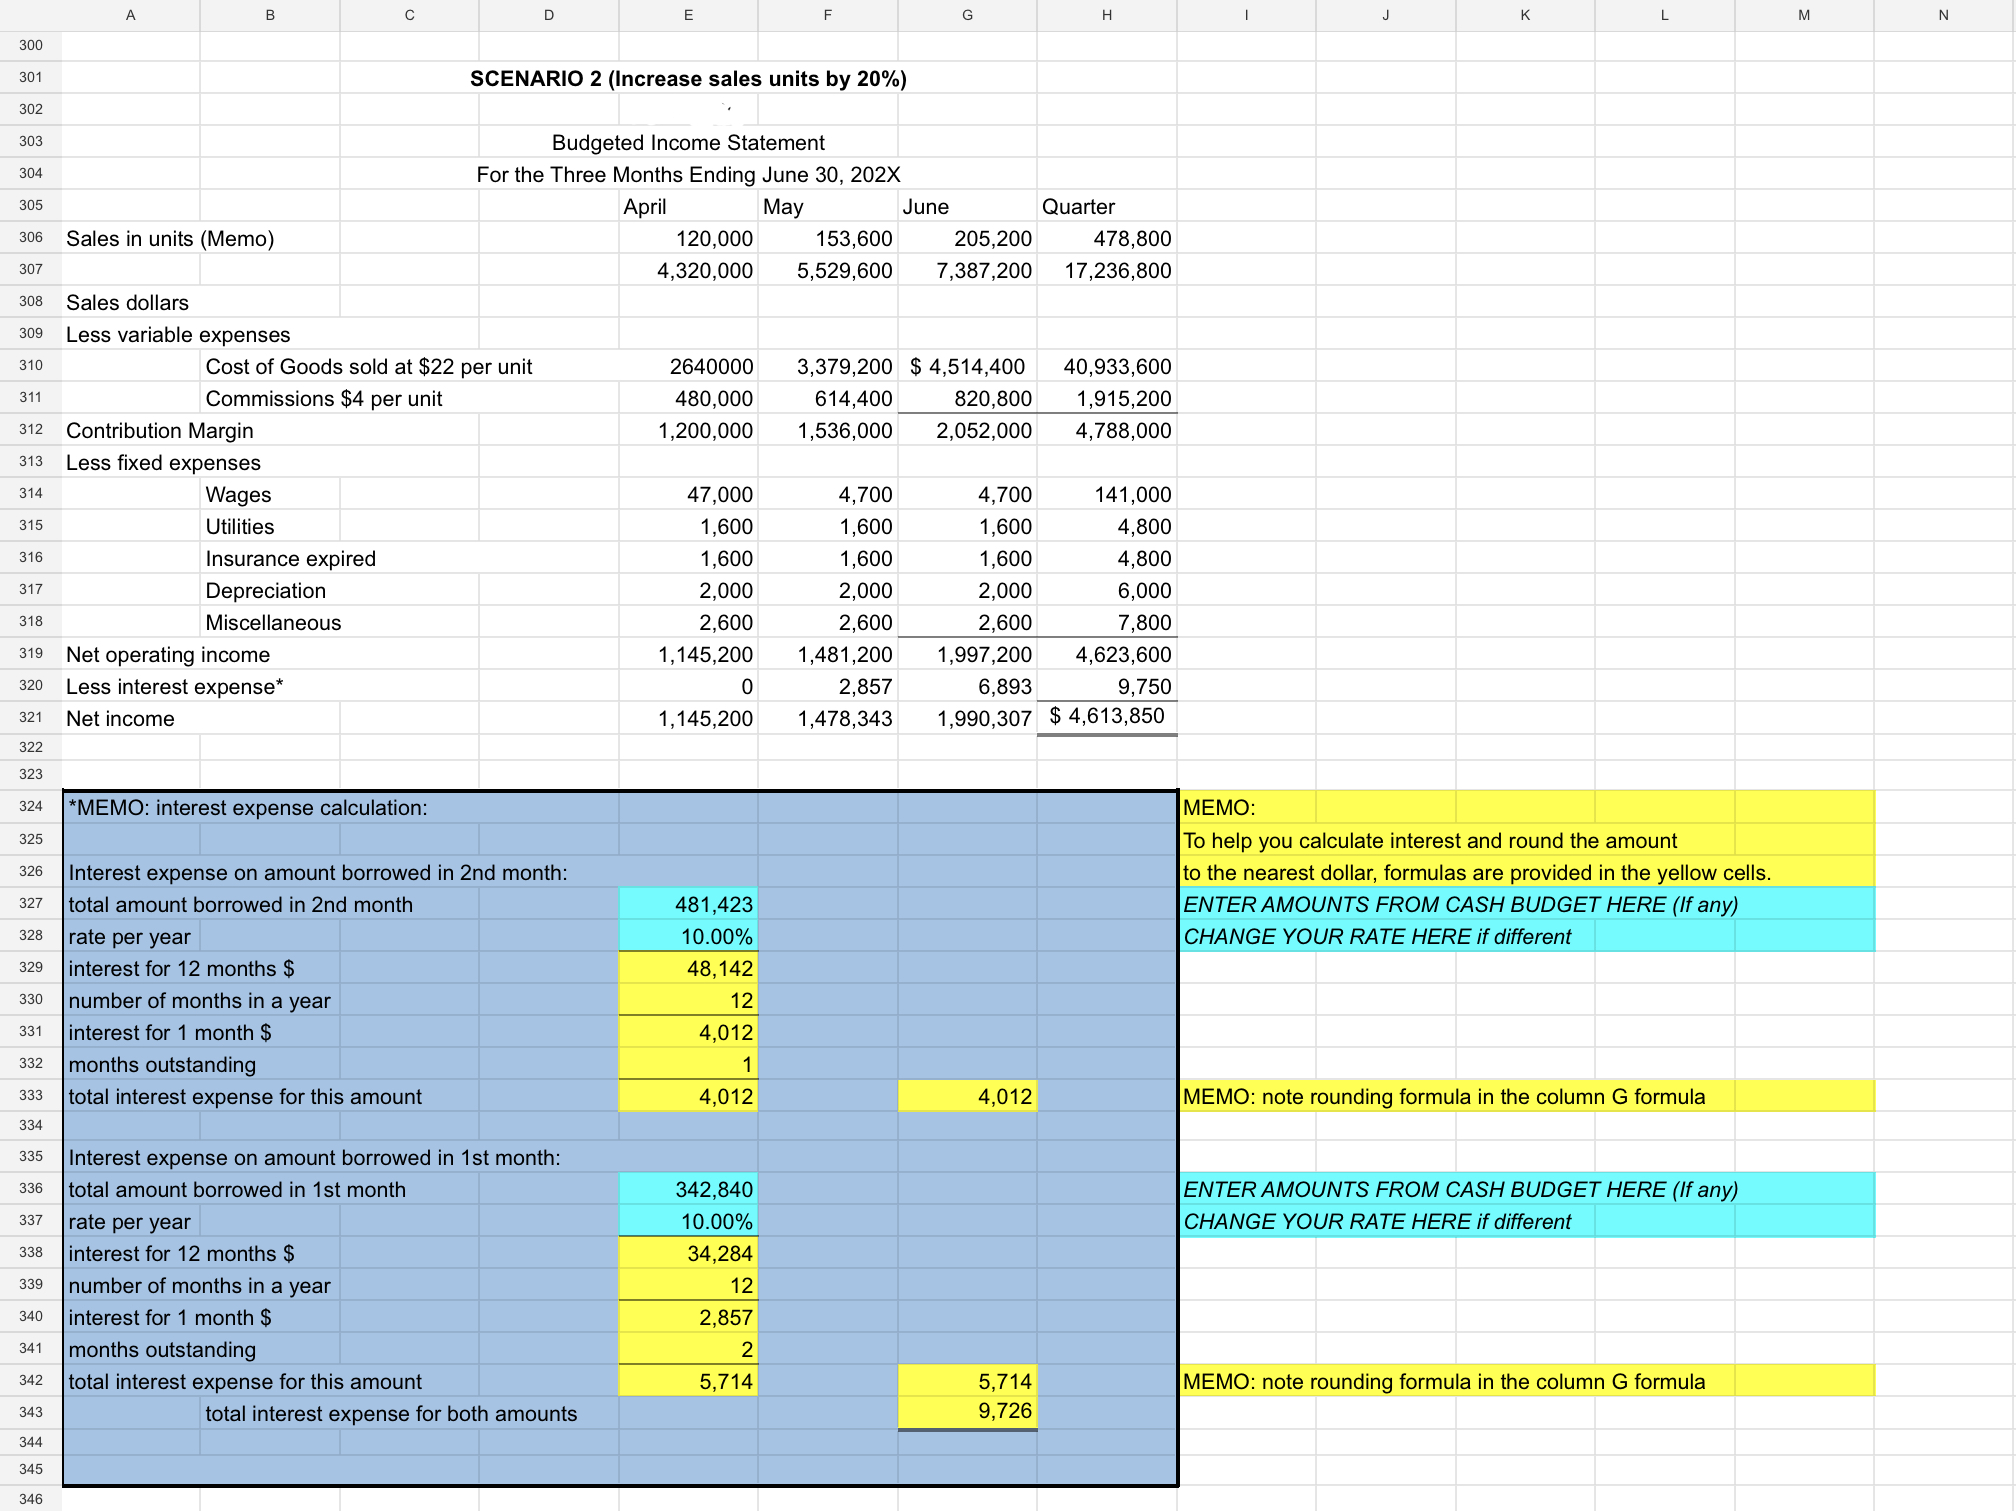
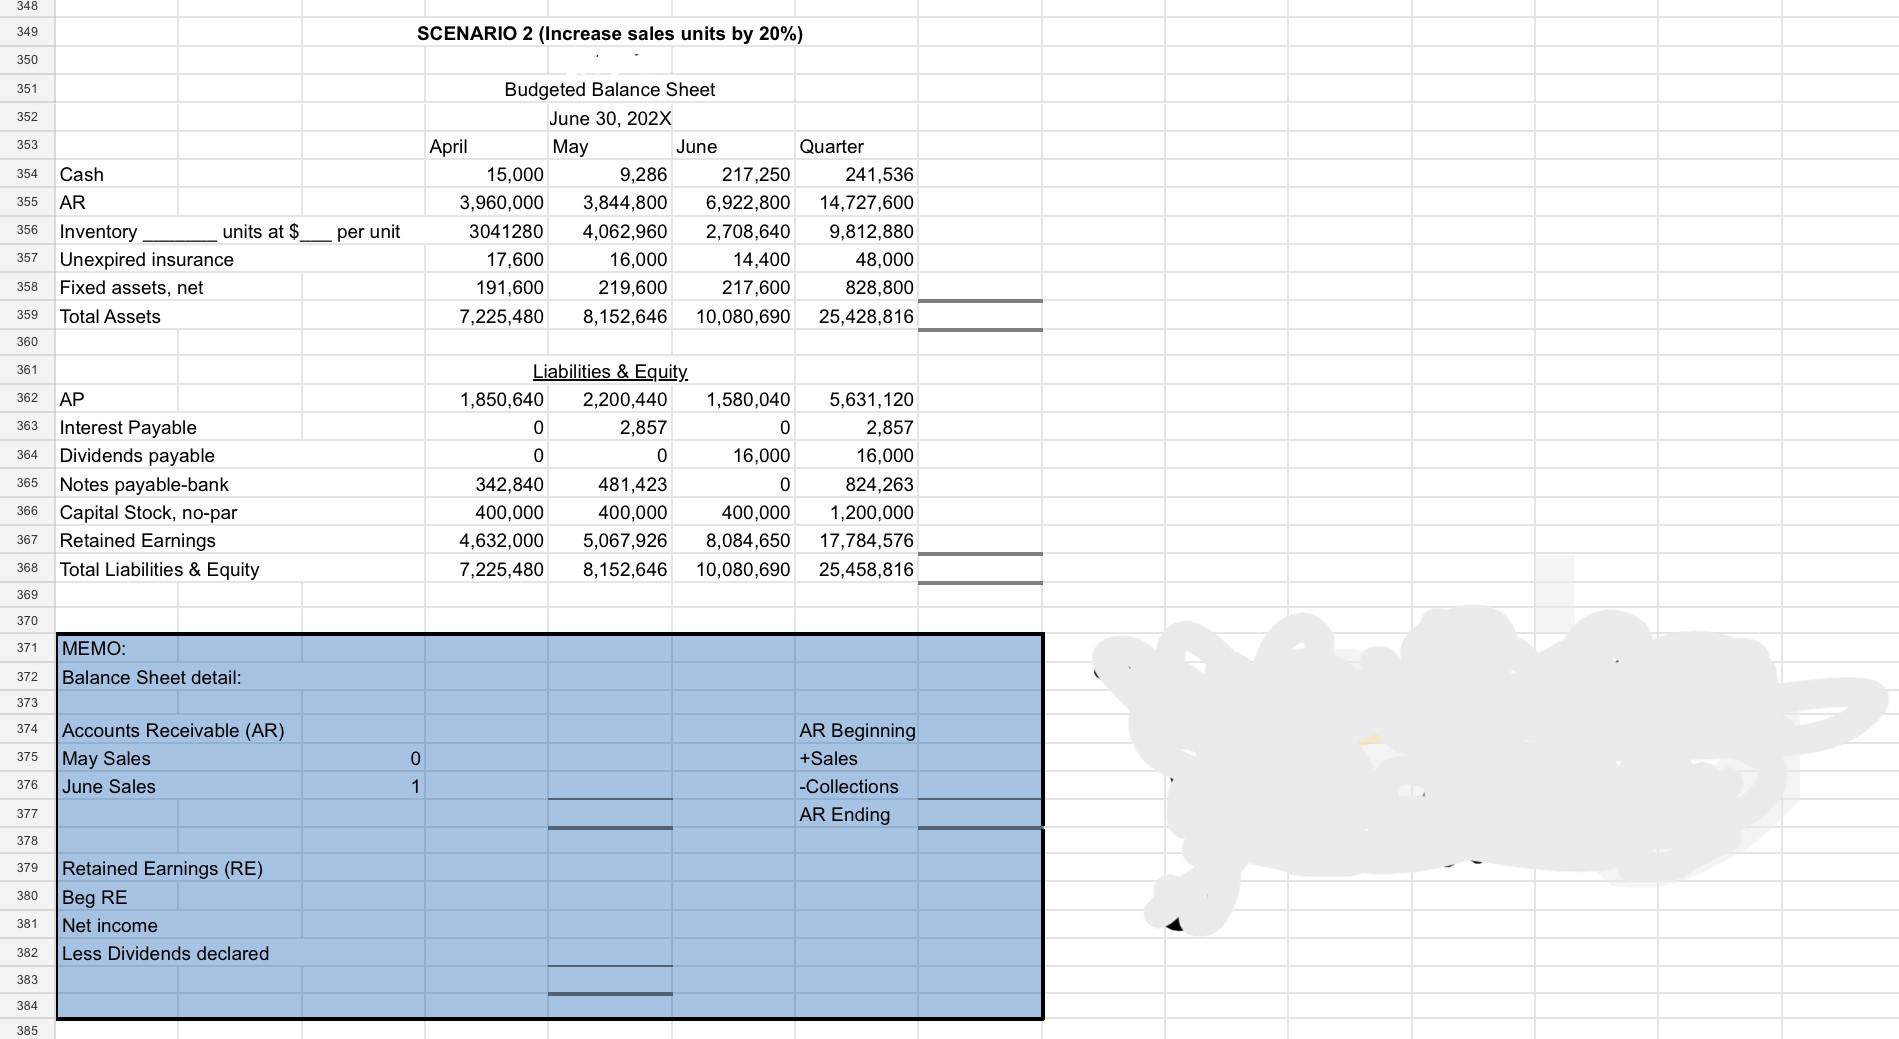
Accounting 1C Long Term Project- Master Budget You need to prepare a Master Budget for the The company has an exclusive right to sell PowerPulses and sales have been brisk. The Master Budget will be for the next three months starting April 1. The following information is available related to the budget. The company needs to maintain a minimum cash balance at the end of every month in the amount of $15,000. The Pulses are forecasted to sell at $36 each. Recent actual and projected sales (in units) are as follows Actual Jan 57,000 Feb 68,000 Mar 80,000 Projected Apr 100,000 May 128,000 Jun 171,000 Projected Jul Aug 114,000 103,000 Sep 91,000 In order to meet the product demand, the company has established a policy requiring that ending inventory for each month must be equal to 90% of the units expected to sold in the next month. The cost to purchase each unit of product is $22. Purchases are typically paid for as follows: 50% paid in the month of purchase, and the remaining 50% paid in the month after purchase. All sales are on credit, with no discount, and payable within 15 days. The company's collections on account usually are 25% in the month of sale, 50% in the month immediately after the sale, and 25% in the second month after sale. The company has a very rigorous credit policy and there are virtually no bad debts. The company's operating expenses are shown below: Variable: Sales Commissions Fixed: Wages Utilities Insurance expired Depreciation Miscellaneous $4 per unit $47,000 1,600 1,600 2,000 2,600 All operating expenses are paid during the month, in cash, with the exception of depreciation and insurance expired. New fixed assets will be purchased during May for $30,000. The company declares dividends of $16,000 each quarter, payable in the first month of the following quarter. Co.'s Balance Sheet at March 31 is as follows. ASSETS Cash $16,000 Accounts receivable* 2,772,000 Inventory (90000 units)** 1,980,000 Unexpired insurance 19,200 Fixed assets (net of depreciation) 193.600 Total Assets $4,980,800 LIABILITIES AND EQUITY Accounts payable (purchases) Dividends payable Capital stock, (no par) Retained Earnings Total Liabilities & Equity $1,078,000 16.000 400,000 3,486,800 $4,980,800 *Accounts receivable consists of $612,000 from February sales and $2,160,000 from March Sales. Use these numbers for both scenarios. ** Use this same March ending inventory number for both scenarios. The company has a good relationship with its bank and can borrow money. at a 10% annual rate at any time and in any amount. All borrowing and repayments must be made at the end of the month. When the company is ready to make a payment, all unpaid interest must be paid first. After the unpaid interest is paid, then principal can be repaid as long as the minimum cash balance is maintained. Required: You will complete all tasks listed below for the original facts above...this will be Scenario 1. Then you will repeat the entire process for Scenario 2. This second scenario will show what would happen if there was an increase of 20% (twenty percent) in the number of units sold. This is essentially a flexible budget. SCENARIO 1 Prepare a Master Budget for the three month period ending June 30th. Include the following detailed budgets: 1. a. A sales budget by month and in total. b. A schedule of budgeted cash collections from sales and accounts receivable by month and in total. c. A purchases budget in units and dollars by month and in total. d. A schedule of budgeted cash payments for purchases by month and in total. 2. A cash budget by month and in total. 3. A budgeted income statement for the three-month period ending June 30. Use the contribution margin approach. 4. A budgeted balance sheet as of June 30. 5. Calculate the Contribution Margin and Break-Even amounts (for the three month period) based on your assumptions about variable and fixed costs. SCENARIO 2 Repeat all the steps (1-5) shown above assuming that the number of units expected to be sold increase by 20%. The months January to March have already occurred so those will be the same for both Scenarios. Please pay attention to the information above when it says: *Accounts receivable consists of $612,000 from February sales and $2,160,000 from March Sales. Use these numbers for both scenarios. ** Use this same March ending inventory number for both scenarios. Budgeted Ending Inventory for June is based on July sales. Therefore you will need to increase the expected July sales in Scenario 2 and this will mean June Ending Inventory will be different in Scenario 2. Here are some check figures to check your final work. If you agree with these check numbers it is an important confirmation, although it is not guarantee that everything is correct. Amounts for the quarter: Scenario 1 Sales budget $14,364,000 Budgeted cash collections $11,367,000 Budgeted purchases $9,055,200 Scenario 2 $17,236,800 $13,086,000 $11,262,240 Budgeted cash payments-purchases $8,816,500 Ending Cash Balance $770,054 $10,760,200 $217,250 Inc Stmt Interest Expense $846 $9,750 Inc Stmt Net income $3,824,754 $4,613,850 Bal Sheet AR $5,769,000 $6,922,800 Bal Sheet Inventory $2,257,200 $2,708,640 Bal Sheet AP $1,316,700 $1,580,040 Bal Sheet Retained Earnings (RE) $7,295,554 $8,084,650 Bal Sheet Total Assets (=Liab+OE) $9,028,254 $10,080,690 A 6 7 Sales budget 8 B Amounts for the quarter: Budgeted cash collections C D E F G Scenario 1 H Scenario 2 14,364,000 17,236,800 11,367,000 13,086,000 9 Budgeted purchases 9,055,200 11,262,240 10 Budgeted cash payments-purchases 8,816,500 10,760,200 11 12 13 14 15 16 Ending Cash Balance Inc Stmt Net income Bal Sheet AR Bal Sheet Inventory Bal Sheet AP 770,054 217,250 Inc Stmt Interest Expense 846 9,750 3,824,754 4,613,850 5,769,000 6,922,800 2,257,000 2,708,640 1,316,000 1,580,040 17 Bal Sheet Retained Earning 7,295,554 8,084,650 18 Bal Sheet Total Assets (=Liab+OE) 9,028,254 10,080,690 19 20 21 222 222 23 24 25 26 27 28 29 30 Budgeted sales (units) 31 330 Budgeted sales price/unit 32 Budgeted sales price/dollars 33 SCENARIO 1 Sales budget For the Three Months Ending June 30, 202X | April May June Quarter $ 100,000 36 $ 128,000 36 $ 171,000 36 399,000 $ 36 $3,600,000 $4,608,000 $6,156,000 $14,364,000 34 35 36 37 38 39 40 40 41 February sales 42 March sales 43 April sales #4 44 May sales June sales 45 46 Total cash collections 47 60 48 49 49 50 51 52 53 SCENARIO 1 Budgeted cash collections For the Three Months Ending June 30, 202X April May June Quarter 612,000 0 612,000 1,440,000 720,000 0 2,160,000 900,000 1,800,000 900,000 3,600,000 1,152,000 2,304,000 3,456,000 1,539,000 1,539,000 $2,952,000 $ 3,672,000 $4,743,000 $11,367,000 SCENARIO 1 Budgeted purchases For the Three Months Ending June 30, 202X 54 55 56 56 Budgeted sales (units) Add budgeted ending inventory* 57 Total needs 58 Less beginning inventory Required purchases in units 59 669 60 19 61 62 Unit cost Required purchases in dollars April May June Quarter 100,000 128,000 171,000 399,000 115,200 153,900 102,600 371,700 215,200 281,900 273,600 770,700 90,000 115,200 153,900 359,100 125,200 166,700 119,700 411,600 $ 22 $ 22 $ 22 $ 22 $ 2,754,400 $ 3,667,400 $2,633,400 $ 9,055,200 63 64 *Budgeted ending inventory at 90% of next months sales in units. 65 66 SCENARIO 1 67 68 69 70 Budgeted cash payments for purchases For the Three Months Ending June 30, 202X 71 72 73 March purchases 74 April purchases 75 May purchases 76 June purchases 77 Total cash payments April 1,078,000 May June Quarter 0 0 1,078,000 1,377,200 1,377,200 1,833,700 0 2,754,400 1,833,700 3,667,400 1,316,700 1,316,700 $2,455,200 $3,210,900 $3,150,400 $8,816,500 78 79 80 SCENARIO 1 81 82 Cash Budget 83 For the Three Months Ending June 30, 202X 84 85 86 Cash balance beginning of month 87 Add cash from customers 88 Total cash available 89 Less cash payments: 90 Purchase of Inventory 91 Sales commissions 92 93 94 95 96 97 98 99 Financing 100 101 Salaries and wages Utilities Misc Dividends paid Total cash paid Excess (deficiency) of available over pmts Borrowing (Repayment) Interest Equipment Purchases 102 Total financing 103 Cash balance end of month April May June $ 16,000 $ 2,952,000 45,600 $ 15,000 3,672,000 4,743,000 11,367,000 Quarter $ 76,600 2,968,000 3,717,600 4,758,000 11,443,600 2,455,200 3,210,900 3,150,400 8,816,500 400,000 512,000 684,000 1,596,000 47,000 47,000 47,000 141,000 1,600 1,600 1,600 4,800 2,600 2,600 2,600 7,800 16,000 0 0 16,000 0 30,000 0 30,000 2,922,400 45,600 3,804,100 (86,500) 3,885,600 10,612,100 872,400 831,500 0 0 101,500 (101,500) 0 0 0 (8,458,333) (846) 0 101,500 (1,023,458) (846) $ 45,600 $ 15,000 $ 770,054 $ 830,654 105 106 107 108 A B D E F G H SCENARIO 1 Budgeted Income Statement For the Three Months Ending June 30, 202X 109 110 April May June Quarter 111 Sales in units (Memo) 100,000 128,000 171,000 399,000 112 113 Sales dollars 3,600,000 4,608,000 6,156,000 14,364,000 114 Less variable expenses 0 115 Cost of Goods sold at $22 per unit 116 Commissions $4 per unit 117 Contribution Margin 1,000,000 1,280,000 1,710,000 3,990,000 118 Less fixed expenses 0 119 Wages 47,000 47,000 47,000 141,000 120 Utilities 1,600 1,600 1,600 4,800 121 Insurance expired 1600 1,600 1,600 4,800 122 Depreciation 2,000 2,000 2,000 6,000 123 124 Miscellaneous 2,600 2,600 2,600 7,800 Net operating income 125 Less interest expense* 945,200 1,225,200 1,655,200 3,825,600 0 0 84,583,333 846 126 Net income 127 945,200 1,225,200 1,654,354 3,824,754 128 129 *MEMO: interest expense calculation: 130 131 Interest expense on amount borrowed in 2nd month: 132 total amount borrowed in 2nd month 133 rate per year 10.00% MEMO: To help you calculate interest and round the amount to the nearest dollar, formulas are provided in the yellow cells. ENTER AMOUNTS FROM CASH BUDGET HERE (If any) CHANGE YOUR RATE HERE if different 134 interest for 12 months $ 0 135 number of months in a year 12 136 interest for 1 month $ 0 137 months outstanding 1 138 total interest expense for this amount 0 0 MEMO: note rounding formula in the column G formula 139 140 Interest expense on amount borrowed in 1st month: 141 total amount borrowed in 1st month 142 rate per year 10.00% ENTER AMOUNTS FROM CASH BUDGET HERE (If any) CHANGE YOUR RATE HERE if different 143 interest for 12 months $ 0 144 number of months in a year 12 145 interest for 1 month $ 0 146 months outstanding 2 147 total interest expense for this amount 0 0 MEMO: note rounding formula in the column G formula 148 total interest expense for both amounts 0 149 150 151 152 SCENARIO 1 153 154 155 Budgeted Balance Sheet June 30, 202X 156 April May June Quarter 157 Cash 158 AR 159 Inventory ? units at $ ? per unit 160 Unexpired insurance 45,600 3,420,000 2534400 17,600 161 Fixed assets, net 162 Total Assets 191,600 6,209,200 15,000 3,204,000 3,385,800 16,000 219,600 6,840,400 770,054 5,769,000 830,654 12,393,000 2,257,200 8,177,400 14,400 217,600 9,028,254 48,000 628,800 22,077,854 163 164 Liabilities & Equity 165 AP 1,377,200 1,833,700 1,316,700 4,527,600 166 167 168 Interest Payable Dividends payable Notes payable-bank 0 0 0 0 0 0 101,500 16,000 0 0 16,000 101,500 169 Capital Stock, no-par 400,000 400,000 170 Retained Earnings 4,432,000 4,505,200 400,000 7,295,554 1,200,000 16,232,754 171 Total Liabilities & Equity 6,209,200 6,840,400 9,028,254 22,077,854 172 A B 0 D E F G H | J K L M N 300 301 302 303 304 SCENARIO 2 (Increase sales units by 20%) Budgeted Income Statement For the Three Months Ending June 30, 202X 305 306 Sales in units (Memo) 307 April May June Quarter 120,000 4,320,000 153,600 5,529,600 205,200 7,387,200 478,800 17,236,800 308 Sales dollars 309 Less variable expenses 310 Cost of Goods sold at $22 per unit 311 Commissions $4 per unit 312 Contribution Margin 2640000 480,000 614,400 1,200,000 1,536,000 3,379,200 $4,514,400 40,933,600 820,800 1,915,200 2,052,000 4,788,000 313 Less fixed expenses 314 Wages 47,000 4,700 4,700 141,000 315 Utilities 1,600 1,600 1,600 4,800 316 Insurance expired 1,600 1,600 1,600 4,800 317 Depreciation 2,000 2,000 2,000 6,000 318 Miscellaneous 2,600 2,600 2,600 7,800 319 Net operating income 1,145,200 1,481,200 1,997,200 4,623,600 320 Less interest expense* 0 321 Net income 1,145,200 2,857 1,478,343 6,893 1,990,307 $4,613,850 9,750 322 323 324 *MEMO: interest expense calculation: MEMO: 325 326 Interest expense on amount borrowed in 2nd month: 327 total amount borrowed in 2nd month 481,423 328 rate per year 10.00% To help you calculate interest and round the amount to the nearest dollar, formulas are provided in the yellow cells. ENTER AMOUNTS FROM CASH BUDGET HERE (If any) CHANGE YOUR RATE HERE if different 329 interest for 12 months $ 48,142 330 number of months in a year 12 331 interest for 1 month $ 4,012 332 months outstanding 1 333 total interest expense for this amount 4,012 4,012 MEMO: note rounding formula in the column G formula 334 335 Interest expense on amount borrowed in 1st month: 336 total amount borrowed in 1st month 342,840 337 rate per year 10.00% ENTER AMOUNTS FROM CASH BUDGET HERE (If any) CHANGE YOUR RATE HERE if different 338 interest for 12 months $ 34,284 339 number of months in a year 12 340 interest for 1 month $ 2,857 341 months outstanding 2 342 total interest expense for this amount 5,714 343 total interest expense for both amounts 5,714 9,726 MEMO: note rounding formula in the column G formula 344 345 346 348 349 350 351 352 SCENARIO 2 (Increase sales units by 20%) Budgeted Balance Sheet June 30, 202X 353 April 354 Cash 355 AR 356 Inventory units at $ per unit 15,000 3,960,000 3041280 357 Unexpired insurance 358 Fixed assets, net 359 Total Assets 360 361 362 363 364 365 AP Interest Payable Dividends payable Notes payable-bank 7,225,480 8,152,646 Liabilities & Equity. 1,850,640 2,200,440 May June Quarter 9,286 217,250 3,844,800 6,922,800 14,727,600 4,062,960 2,708,640 9,812,880 17,600 191,600 16,000 219,600 14,400 217,600 10,080,690 48,000 828,800 25,428,816 241,536 366 Capital Stock, no-par 367 Retained Earnings 368 Total Liabilities & Equity 4,632,000 5,067,926 7,225,480 8,152,646 10,080,690 25,458,816 1,580,040 0 0 2,857 0 0 2,857 342,840 481,423 16,000 0 16,000 824,263 400,000 400,000 400,000 1,200,000 8,084,650 17,784,576 5,631,120 369 370 371 MEMO: 372 Balance Sheet detail: 373 374 Accounts Receivable (AR) 375 May Sales 0 376 June Sales 1 AR Beginning +Sales -Collections 377 AR Ending 378 379 Retained Earnings (RE) 380 Beg RE 381 Net income 382 Less Dividends declared 383 384 385 Accounting 1C Long Term Project- Master Budget You need to prepare a Master Budget for the The company has an exclusive right to sell PowerPulses and sales have been brisk. The Master Budget will be for the next three months starting April 1. The following information is available related to the budget. The company needs to maintain a minimum cash balance at the end of every month in the amount of $15,000. The Pulses are forecasted to sell at $36 each. Recent actual and projected sales (in units) are as follows Actual Jan 57,000 Feb 68,000 Mar 80,000 Projected Apr 100,000 May 128,000 Jun 171,000 Projected Jul Aug 114,000 103,000 Sep 91,000 In order to meet the product demand, the company has established a policy requiring that ending inventory for each month must be equal to 90% of the units expected to sold in the next month. The cost to purchase each unit of product is $22. Purchases are typically paid for as follows: 50% paid in the month of purchase, and the remaining 50% paid in the month after purchase. All sales are on credit, with no discount, and payable within 15 days. The company's collections on account usually are 25% in the month of sale, 50% in the month immediately after the sale, and 25% in the second month after sale. The company has a very rigorous credit policy and there are virtually no bad debts. The company's operating expenses are shown below: Variable: Sales Commissions Fixed: Wages Utilities Insurance expired Depreciation Miscellaneous $4 per unit $47,000 1,600 1,600 2,000 2,600 All operating expenses are paid during the month, in cash, with the exception of depreciation and insurance expired. New fixed assets will be purchased during May for $30,000. The company declares dividends of $16,000 each quarter, payable in the first month of the following quarter. Co.'s Balance Sheet at March 31 is as follows. ASSETS Cash $16,000 Accounts receivable* 2,772,000 Inventory (90000 units)** 1,980,000 Unexpired insurance 19,200 Fixed assets (net of depreciation) 193.600 Total Assets $4,980,800 LIABILITIES AND EQUITY Accounts payable (purchases) Dividends payable Capital stock, (no par) Retained Earnings Total Liabilities & Equity $1,078,000 16.000 400,000 3,486,800 $4,980,800 *Accounts receivable consists of $612,000 from February sales and $2,160,000 from March Sales. Use these numbers for both scenarios. ** Use this same March ending inventory number for both scenarios. The company has a good relationship with its bank and can borrow money. at a 10% annual rate at any time and in any amount. All borrowing and repayments must be made at the end of the month. When the company is ready to make a payment, all unpaid interest must be paid first. After the unpaid interest is paid, then principal can be repaid as long as the minimum cash balance is maintained. Required: You will complete all tasks listed below for the original facts above...this will be Scenario 1. Then you will repeat the entire process for Scenario 2. This second scenario will show what would happen if there was an increase of 20% (twenty percent) in the number of units sold. This is essentially a flexible budget. SCENARIO 1 Prepare a Master Budget for the three month period ending June 30th. Include the following detailed budgets: 1. a. A sales budget by month and in total. b. A schedule of budgeted cash collections from sales and accounts receivable by month and in total. c. A purchases budget in units and dollars by month and in total. d. A schedule of budgeted cash payments for purchases by month and in total. 2. A cash budget by month and in total. 3. A budgeted income statement for the three-month period ending June 30. Use the contribution margin approach. 4. A budgeted balance sheet as of June 30. 5. Calculate the Contribution Margin and Break-Even amounts (for the three month period) based on your assumptions about variable and fixed costs. SCENARIO 2 Repeat all the steps (1-5) shown above assuming that the number of units expected to be sold increase by 20%. The months January to March have already occurred so those will be the same for both Scenarios. Please pay attention to the information above when it says: *Accounts receivable consists of $612,000 from February sales and $2,160,000 from March Sales. Use these numbers for both scenarios. ** Use this same March ending inventory number for both scenarios. Budgeted Ending Inventory for June is based on July sales. Therefore you will need to increase the expected July sales in Scenario 2 and this will mean June Ending Inventory will be different in Scenario 2. Here are some check figures to check your final work. If you agree with these check numbers it is an important confirmation, although it is not guarantee that everything is correct. Amounts for the quarter: Scenario 1 Sales budget $14,364,000 Budgeted cash collections $11,367,000 Budgeted purchases $9,055,200 Scenario 2 $17,236,800 $13,086,000 $11,262,240 Budgeted cash payments-purchases $8,816,500 Ending Cash Balance $770,054 $10,760,200 $217,250 Inc Stmt Interest Expense $846 $9,750 Inc Stmt Net income $3,824,754 $4,613,850 Bal Sheet AR $5,769,000 $6,922,800 Bal Sheet Inventory $2,257,200 $2,708,640 Bal Sheet AP $1,316,700 $1,580,040 Bal Sheet Retained Earnings (RE) $7,295,554 $8,084,650 Bal Sheet Total Assets (=Liab+OE) $9,028,254 $10,080,690 A 6 7 Sales budget 8 B Amounts for the quarter: Budgeted cash collections C D E F G Scenario 1 H Scenario 2 14,364,000 17,236,800 11,367,000 13,086,000 9 Budgeted purchases 9,055,200 11,262,240 10 Budgeted cash payments-purchases 8,816,500 10,760,200 11 12 13 14 15 16 Ending Cash Balance Inc Stmt Net income Bal Sheet AR Bal Sheet Inventory Bal Sheet AP 770,054 217,250 Inc Stmt Interest Expense 846 9,750 3,824,754 4,613,850 5,769,000 6,922,800 2,257,000 2,708,640 1,316,000 1,580,040 17 Bal Sheet Retained Earning 7,295,554 8,084,650 18 Bal Sheet Total Assets (=Liab+OE) 9,028,254 10,080,690 19 20 21 222 222 23 24 25 26 27 28 29 30 Budgeted sales (units) 31 330 Budgeted sales price/unit 32 Budgeted sales price/dollars 33 SCENARIO 1 Sales budget For the Three Months Ending June 30, 202X | April May June Quarter $ 100,000 36 $ 128,000 36 $ 171,000 36 399,000 $ 36 $3,600,000 $4,608,000 $6,156,000 $14,364,000 34 35 36 37 38 39 40 40 41 February sales 42 March sales 43 April sales #4 44 May sales June sales 45 46 Total cash collections 47 60 48 49 49 50 51 52 53 SCENARIO 1 Budgeted cash collections For the Three Months Ending June 30, 202X April May June Quarter 612,000 0 612,000 1,440,000 720,000 0 2,160,000 900,000 1,800,000 900,000 3,600,000 1,152,000 2,304,000 3,456,000 1,539,000 1,539,000 $2,952,000 $ 3,672,000 $4,743,000 $11,367,000 SCENARIO 1 Budgeted purchases For the Three Months Ending June 30, 202X 54 55 56 56 Budgeted sales (units) Add budgeted ending inventory* 57 Total needs 58 Less beginning inventory Required purchases in units 59 669 60 19 61 62 Unit cost Required purchases in dollars April May June Quarter 100,000 128,000 171,000 399,000 115,200 153,900 102,600 371,700 215,200 281,900 273,600 770,700 90,000 115,200 153,900 359,100 125,200 166,700 119,700 411,600 $ 22 $ 22 $ 22 $ 22 $ 2,754,400 $ 3,667,400 $2,633,400 $ 9,055,200 63 64 *Budgeted ending inventory at 90% of next months sales in units. 65 66 SCENARIO 1 67 68 69 70 Budgeted cash payments for purchases For the Three Months Ending June 30, 202X 71 72 73 March purchases 74 April purchases 75 May purchases 76 June purchases 77 Total cash payments April 1,078,000 May June Quarter 0 0 1,078,000 1,377,200 1,377,200 1,833,700 0 2,754,400 1,833,700 3,667,400 1,316,700 1,316,700 $2,455,200 $3,210,900 $3,150,400 $8,816,500 78 79 80 SCENARIO 1 81 82 Cash Budget 83 For the Three Months Ending June 30, 202X 84 85 86 Cash balance beginning of month 87 Add cash from customers 88 Total cash available 89 Less cash payments: 90 Purchase of Inventory 91 Sales commissions 92 93 94 95 96 97 98 99 Financing 100 101 Salaries and wages Utilities Misc Dividends paid Total cash paid Excess (deficiency) of available over pmts Borrowing (Repayment) Interest Equipment Purchases 102 Total financing 103 Cash balance end of month April May June $ 16,000 $ 2,952,000 45,600 $ 15,000 3,672,000 4,743,000 11,367,000 Quarter $ 76,600 2,968,000 3,717,600 4,758,000 11,443,600 2,455,200 3,210,900 3,150,400 8,816,500 400,000 512,000 684,000 1,596,000 47,000 47,000 47,000 141,000 1,600 1,600 1,600 4,800 2,600 2,600 2,600 7,800 16,000 0 0 16,000 0 30,000 0 30,000 2,922,400 45,600 3,804,100 (86,500) 3,885,600 10,612,100 872,400 831,500 0 0 101,500 (101,500) 0 0 0 (8,458,333) (846) 0 101,500 (1,023,458) (846) $ 45,600 $ 15,000 $ 770,054 $ 830,654 105 106 107 108 A B D E F G H SCENARIO 1 Budgeted Income Statement For the Three Months Ending June 30, 202X 109 110 April May June Quarter 111 Sales in units (Memo) 100,000 128,000 171,000 399,000 112 113 Sales dollars 3,600,000 4,608,000 6,156,000 14,364,000 114 Less variable expenses 0 115 Cost of Goods sold at $22 per unit 116 Commissions $4 per unit 117 Contribution Margin 1,000,000 1,280,000 1,710,000 3,990,000 118 Less fixed expenses 0 119 Wages 47,000 47,000 47,000 141,000 120 Utilities 1,600 1,600 1,600 4,800 121 Insurance expired 1600 1,600 1,600 4,800 122 Depreciation 2,000 2,000 2,000 6,000 123 124 Miscellaneous 2,600 2,600 2,600 7,800 Net operating income 125 Less interest expense* 945,200 1,225,200 1,655,200 3,825,600 0 0 84,583,333 846 126 Net income 127 945,200 1,225,200 1,654,354 3,824,754 128 129 *MEMO: interest expense calculation: 130 131 Interest expense on amount borrowed in 2nd month: 132 total amount borrowed in 2nd month 133 rate per year 10.00% MEMO: To help you calculate interest and round the amount to the nearest dollar, formulas are provided in the yellow cells. ENTER AMOUNTS FROM CASH BUDGET HERE (If any) CHANGE YOUR RATE HERE if different 134 interest for 12 months $ 0 135 number of months in a year 12 136 interest for 1 month $ 0 137 months outstanding 1 138 total interest expense for this amount 0 0 MEMO: note rounding formula in the column G formula 139 140 Interest expense on amount borrowed in 1st month: 141 total amount borrowed in 1st month 142 rate per year 10.00% ENTER AMOUNTS FROM CASH BUDGET HERE (If any) CHANGE YOUR RATE HERE if different 143 interest for 12 months $ 0 144 number of months in a year 12 145 interest for 1 month $ 0 146 months outstanding 2 147 total interest expense for this amount 0 0 MEMO: note rounding formula in the column G formula 148 total interest expense for both amounts 0 149 150 151 152 SCENARIO 1 153 154 155 Budgeted Balance Sheet June 30, 202X 156 April May June Quarter 157 Cash 158 AR 159 Inventory ? units at $ ? per unit 160 Unexpired insurance 45,600 3,420,000 2534400 17,600 161 Fixed assets, net 162 Total Assets 191,600 6,209,200 15,000 3,204,000 3,385,800 16,000 219,600 6,840,400 770,054 5,769,000 830,654 12,393,000 2,257,200 8,177,400 14,400 217,600 9,028,254 48,000 628,800 22,077,854 163 164 Liabilities & Equity 165 AP 1,377,200 1,833,700 1,316,700 4,527,600 166 167 168 Interest Payable Dividends payable Notes payable-bank 0 0 0 0 0 0 101,500 16,000 0 0 16,000 101,500 169 Capital Stock, no-par 400,000 400,000 170 Retained Earnings 4,432,000 4,505,200 400,000 7,295,554 1,200,000 16,232,754 171 Total Liabilities & Equity 6,209,200 6,840,400 9,028,254 22,077,854 172 A B 0 D E F G H | J K L M N 300 301 302 303 304 SCENARIO 2 (Increase sales units by 20%) Budgeted Income Statement For the Three Months Ending June 30, 202X 305 306 Sales in units (Memo) 307 April May June Quarter 120,000 4,320,000 153,600 5,529,600 205,200 7,387,200 478,800 17,236,800 308 Sales dollars 309 Less variable expenses 310 Cost of Goods sold at $22 per unit 311 Commissions $4 per unit 312 Contribution Margin 2640000 480,000 614,400 1,200,000 1,536,000 3,379,200 $4,514,400 40,933,600 820,800 1,915,200 2,052,000 4,788,000 313 Less fixed expenses 314 Wages 47,000 4,700 4,700 141,000 315 Utilities 1,600 1,600 1,600 4,800 316 Insurance expired 1,600 1,600 1,600 4,800 317 Depreciation 2,000 2,000 2,000 6,000 318 Miscellaneous 2,600 2,600 2,600 7,800 319 Net operating income 1,145,200 1,481,200 1,997,200 4,623,600 320 Less interest expense* 0 321 Net income 1,145,200 2,857 1,478,343 6,893 1,990,307 $4,613,850 9,750 322 323 324 *MEMO: interest expense calculation: MEMO: 325 326 Interest expense on amount borrowed in 2nd month: 327 total amount borrowed in 2nd month 481,423 328 rate per year 10.00% To help you calculate interest and round the amount to the nearest dollar, formulas are provided in the yellow cells. ENTER AMOUNTS FROM CASH BUDGET HERE (If any) CHANGE YOUR RATE HERE if different 329 interest for 12 months $ 48,142 330 number of months in a year 12 331 interest for 1 month $ 4,012 332 months outstanding 1 333 total interest expense for this amount 4,012 4,012 MEMO: note rounding formula in the column G formula 334 335 Interest expense on amount borrowed in 1st month: 336 total amount borrowed in 1st month 342,840 337 rate per year 10.00% ENTER AMOUNTS FROM CASH BUDGET HERE (If any) CHANGE YOUR RATE HERE if different 338 interest for 12 months $ 34,284 339 number of months in a year 12 340 interest for 1 month $ 2,857 341 months outstanding 2 342 total interest expense for this amount 5,714 343 total interest expense for both amounts 5,714 9,726 MEMO: note rounding formula in the column G formula 344 345 346 348 349 350 351 352 SCENARIO 2 (Increase sales units by 20%) Budgeted Balance Sheet June 30, 202X 353 April 354 Cash 355 AR 356 Inventory units at $ per unit 15,000 3,960,000 3041280 357 Unexpired insurance 358 Fixed assets, net 359 Total Assets 360 361 362 363 364 365 AP Interest Payable Dividends payable Notes payable-bank 7,225,480 8,152,646 Liabilities & Equity. 1,850,640 2,200,440 May June Quarter 9,286 217,250 3,844,800 6,922,800 14,727,600 4,062,960 2,708,640 9,812,880 17,600 191,600 16,000 219,600 14,400 217,600 10,080,690 48,000 828,800 25,428,816 241,536 366 Capital Stock, no-par 367 Retained Earnings 368 Total Liabilities & Equity 4,632,000 5,067,926 7,225,480 8,152,646 10,080,690 25,458,816 1,580,040 0 0 2,857 0 0 2,857 342,840 481,423 16,000 0 16,000 824,263 400,000 400,000 400,000 1,200,000 8,084,650 17,784,576 5,631,120 369 370 371 MEMO: 372 Balance Sheet detail: 373 374 Accounts Receivable (AR) 375 May Sales 0 376 June Sales 1 AR Beginning +Sales -Collections 377 AR Ending 378 379 Retained Earnings (RE) 380 Beg RE 381 Net income 382 Less Dividends declared 383 384 385
Expert Answer:

Related Book For 

Human Resource Management
ISBN: 978-0538453158
13th Edition
Authors: Robert L. Mathis, John H. Jackson
Posted Date:
Students also viewed these accounting questions
-
What operational changes would you recommend to Wally to improve performance? Wally Meyer deftly balanced his office keys and a large printout of forecasting data as he wheeled his mountain bike...
-
Sandra, a sole proprietor, is an interior designer and has thefollowing account balances on December 31, 20X0: Cash $2,500,Inventory $9,000, Equipment $25,000, Accumulated depreciation$5,000, Liabi 2...
-
How do chemical and physical barriers protect the body?
-
How is the operating cash flow to current liabilities ratio calculated? Explain its use.
-
Using an incremental internal rate of return (IRR) analysis, the decision to replace the "current best" by the "challenger"' is based on what decision rule? a. The internal rate of return of the...
-
Large frauds can often be detected by performing financial statement analysis. Although such analysis can raise areas of concern, not all red flags are the result of fraudulent activities. Reasonable...
-
How is an administrative body usually defined?
-
IO addi $80, $80, 4 wwwww Il lw $t0, ($s0) 12 add $t1, $t1,$s0 13 w $t0, value 14 add $s1, $s1, $to Label all data stalls (Draw an X in the box). Label all data forwards that the forwarding unit...
-
Two boats start together and race across a 4 4 - km - wide lake and back. Boat A goes across at 4 4 km / h and returns at 4 4 km / h . Boat B goes across at 2 2 km / h , and its crew, realizing how...
-
You are considering the purchase of an electrical heater over a gas fired heater. The specs on it say that it has a resistance of 32 when it is operating on a 110 V outlet. Calculate the total energy...
-
Which of the following statements is not correct for a diver performing a dive on Earth? a. The gravitational attraction of the diver toward Earth and Earth toward the diver are equal in magnitude....
-
Using KVL, find the magnitude and direction of the current in R. = ||v I I. 22 = 16V E E = 12V R 252 23952 R M 352 Ry 152
-
What are the memory locations that has the value 0X55? LDI R19,0x7 LDI R16,0x55 LDI YL,LOW($140) LDI YH,HIGH($140) ST Y+, R16 DEC R19 BRNE L1 L1:
-
An object of mass m 1 hangs from a string that passes over a very light fixed pulley P 1 as shown in the figure below. The string connects to a second very light pulley P 2 . A second string passes...
-
Arlington Merchants reported the following on its income statement for the fiscal years ending December 31, 2016 and 2015. 2016 2015 Sales $4,857,500 $4,752,900 Cost of goods sold 3,258,950 3,207,000...
-
Describe the broad range of talent management efforts that use software applications by going to www.learn.com. Then give some examples of firms that have successfully used these applications.
-
What are some of the possible advantages and disadvantages of the draft approach to placing candidates in business units?
-
Discuss several areas in which HR can affect organizational culture positively or negatively.
-
A second-order dynamic system is modeled as \[9 \ddot{x}+6 \dot{x}+\frac{10}{9} x=14 \delta(t), \quad x(0)=0, \quad \dot{x}(0)=-\frac{1}{4}\] a. Find the response \(x(t)\) in closed form. b. Plot the...
-
Consider a first-order system with time constant \(\tau\) and zero initial condition. Find the system's unit-step response for \(\tau=\frac{1}{3}\) and \(\frac{2}{3}\), plot the two curves versus \(0...
-
a. Identify the damping type and find the free response. b. Plot the free response by using the initial command. \(\ddot{x}+3 \dot{x}+4 x=0, \quad x(0)=\frac{2}{5}, \quad \dot{x}(0)=0\)
Making Conflict Work Harnessing The Power Of Disagreement 1st Edition - ISBN: 0544582748 - Free Book

Study smarter with the SolutionInn App