

The following graph shows the demand curve for a group of consumers in the U.S. market...
Fantastic news! We've Found the answer you've been seeking!
Question:

Transcribed Image Text:
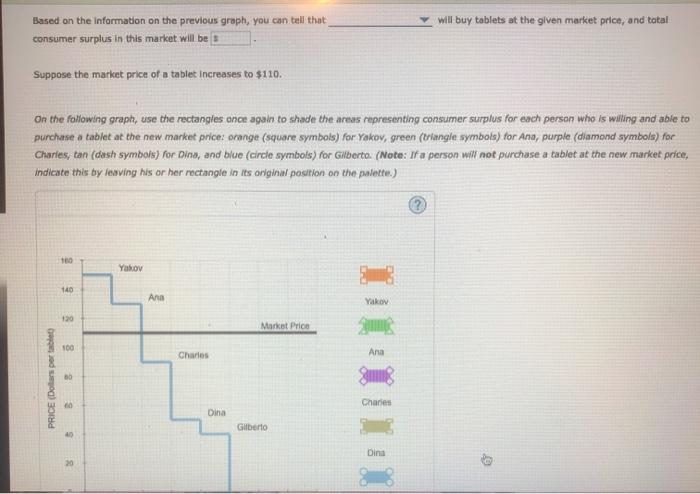
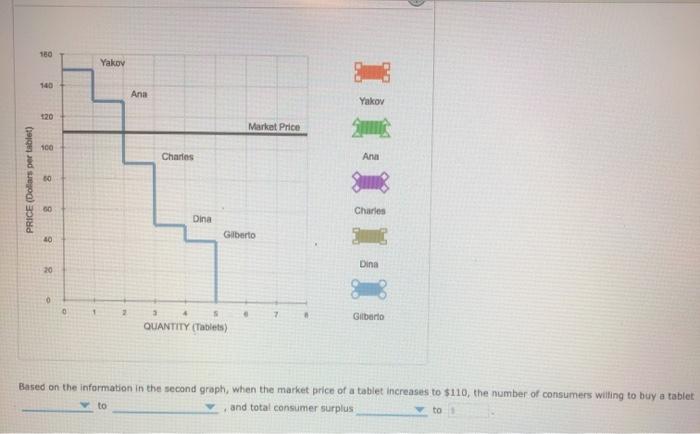
The following graph shows the demand curve for a group of consumers in the U.S. market (blue line) for tablets. The market price of a tablet is shown by the black horlzontal ilne at $70. Each rectangle you can place on the following graph corresponds to a particular buyer in this market: orange (square symbols) for Yakov, green (triangle symbols) for Ana, purple (diamond symbols) for Charles, tan (dash symbols) for Dina, and blue (circle symbols) for Gilberto. Use the rectangles to shade the areas representing consumer surplus for each person who is willing and able to purchase a tablet at a market price of $70. (Note: if a person will not purchase a tablet at the market price, indicate this by leaving his or her rectangle in its original position on the palette.) 160 Yakov 140 Ana Yakov 120 100 Charles Ana Market Price Charles Dina Giberto 40 Dina 20 PRICE (Dolars per tablet) Based on the Information on the previous graph, you can tell that will buy tablets at the glven market price, and tatal consumer surplus in this market will be D Suppose the market price of a tablet Increases to $110. On the following graph, use the rectangles once again to shade the areas representing consumer surplus for each person who is wiling and able to purchase a tablet at the new market price: orange (square symbols) for Yakov, green (triangle symbols) for Ana, purple (diamond symbols) for Charles, tan (dash symbols) for Dina, and blue (circle symbols) for Gilberto. (Note: If a person will not purchase a tablet at the new market price, indicate this by lesving his or her rectangle in its original position on the palette.) 10 Yakov 140 Ana Yakov 120 Market Price 100 Charles Ana Charies 60 Dina Gilberto Dina 20 PRICE (Dolars per tablet 180 Yakov 140 Ana Yakov 120 Market Price 100 Charles Ana 60 60 Charles Dina Gilberto 40 Dina 20 7. Gilberto QUANTITY (Tablets) Based on the information in the second graph, when the market price of a tablet increases to $110, the number of consumers willing to buy a tablet to and total consumer surplus to PRICE (Dollars per tablet) The following graph shows the demand curve for a group of consumers in the U.S. market (blue line) for tablets. The market price of a tablet is shown by the black horlzontal ilne at $70. Each rectangle you can place on the following graph corresponds to a particular buyer in this market: orange (square symbols) for Yakov, green (triangle symbols) for Ana, purple (diamond symbols) for Charles, tan (dash symbols) for Dina, and blue (circle symbols) for Gilberto. Use the rectangles to shade the areas representing consumer surplus for each person who is willing and able to purchase a tablet at a market price of $70. (Note: if a person will not purchase a tablet at the market price, indicate this by leaving his or her rectangle in its original position on the palette.) 160 Yakov 140 Ana Yakov 120 100 Charles Ana Market Price Charles Dina Giberto 40 Dina 20 PRICE (Dolars per tablet) Based on the Information on the previous graph, you can tell that will buy tablets at the glven market price, and tatal consumer surplus in this market will be D Suppose the market price of a tablet Increases to $110. On the following graph, use the rectangles once again to shade the areas representing consumer surplus for each person who is wiling and able to purchase a tablet at the new market price: orange (square symbols) for Yakov, green (triangle symbols) for Ana, purple (diamond symbols) for Charles, tan (dash symbols) for Dina, and blue (circle symbols) for Gilberto. (Note: If a person will not purchase a tablet at the new market price, indicate this by lesving his or her rectangle in its original position on the palette.) 10 Yakov 140 Ana Yakov 120 Market Price 100 Charles Ana Charies 60 Dina Gilberto Dina 20 PRICE (Dolars per tablet 180 Yakov 140 Ana Yakov 120 Market Price 100 Charles Ana 60 60 Charles Dina Gilberto 40 Dina 20 7. Gilberto QUANTITY (Tablets) Based on the information in the second graph, when the market price of a tablet increases to $110, the number of consumers willing to buy a tablet to and total consumer surplus to PRICE (Dollars per tablet)
Expert Answer:

Related Book For 

Posted Date:
Students also viewed these mathematics questions
-
The following graph shows the demand curve (D) of a home country facing the foreign monopoly supplier of a good to the home country, the associated marginal revenue curve (MR), the foreign firms...
-
A senior manager, responsible for a group of 120 junior executives, is interested in the total amount of time per week spent by these people in internal meetings. A random sample of 35 of these...
-
Label each transition in this flowchart Label each transition in this flowchart as a chemical change or a physical change. 8 chemical physical 00
-
A drawing in an 8.5-by-ll-inch sheet is digitized by means of a 300 dpi (dots per inch) scanner. a. What is the visual resolution of the resulting image (number of dots in each dimension)? b. If 8...
-
Find the Laplace transform of the given periodic function of \(f(t)\) in Figure 2.17 FIGURE 2.17 Periodic function in Problem 17. 1 ^(t) 0 2
-
The test scores for the boys who received their Australian Tertiary Admission Rank (ATAR) are normally distributed. In a recent year, the mean test score for the boys was 63.75 and the standard...
-
Microsoft and a smaller rival often have to select from one of two competing technologies. The rival always prefers to select the same technology as Microsoft (because compatibility is important),...
-
1. A scientist measures a piece of steel using a scale in the lab. The scale reports out a mass of 190 grams. However, for their calculations the scientist needs the mass to be in kg. What is the...
-
Sema plc, a company in the heavy engineering industry, carried out an expansion programme in the 20X6 financial year, in order to meet a permanent increase in contracts. The company selected a...
-
What is the impact on the Income Statement related to the transaction described in the second row, "Revenue deferred"? Specifically, will this transaction increase, decrease or have no impact on Net...
-
Explain how a management buyout deal is usually structured in both terms of its corporate/ legal structure and it's financial structure?
-
A jet airplane is climbing at a constant airspeed in no-wind conditions. The plane is directly over a point on the ground that is 14 nautical miles from the takeoff point from an airport at sea level...
-
write a sales letter to convince a potential customer to buy your product. Using the A.I.D.A strategy elements, write a letter to sell a product of your choice.
-
(g) Explain why it is necessary to exit from an investment and list the pros and cons to both a venture capitalist investor and the company's management team of exiting via a trade sale and via a...
-
Sonya is selling her jet ski and has the following offers to choose fre 1. $3.500 today OR 2. $1.700 today and $1,900 in 5 months If money carns 6.3% simple interest a. What is the current economic...
-
#Python code Merge k sorted arrays into one sorted array in O(n log k) time, where n is the total number of elements in the k arrays. Note: you need to justify that your algorithm runs in O(n log k)...
-
In Exercises discuss the continuity of each function. f(x) -3 1 x - 4 y 3 2 -1 -2 -3+ 3 X
-
True or False: A small country with widespread starvation would be well advised to concentrate its resources in the production of food rather than in the production of decorative jewelry.
-
Many firms employ salespeople who are assigned exclusive territories. No salesperson may enter another's territory and attempt to sell the manufacturer's product there. Construct a theory to explain...
-
The American supply and demand curves for cars cross at $15,000. Foreigners will sell us any number of cars at the world price of $10,000. Now the government announces two new taxes: a sales tax of...
-
Input the other metrics from the individual tax returns (e.g., income from wages and salaries, interest earned, and estimated tax payments). a. Review the dollars horizontally across the three years...
-
Input the IRS Schedules C from the 20132015 income tax returns into a spreadsheet. a. Add percent columns to the right of dollar column for each year. b. Calculate common-sized percentages in the...
-
Go to a business library or university librarian and locate RMA Annual Financial Statement Studies or a similar publication and locate convenience stores and comparable ratios (e.g., cost of goods...

Study smarter with the SolutionInn App