

Project due date: November 8th, 2020 Grading: Budget Sheet - Annual balanced budget Budget Sheet -...
Fantastic news! We've Found the answer you've been seeking!
Question:
Transcribed Image Text:
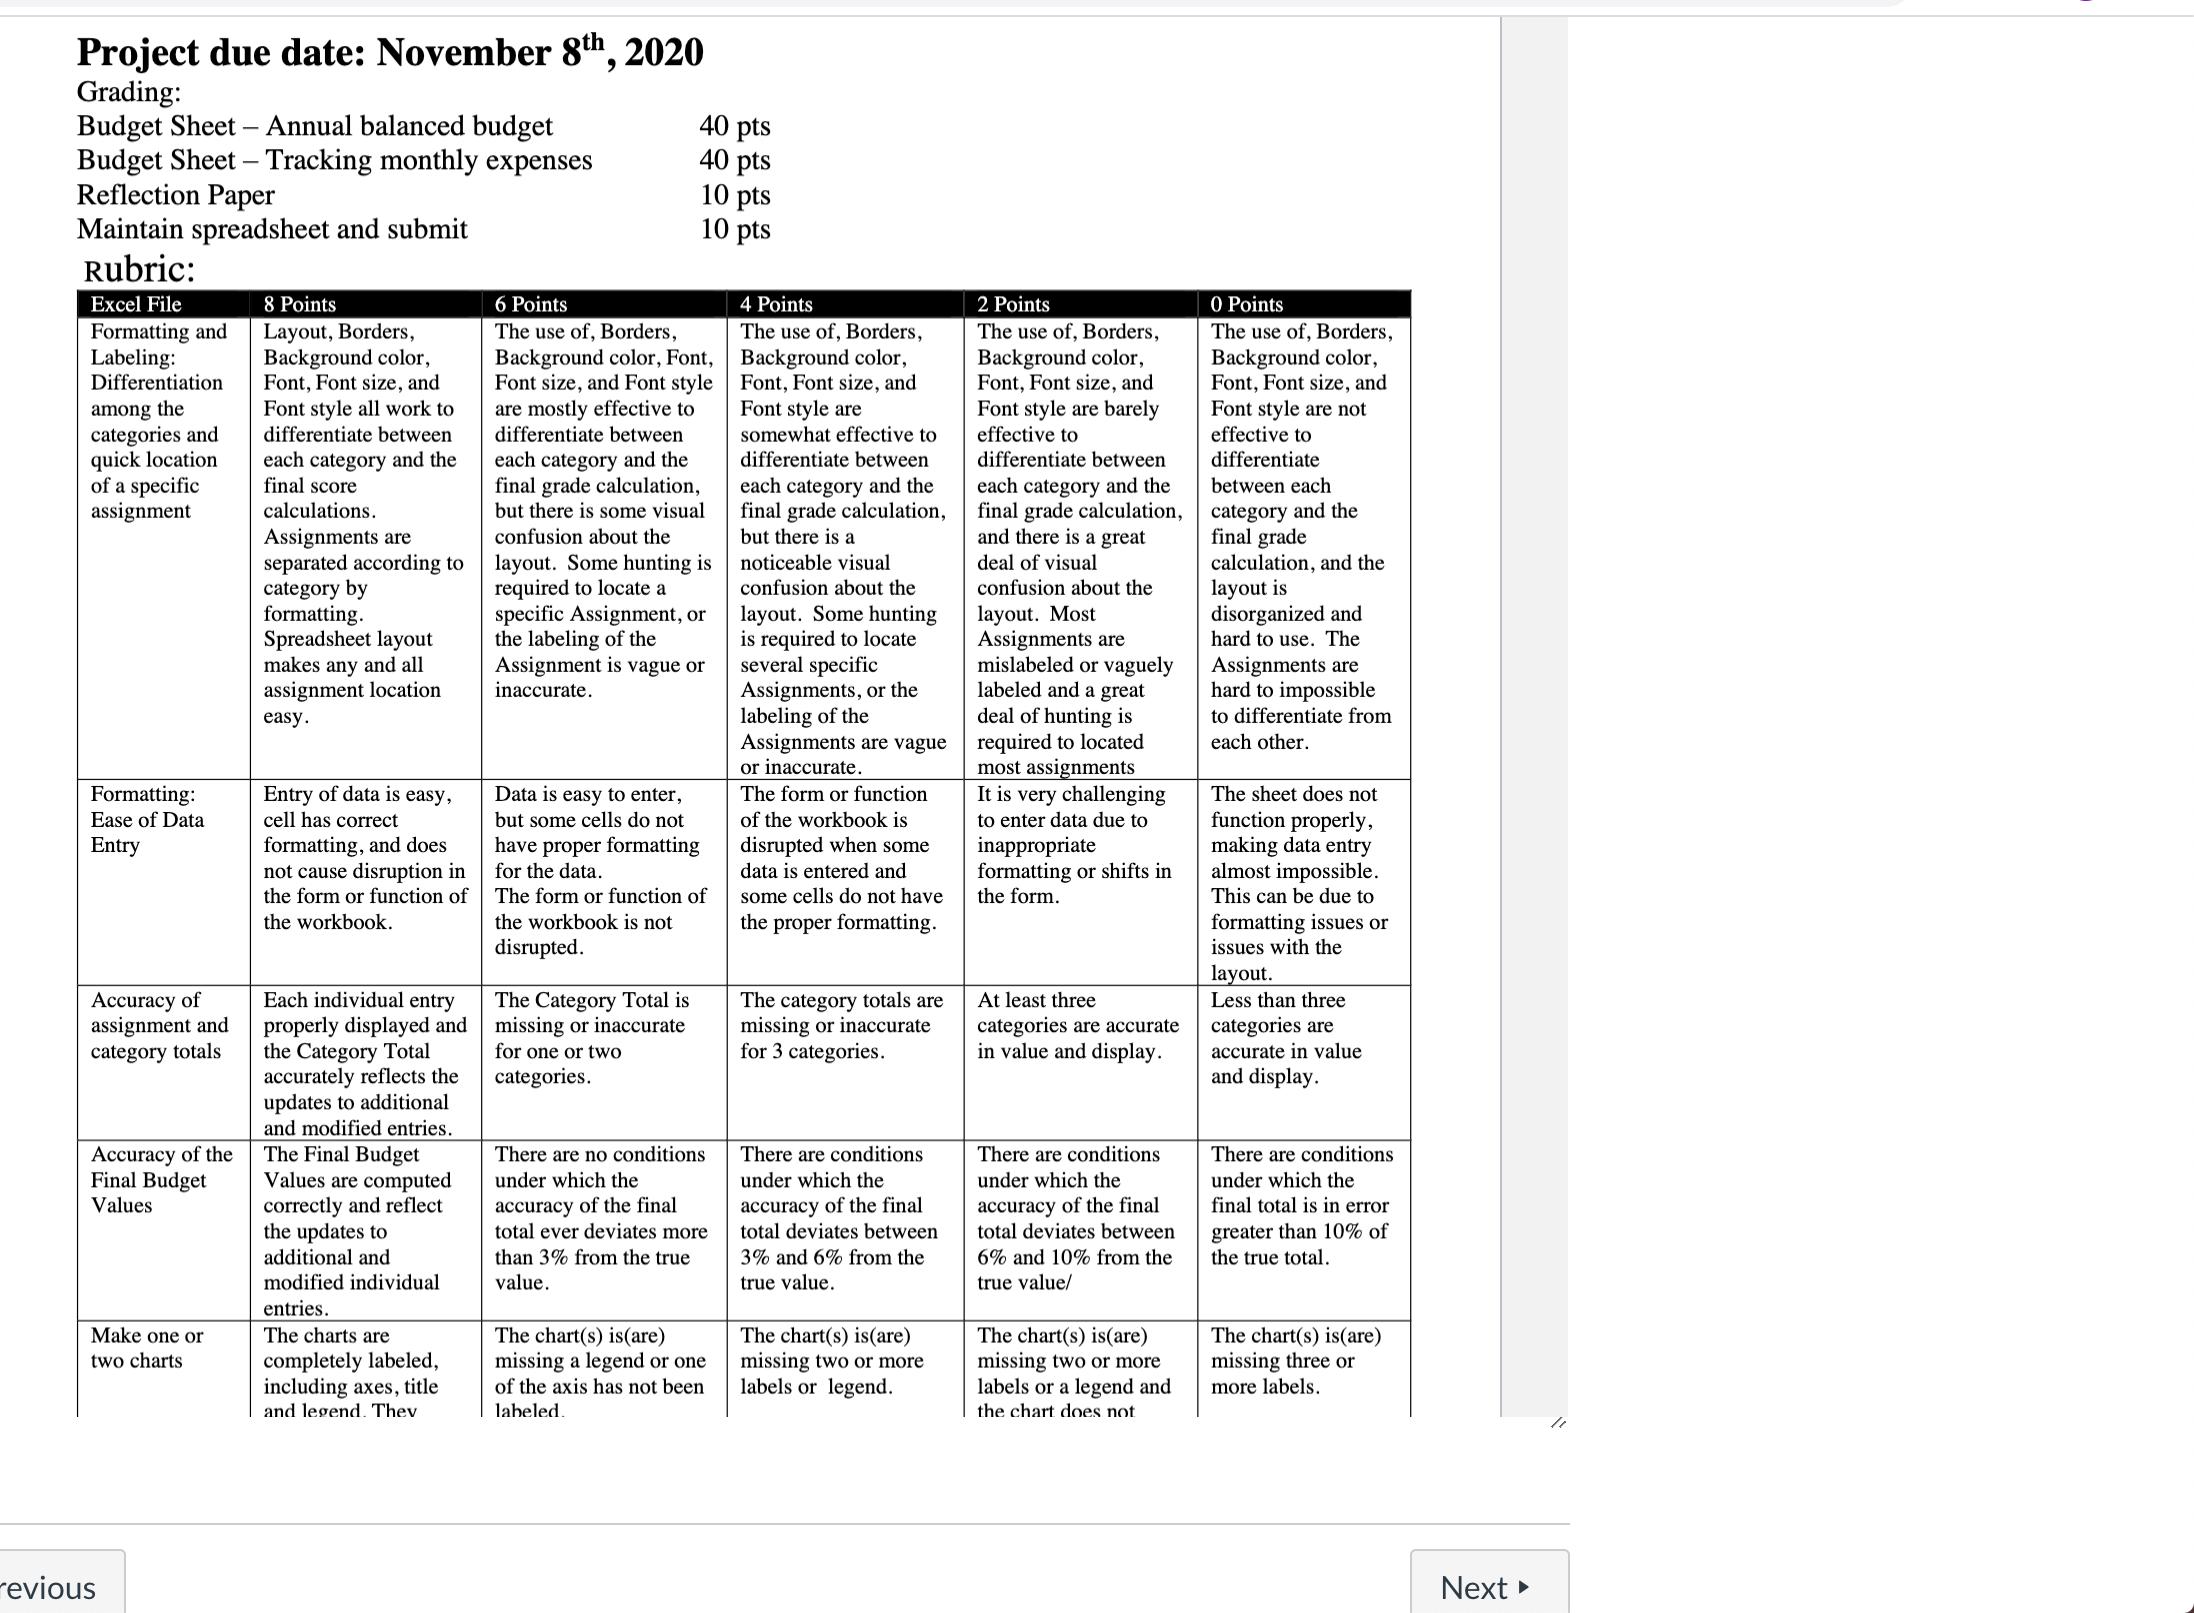
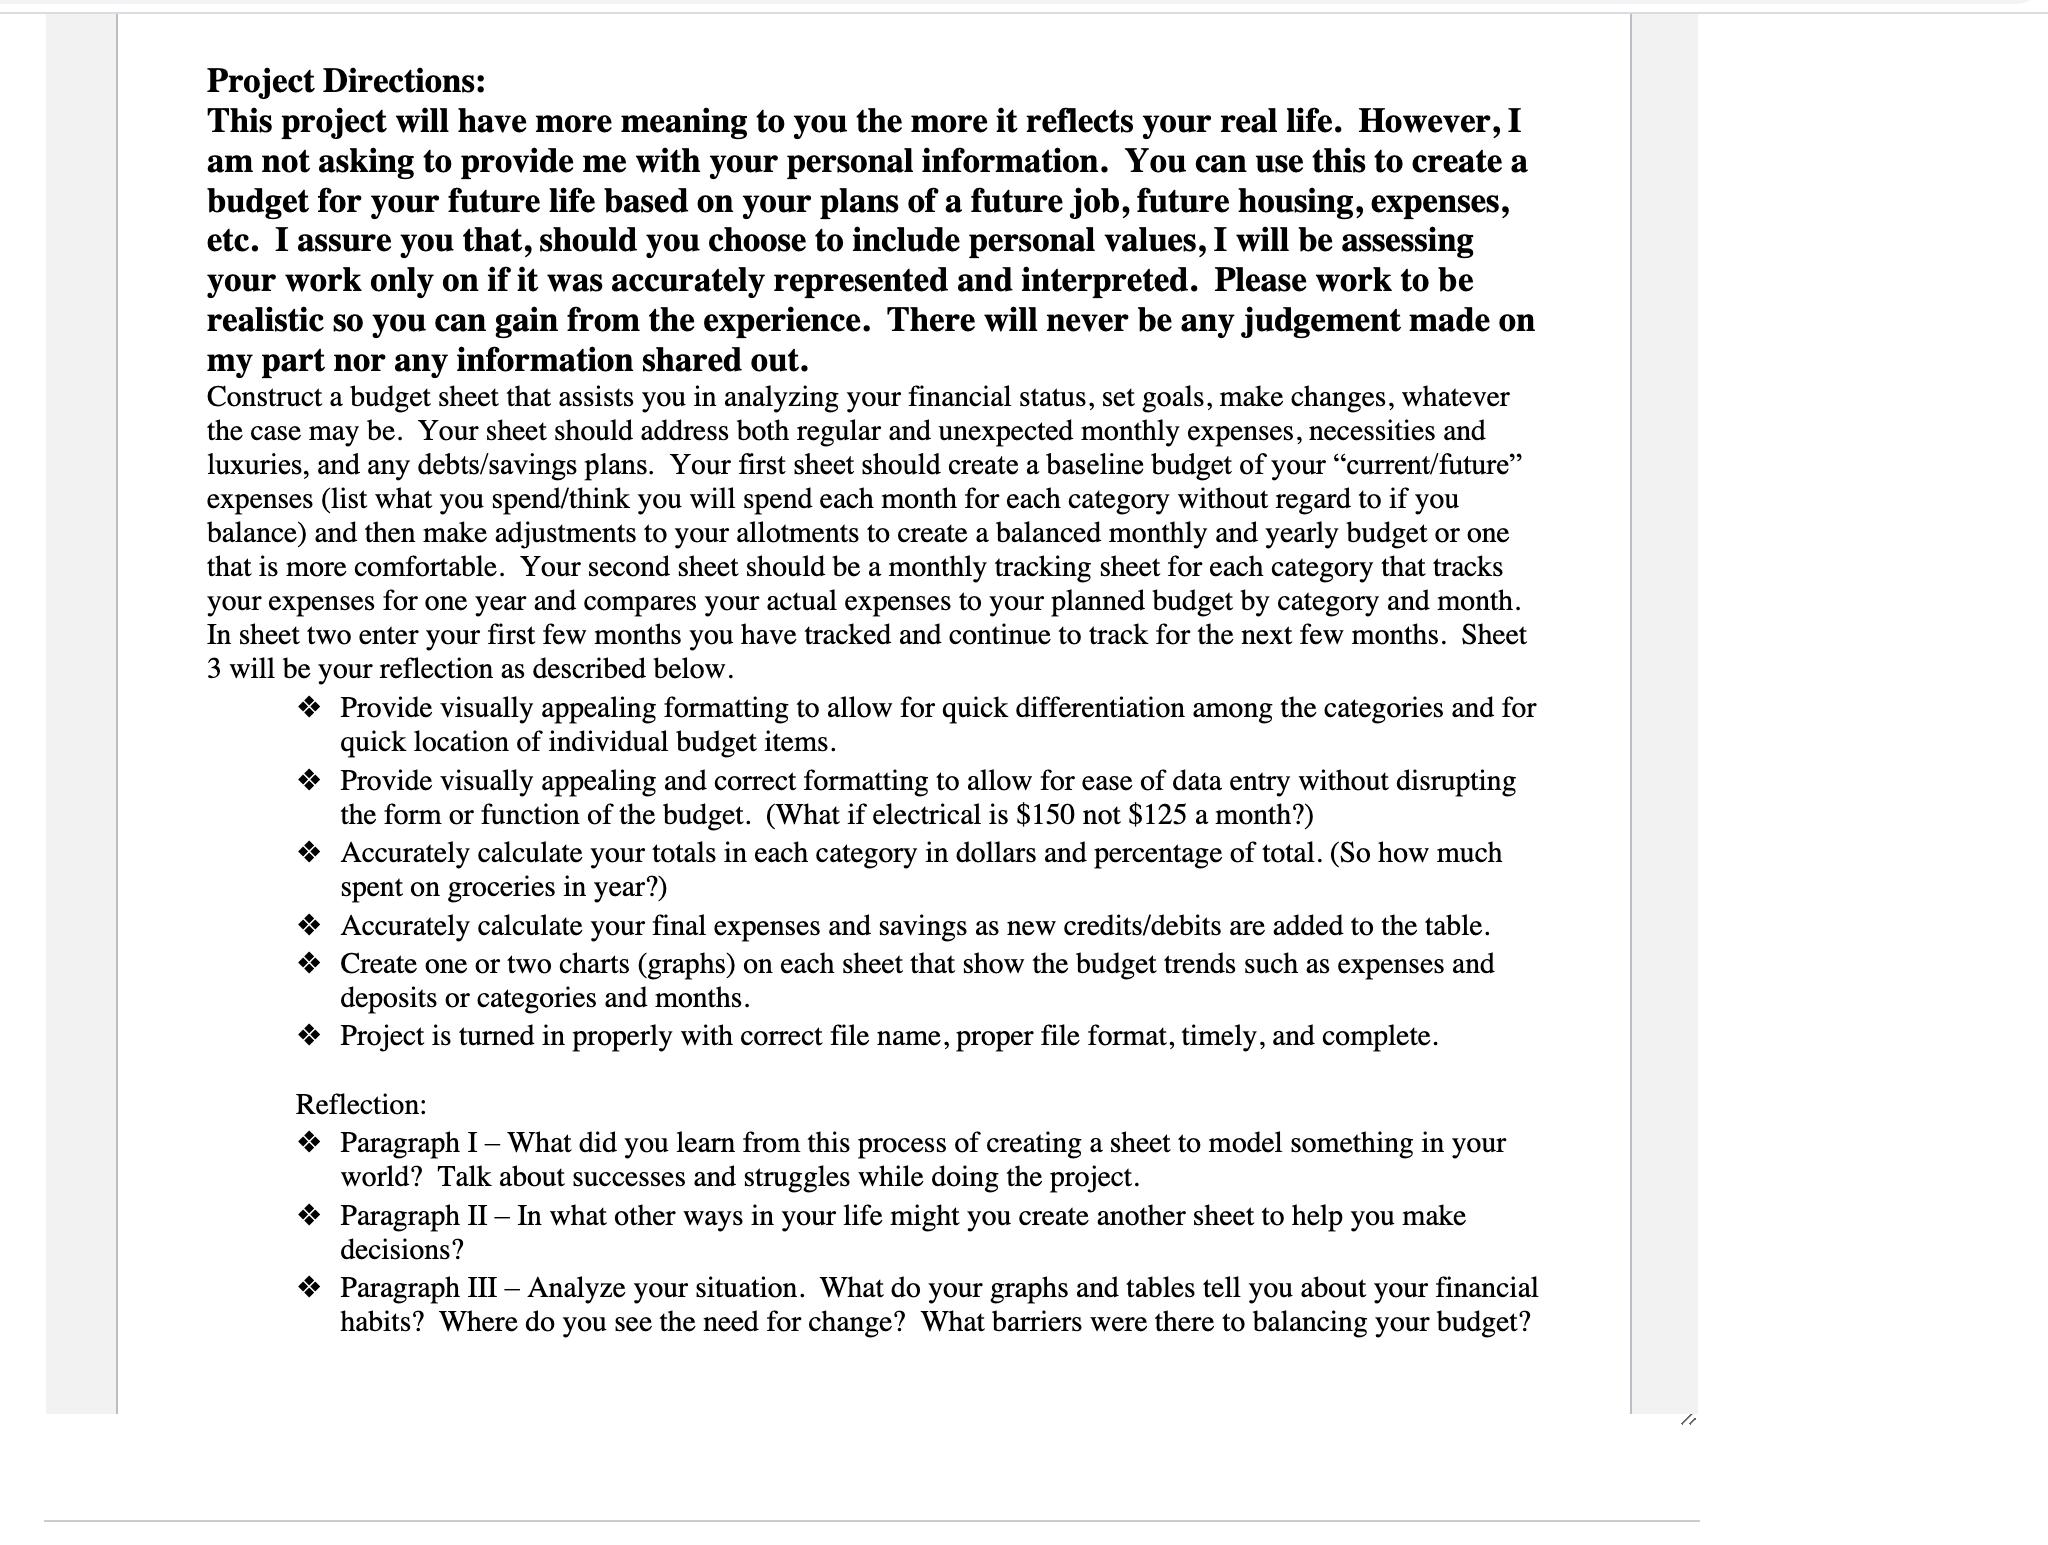
Project due date: November 8th, 2020 Grading: Budget Sheet - Annual balanced budget Budget Sheet - Tracking monthly expenses Reflection Paper Maintain spreadsheet and submit Rubric: Excel File Formatting and Labeling: Differentiation among the categories and quick location of a specific assignment Formatting: Ease of Data Entry Accuracy of assignment and category totals Accuracy of the Final Budget Values Make one or two charts revious 8 Points Layout, Borders, Background color, Font, Font size, and Font style all work to differentiate between each tegory and the final score calculations. Assignments are separated according to category by formatting. Spreadsheet layout makes any and all assignment location easy. Entry of data is easy, cell has correct formatting, and does not cause disruption in the form or function of the workbook. Each individual entry properly displayed and the Category Total accurately reflects the updates to additional and modified entries. The Final Budget Values are computed correctly and reflect the updates to additional and modified individual entries. The charts are completely labeled, including axes, title and legend. They 40 pts 40 pts 10 pts 10 pts 6 Points The use of, Borders, Background color, Font, Font size, and Font style are mostly effective to differentiate between each and the final grade calculation, but there is some visual confusion about the layout. Some hunting is required to locate a specific Assignment, or the labeling of the Assignment is vague or inaccurate. The Category Total is missing or inaccurate for one or two categories. Data is easy to enter, but some cells do not have proper formatting for the data. The form or function of the workbook is not disrupted. There are no conditions under which the accuracy of the final total ever deviates more than 3% from the true value. The chart(s) is (are) missing a legend or one of the axis has not been labeled. 4 Points The use of, Borders, Background color, Font, Font size, and Font style are somewhat effective to differentiate between each category and the final grade calculation, but there is a noticeable visual confusion about the layout. Some hunting is required to locate several specific Assignments, or the labeling of the Assignments are vague or inaccurate. The form or function of the workbook is disrupted when some data is entered and some cells do not have the proper formatting. The category totals are missing or inaccurate for 3 categories. There are conditions under which the accuracy of the final total deviates between 3% and 6% from the true value. The chart(s) is (are) missing two or more labels or legend. 2 Points The use of, Borders, Background color, Font, Font size, and Font style are barely effective to differentiate between each category and the final grade calculation, and there is a great deal of visual confusion about the layout. Most Assignments are mislabeled or vaguely labeled and a great deal of hunting is required to located most assignments It is very challenging to enter data due to inappropriate formatting or shifts in the form. At least three categories are accurate in value and display. There are conditions under which the accuracy of the final total deviates between 6% and 10% from the true value/ The chart(s) is(are) missing two or more labels or a legend and the chart does not 0 Points The use of, Borders, Background color, Font, Font size, and Font style are not effective to differentiate between each category and the final grade calculation, and the layout is disorganized and hard to use. The Assignments are hard to impossible to differentiate from each other. The sheet does not function properly, making data entry almost impossible. This can be due to formatting issues or issues with the layout. Less than three categories are accurate in value and display. There are conditions under which the final total is in error greater than 10% of the true total. The chart(s) is(are) missing three or more labels. Next ► /1 Project Directions: This project will have more meaning to you the more it reflects your real life. However, I am not asking to provide me with your personal information. You can use this to create a budget for your future life based on your plans of a future job, future housing, expenses, etc. I assure you that, should you choose to include personal values, I will be assessing your work only on if it was accurately represented and interpreted. Please work to be realistic so you can gain from the experience. There will never be any judgement made on my part nor any information shared out. Construct a budget sheet that assists you in analyzing your financial status, set goals, make changes, whatever the case may be. Your sheet should address both regular and unexpected monthly expenses, necessities and luxuries, and any debts/savings plans. Your first sheet should create a baseline budget of your "current/future" expenses (list what you spend/think you will spend each month for each category without regard to if you balance) and then make adjustments to your allotments to create a balanced monthly and yearly budget or one that is more comfortable. Your second sheet should be a monthly tracking sheet for each category that tracks your expenses for one year and compares your actual expenses to your planned budget by category and month. In sheet two enter your first few months you have tracked and continue to track for the next few months. Sheet 3 will be your reflection as described below. Provide visually appealing formatting to allow for quick differentiation among the categories and for quick location of individual budget items. ❖ Provide visually appealing and correct formatting to allow for ease of data entry without disrupting the form or function of the budget. (What if electrical is $150 not $125 a month?) Accurately calculate your totals in each category in dollars and percentage of total. (So how much spent on groceries in year?) ❖ Accurately calculate your final expenses and savings as new credits/debits are added to the table. Create one or two charts (graphs) on each sheet that show the budget trends such as expenses and deposits or categories and months. Project is turned in properly with correct file name, proper file format, timely, and complete. Reflection: ❖ Paragraph I-What did you learn from this process of creating a sheet to model something in your world? Talk about successes and struggles while doing the project. ❖ Paragraph II - In what other ways in your life might you create another sheet to help you make decisions? ❖ Paragraph III - Analyze your situation. What do your graphs and tables tell you about your financial habits? Where do you see the need for change? What barriers were there to balancing your budget? 10 Project due date: November 8th, 2020 Grading: Budget Sheet - Annual balanced budget Budget Sheet - Tracking monthly expenses Reflection Paper Maintain spreadsheet and submit Rubric: Excel File Formatting and Labeling: Differentiation among the categories and quick location of a specific assignment Formatting: Ease of Data Entry Accuracy of assignment and category totals Accuracy of the Final Budget Values Make one or two charts revious 8 Points Layout, Borders, Background color, Font, Font size, and Font style all work to differentiate between each tegory and the final score calculations. Assignments are separated according to category by formatting. Spreadsheet layout makes any and all assignment location easy. Entry of data is easy, cell has correct formatting, and does not cause disruption in the form or function of the workbook. Each individual entry properly displayed and the Category Total accurately reflects the updates to additional and modified entries. The Final Budget Values are computed correctly and reflect the updates to additional and modified individual entries. The charts are completely labeled, including axes, title and legend. They 40 pts 40 pts 10 pts 10 pts 6 Points The use of, Borders, Background color, Font, Font size, and Font style are mostly effective to differentiate between each and the final grade calculation, but there is some visual confusion about the layout. Some hunting is required to locate a specific Assignment, or the labeling of the Assignment is vague or inaccurate. The Category Total is missing or inaccurate for one or two categories. Data is easy to enter, but some cells do not have proper formatting for the data. The form or function of the workbook is not disrupted. There are no conditions under which the accuracy of the final total ever deviates more than 3% from the true value. The chart(s) is (are) missing a legend or one of the axis has not been labeled. 4 Points The use of, Borders, Background color, Font, Font size, and Font style are somewhat effective to differentiate between each category and the final grade calculation, but there is a noticeable visual confusion about the layout. Some hunting is required to locate several specific Assignments, or the labeling of the Assignments are vague or inaccurate. The form or function of the workbook is disrupted when some data is entered and some cells do not have the proper formatting. The category totals are missing or inaccurate for 3 categories. There are conditions under which the accuracy of the final total deviates between 3% and 6% from the true value. The chart(s) is (are) missing two or more labels or legend. 2 Points The use of, Borders, Background color, Font, Font size, and Font style are barely effective to differentiate between each category and the final grade calculation, and there is a great deal of visual confusion about the layout. Most Assignments are mislabeled or vaguely labeled and a great deal of hunting is required to located most assignments It is very challenging to enter data due to inappropriate formatting or shifts in the form. At least three categories are accurate in value and display. There are conditions under which the accuracy of the final total deviates between 6% and 10% from the true value/ The chart(s) is(are) missing two or more labels or a legend and the chart does not 0 Points The use of, Borders, Background color, Font, Font size, and Font style are not effective to differentiate between each category and the final grade calculation, and the layout is disorganized and hard to use. The Assignments are hard to impossible to differentiate from each other. The sheet does not function properly, making data entry almost impossible. This can be due to formatting issues or issues with the layout. Less than three categories are accurate in value and display. There are conditions under which the final total is in error greater than 10% of the true total. The chart(s) is(are) missing three or more labels. Next ► /1 Project Directions: This project will have more meaning to you the more it reflects your real life. However, I am not asking to provide me with your personal information. You can use this to create a budget for your future life based on your plans of a future job, future housing, expenses, etc. I assure you that, should you choose to include personal values, I will be assessing your work only on if it was accurately represented and interpreted. Please work to be realistic so you can gain from the experience. There will never be any judgement made on my part nor any information shared out. Construct a budget sheet that assists you in analyzing your financial status, set goals, make changes, whatever the case may be. Your sheet should address both regular and unexpected monthly expenses, necessities and luxuries, and any debts/savings plans. Your first sheet should create a baseline budget of your "current/future" expenses (list what you spend/think you will spend each month for each category without regard to if you balance) and then make adjustments to your allotments to create a balanced monthly and yearly budget or one that is more comfortable. Your second sheet should be a monthly tracking sheet for each category that tracks your expenses for one year and compares your actual expenses to your planned budget by category and month. In sheet two enter your first few months you have tracked and continue to track for the next few months. Sheet 3 will be your reflection as described below. Provide visually appealing formatting to allow for quick differentiation among the categories and for quick location of individual budget items. ❖ Provide visually appealing and correct formatting to allow for ease of data entry without disrupting the form or function of the budget. (What if electrical is $150 not $125 a month?) Accurately calculate your totals in each category in dollars and percentage of total. (So how much spent on groceries in year?) ❖ Accurately calculate your final expenses and savings as new credits/debits are added to the table. Create one or two charts (graphs) on each sheet that show the budget trends such as expenses and deposits or categories and months. Project is turned in properly with correct file name, proper file format, timely, and complete. Reflection: ❖ Paragraph I-What did you learn from this process of creating a sheet to model something in your world? Talk about successes and struggles while doing the project. ❖ Paragraph II - In what other ways in your life might you create another sheet to help you make decisions? ❖ Paragraph III - Analyze your situation. What do your graphs and tables tell you about your financial habits? Where do you see the need for change? What barriers were there to balancing your budget? 10
Expert Answer:
Answer rating: 100% (QA)
Reflection Paragraph I What did you learn from this process of creating a sheet to model something in your world Talk about successes and struggles while doing the project According to the project 2 a ... View the full answer

Related Book For 

Essentials of Business Analytics
ISBN: 978-1305627734
2nd edition
Authors: Jeffrey D. Camm, James J. Cochran, Michael J. Fry, Jeffrey W. Ohlmann, David R. Anderson
Posted Date:
Students also viewed these accounting questions
-
In addition to gross pay, the company must pay 60% of the $50 per employee weekly health insurance; each employee pays the remaining 40%. The company also contributes an extra 5% of each employees...
-
I am working on an accounting project related to a supermarket and would like to seek help with regard to its costing system. I was asked to describe the companys costing system. I have identified a...
-
1 2 The Week worksheet contains data for the week of April 5. In cell D7, insert the appropriate date function to calculate the number of days between the Date Arrived and Date Ordered. Copy the...
-
Inverse permutation. Write a program that reads in a permutation of the integers 0 to n-1 from n command-line arguments and prints the inverse permutation. (If the permutation is in an array a[], its...
-
If banks have a desired reserve ratio of 0.20, there is no currency drain, and Erin deposits $50 of cash in her bank, calculate a. The bank's excess reserves as soon as Erin makes her deposit. b. The...
-
What should be the format and final form of the store managers job description?
-
For many years, hitters have claimed that some baseball pitchers have the ability to actually throw a rising fastball. Assuming that a top major leaguer pitcher can throw a \(95-\mathrm{mph}\) pitch...
-
The trial balance of Ron Salem Co. shown below does not balance. Each of the listed accounts has a normal balance per the general ledger. An examination of the ledger and journal reveals the...
-
This week you will learn about Social Media and the liabilities and risks from a legal perspective. Social media is defined as electronic communication (including the Internet or network systems)...
-
Consider the snapshot of the Linear Hashing index shown in Figure 11.7. Assume that a bucket split occurs whenever an overflow page is created. In figure 11.7 1. What is the maximum number of data...
-
Explain how covid - 19 has had an impact on air Canada.did it temporarily close or not ? what steps did the organization take in terms of managing their employees? have they since reopned ? Have they...
-
Calculate consumption at each level of disposable income. Calculate the marginal propensity to consume. Use the following data for the Australian economy to work Problems Disposable income Saving...
-
The district manager of a chain of 24-hour convenience stores is very concerned about her stores rate of employee theft, which is currently about twice the industry average and rising rapidly....
-
For the steel rigid frame in Figure P8.31, compute the rotation of joint \(B\) and the horizontal displacement of support \(C\). Given: \(E=200 \mathrm{GPa}, A=500 \mathrm{~mm}^{2}\), \(I=200 \times...
-
What are the various types of auditing opinions that can be issued by auditors?
-
O 2 is the customer brand name of Telefonica UK Limited, provider of the second biggest mobile phone network in the UK (the biggest provider is EE, a subsidiary of BT plc). Originally a spin-off...
-
The pin is made of a material having a failure shear stress of tfail = 100 MPa. Determine the minimum required diameter of the pin to the nearest mm. Apply a factor of safety of F.S. = 2.5 against...
-
An annual report of The Campbell Soup Company reported on its income statement $2.4 million as equity in earnings of affiliates. Journalize the entry that Campbell would have made to record this...
-
The Human Resources Manager for Optilytics LLC is evaluating applications for the position of Senior Data Scientist. The le Optilytics LLC presents summary data of the applicants for the position. a....
-
The average annual premium for automobile insurance in the United States is $1,503. The following annual premiums ($) are representative of the web site's findings for the state of Michigan. Assume...
-
As was discussed in the Analytics in Action from Chapter 2, the U.S. Census Bureau is a leading source of quantitative data related to the people and economy of the United States. The cross...
-
Mulberry Ltd has been using the FIFO costing method to account for inventories for several years. The company also has a policy of paying out all of its profits in cash dividends. What are the likely...
-
Burkinshaw Ltd was established on 1 April 2025 and began by issuing 250000 ordinary shares and 1200008% cumulative preference shares. The preference shares were issued privately at a value of \($4\)...
-
The directors of Outback Ltd decided to issue 200 000 ordinary shares. Required (a) Prepare journal entries (in general journal form) to record the issue of shares as a private placement to Rural Ltd...

Study smarter with the SolutionInn App