

Based on the information contained in these financial statements (For Amazon use values for December 31,...
Fantastic news! We've Found the answer you've been seeking!
Question:
Transcribed Image Text:
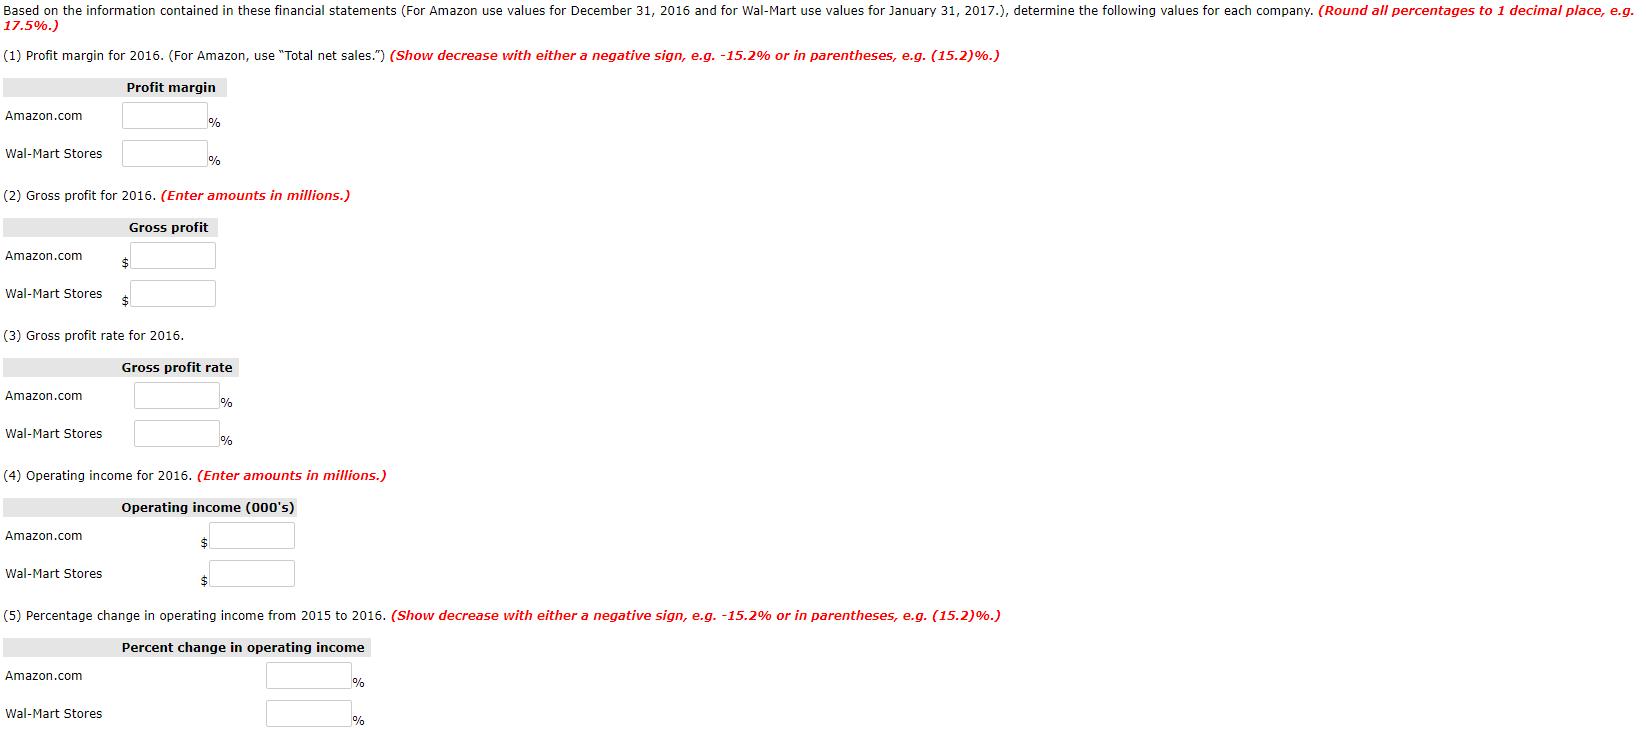
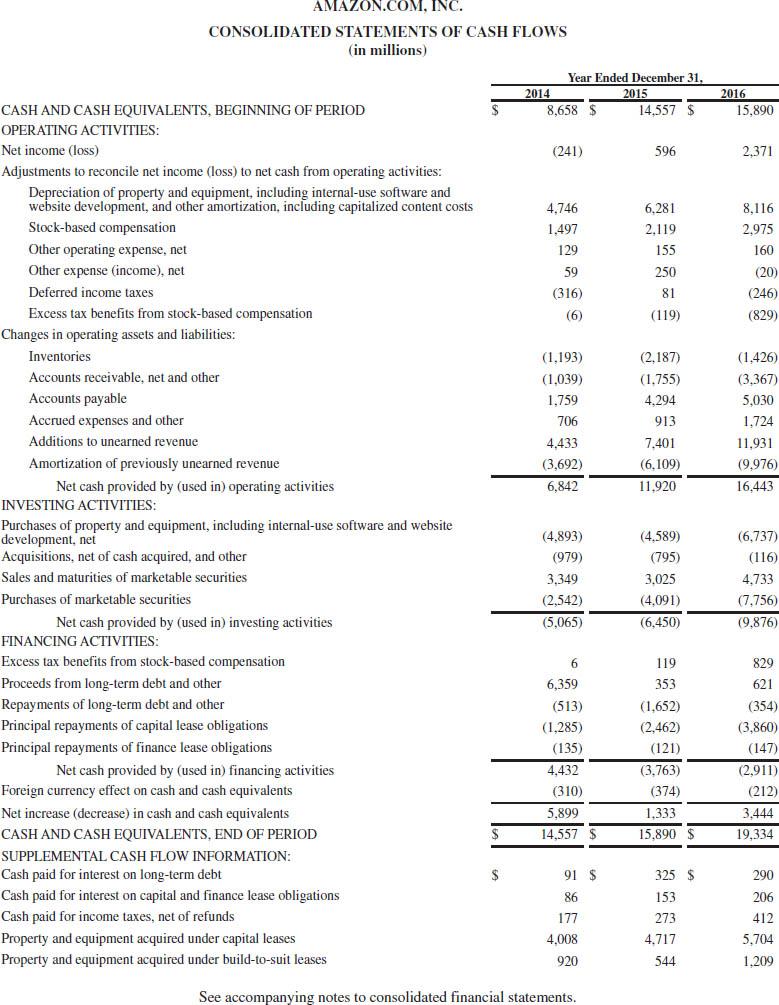
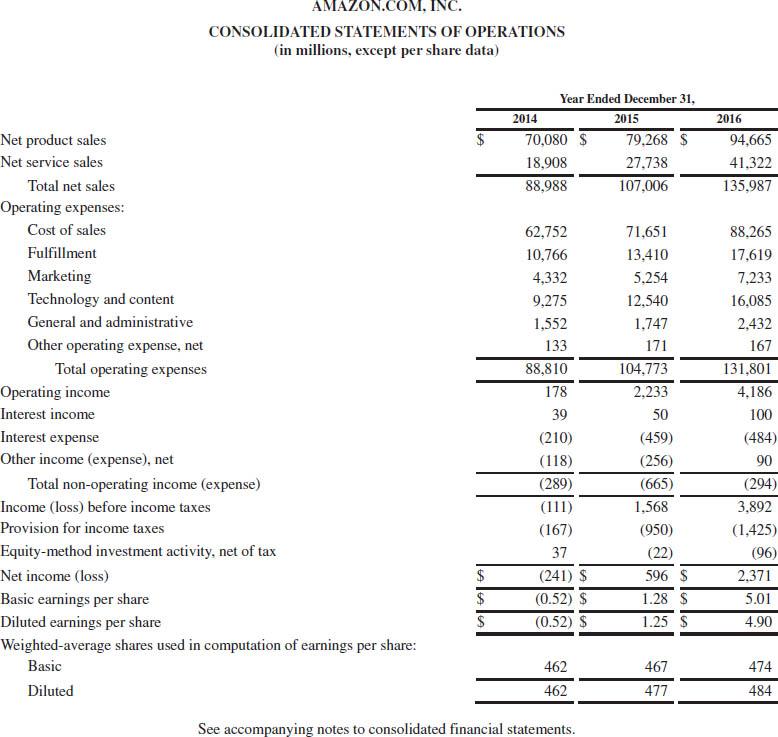
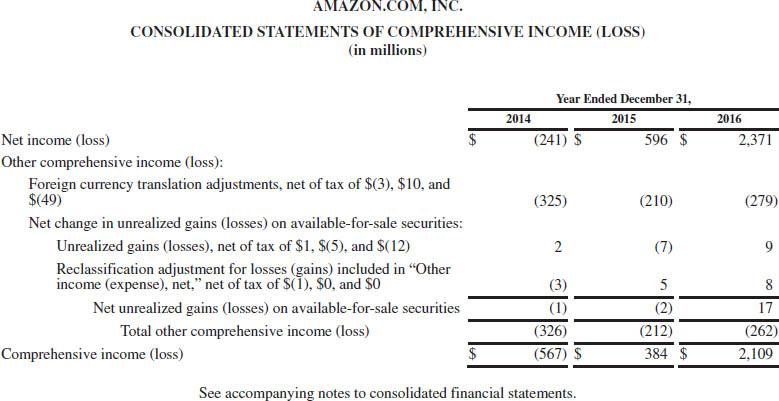
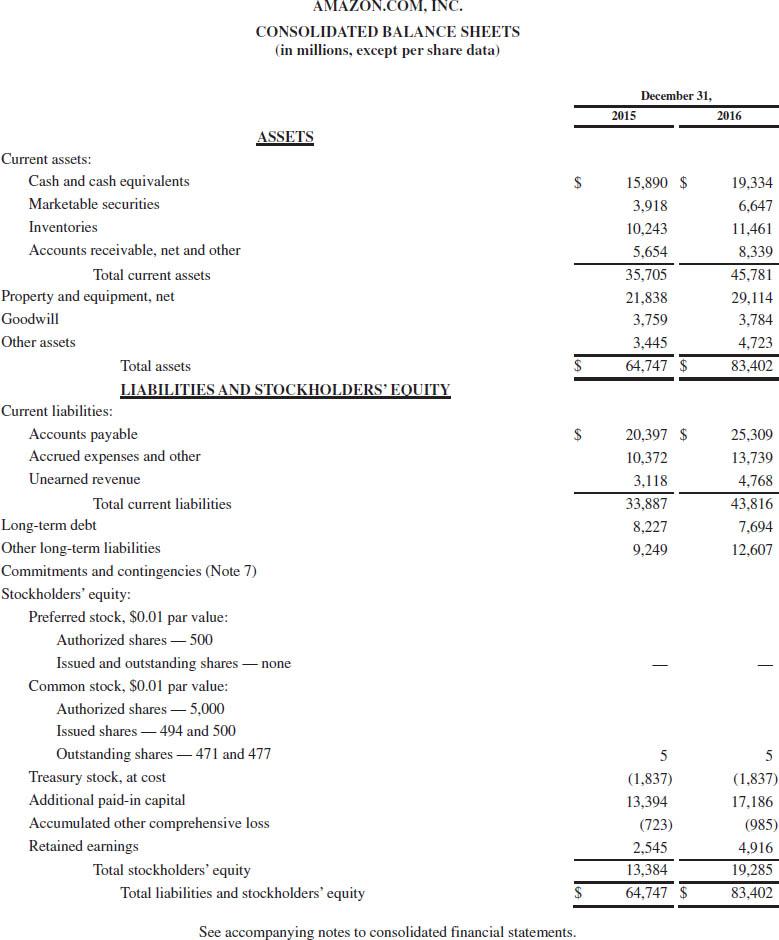
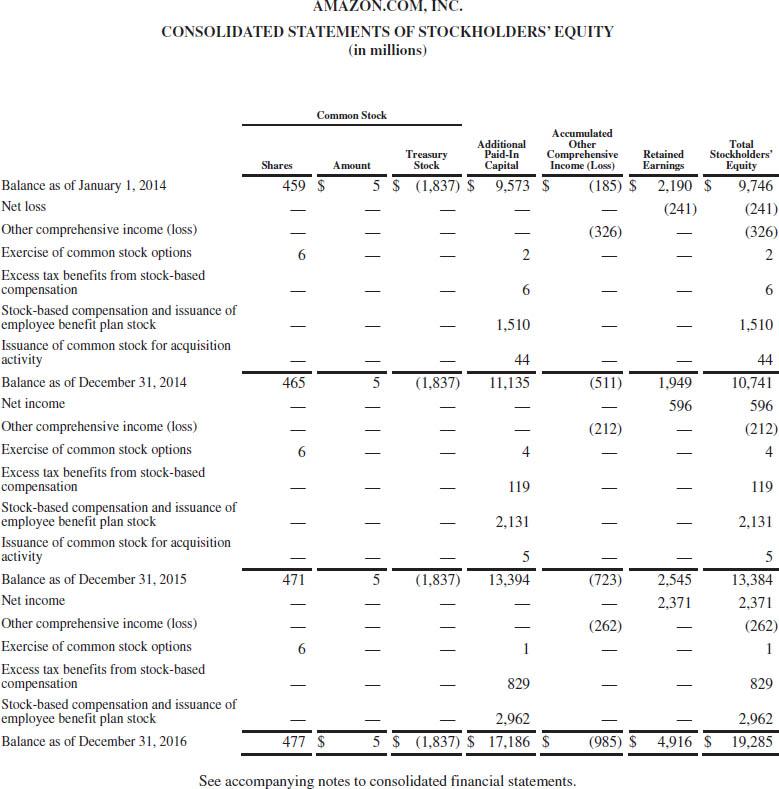
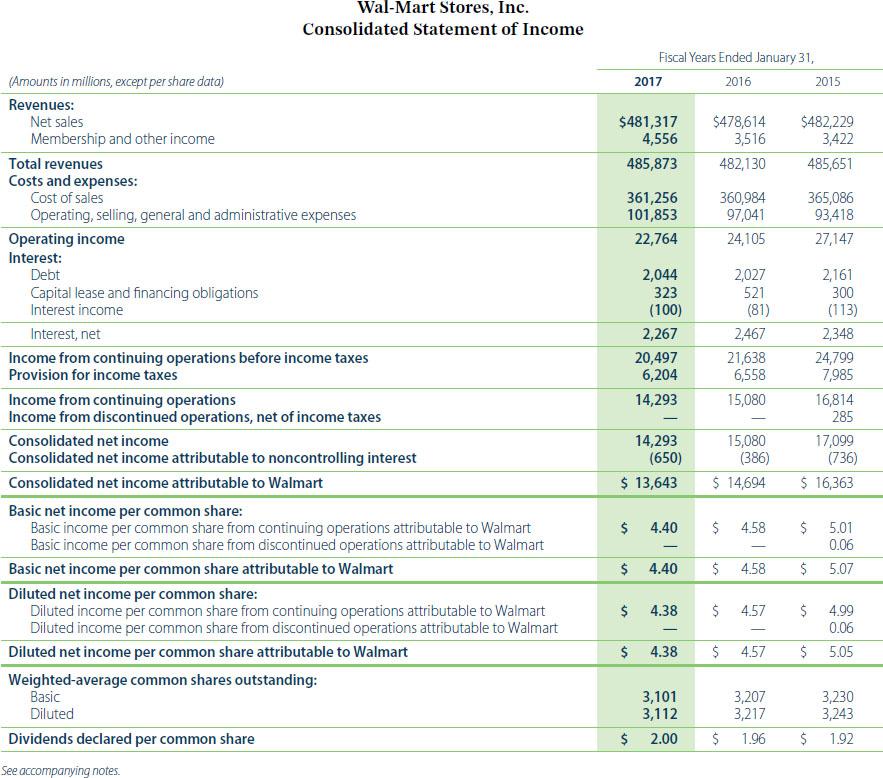
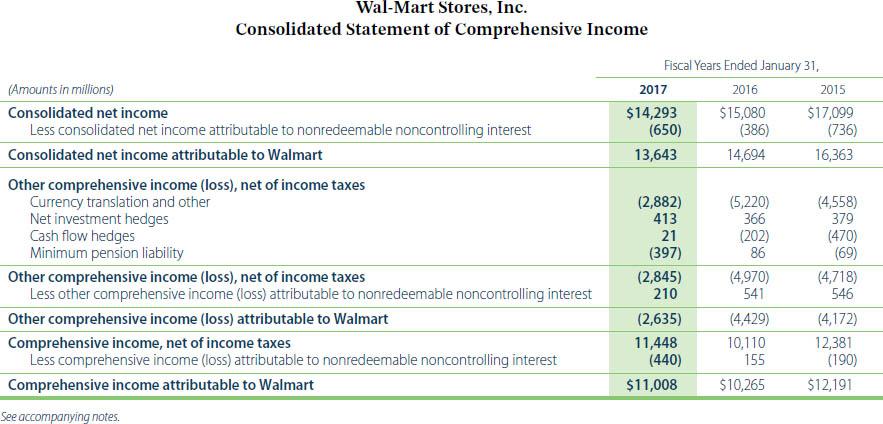
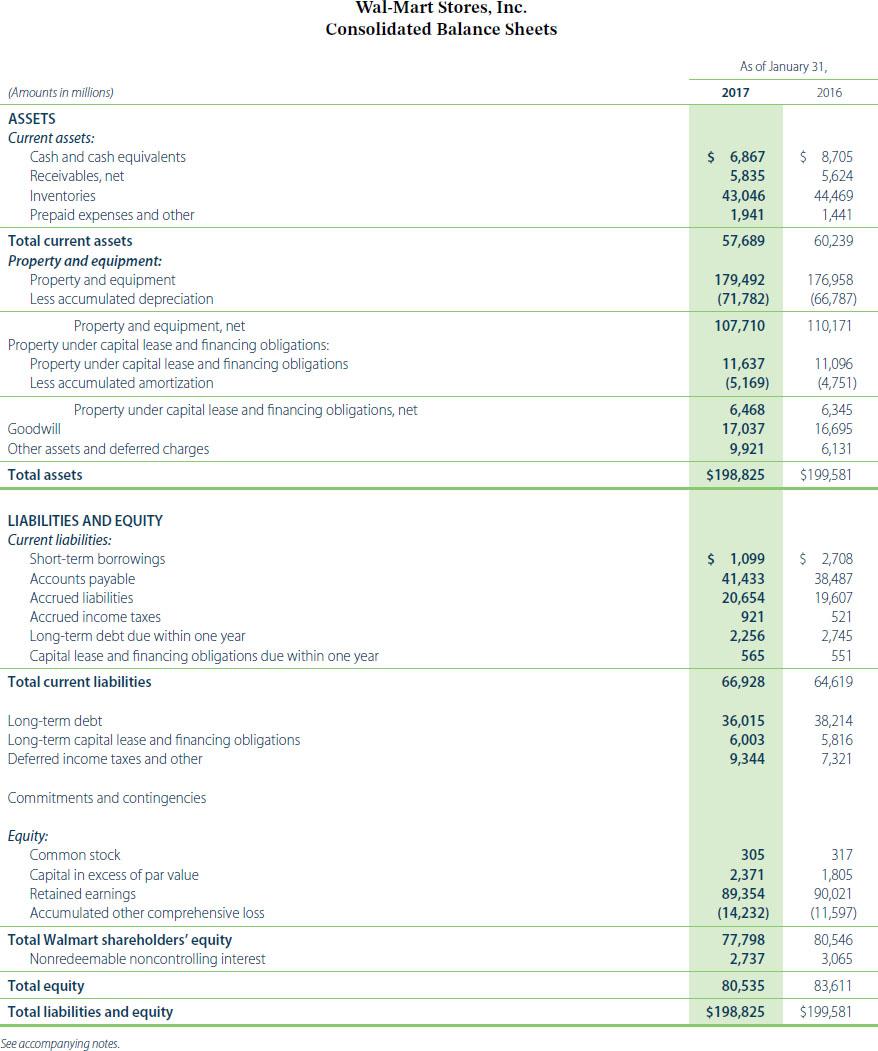
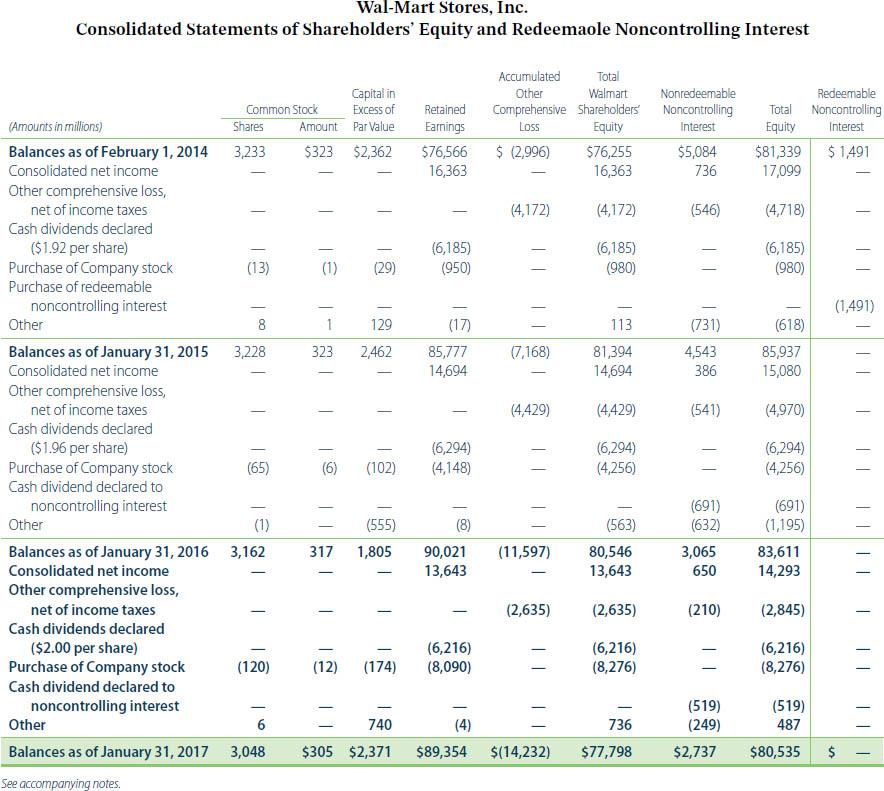
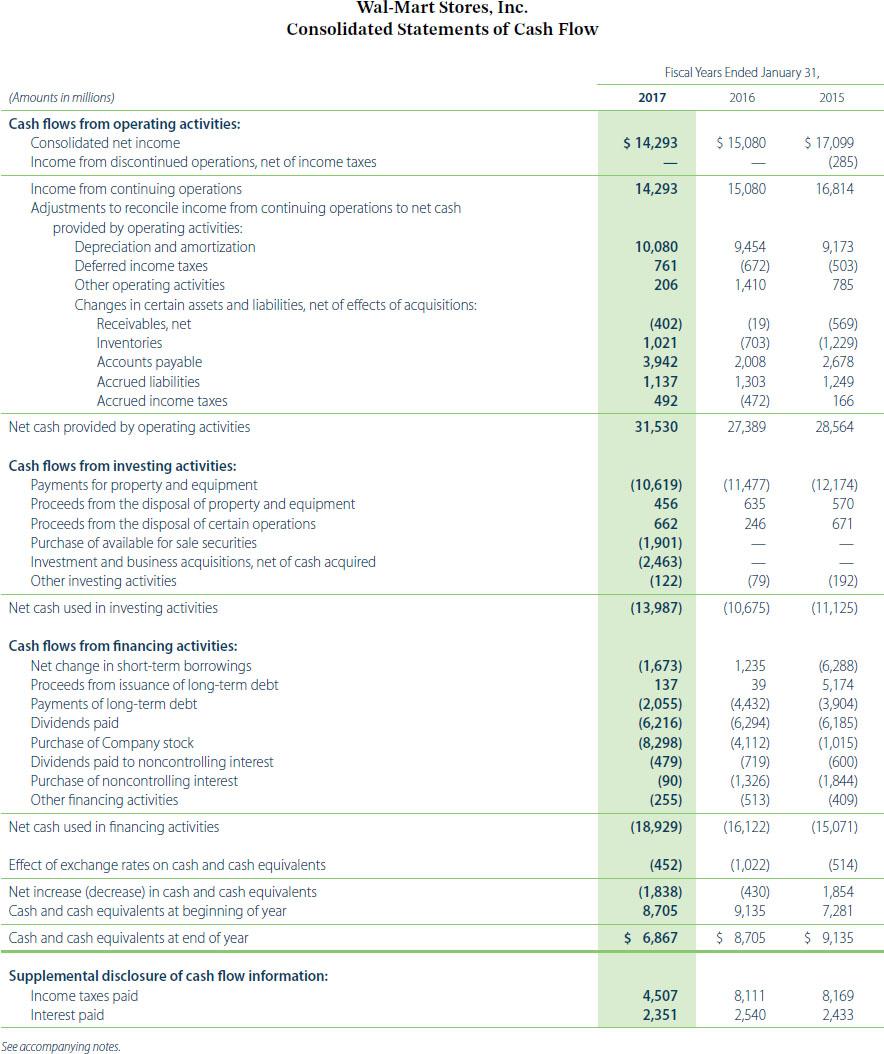
Based on the information contained in these financial statements (For Amazon use values for December 31, 2016 and for Wal-Mart use values for January 31, 2017.), determine the following values for each company. (Round all percentages to 1 decimal place, e.g. 17.5%.) (1) Profit margin for 2016. (For Amazon, use "Total net sales.") (Show decrease with either a negative sign, e.g. -15.2% or in parentheses, e.g. (15.2)%.) Profit margin Amazon.com % Wal-Mart Stores (2) Gross profit for 2016. (Enter amounts in millions.) Gross profit Amazon.com Wal-Mart Stores %24 (3) Gross profit rate for 2016. Gross profit rate Amazon.com Wal-Mart Stores (4) Operating income for 2016. (Enter amounts in millions.) Operating income (000's) Amazon.com 24 Wal-Mart Stores (5) Percentage change in operating income from 2015 to 2016. (Show decrease with either a negative sign, e.g. -15.2% or in parentheses, e.g. (15.2)%.) Percent change in operating income Amazon.com Wal-Mart Stores AMAZON.COM, INC. CONSOLIDATED STATEMENTS OF CASH FLOWS (in millions) Year Ended December 31, 2014 8,658 $ 2016 15,890 2015 CASH AND CASH EQUIVALENTS, BEGINNING OF PERIOD 14,557 S OPERATING ACTIVITIES: Net income (loss) (241) 596 2,371 Adjustments to reconcile net income (loss) to net cash from operating activities: Depreciation of property and equipment, including internal-use software and website development, and other amortization, including capitalized content costs Stock-based compensation 4,746 6,281 8,116 1,497 2,119 2,975 Other operating expense, net 129 155 160 Other expense (income), net 59 250 (20) Deferred income taxes (316) 81 (246) Excess tax benefits from stock-based compensation (6) (119) (829) Changes in operating assets and liabilities: Inventories (1,193) (2,187) (1,426) Accounts receivable, net and other (1,039) (1,755) (3,367) Accounts payable 1,759 4,294 5,030 Accrued expenses and other 706 913 1,724 Additions to unearned revenue 4,433 7,401 11,931 Amortization of previously unearned revenue (3,692) (6,109) (9,976) Net cash provided by (used in) operating activities 6,842 11,920 16,443 INVESTING ACTIVITIES: Purchases of property and equipment, including internal-use software and website development, net Acquisitions, net of cash acquired, and other (4,893) (4,589) (6,737) (979) (795) (116) Sales and maturities of marketable securities 3,349 3,025 4,733 Purchases of marketable securities (2,542) (4,091) (7,756) Net cash provided by (used in) investing activities (5,065) (6,450) (9,876) FINANCING ACTIVITIES: Excess tax benefits from stock-based compensation 6. 119 829 Proceeds from long-term debt and other 6,359 353 621 Repayments of long-term debt and other (513) (1,652) (354) Principal repayments of capital lease obligations (1,285) (2,462) (3,860) Principal repayments of finance lease obligations (135) (121) (147) Net cash provided by (used in) financing activities 4,432 (3,763) (2,911) Foreign currency effect on cash and cash equivalents (310) (374) (212) Net increase (decrease) in cash and cash equivalents 5,899 1,333 3,444 CASH AND CASH EQUIVALENTS, END OF PERIOD 2$ 14,557 15,890 $ 19,334 SUPPLEMENTAL CASH FLOWW INFORMATION: Cash paid for rest on long-term debt 91 $ 325 290 Cash paid for interest on capital and finance lease obligations 86 153 206 Cash paid for income taxes, net of refunds 177 273 412 Property and equipment acquired under capital leases 4,008 4,717 5,704 Property and equipment acquired under build-to-suit leases 920 544 1.209 See accompanying notes to consolidated financial statements. AMAZON.COM, INC. CONSOLIDATED STATEMENTS OF OPERATIONS (in millions, except per share data) Year Ended December 31, 2014 2015 2016 Net product sales 70,080 $ 79,268 $ 94,665 Net service sales 18,908 27,738 41,322 Total net sales 88,988 107,006 135,987 Operating expenses: Cost of sales 62,752 71,651 88,265 Fulfillment 10,766 13,410 17,619 Marketing 4,332 5,254 7,233 Technology and content 9,275 12,540 16,085 General and administrative 1,552 1,747 2,432 Other operating expense, net 133 171 167 Total operating expenses 88,810 104,773 131,801 Operating income 178 2,233 4,186 Interest income 39 50 100 Interest expense (210) (459) (484) Other income (expense), net (118) (256) 90 Total non-operating income (expense) (289) (665) (294) Income (loss) before income taxes (111) 1,568 3,892 Provision for income taxes (167) (950) (1,425) Equity-method investment activity, net of tax 37 (22) (96) Net income (loss) $ (241) $ 596 $ 2,371 Basic earnings per share 2$ (0.52) $ 1.28 $ 5.01 Diluted earnings per share (0.52) $ 1.25 $ 4.90 Weighted-average shares used in computation of earnings per share: Basic 462 467 474 Diluted 462 477 484 See accompanying notes to consolidated financial statements. AMAZON.COM, INC. CONSOLIDATED STATEMENTS OF COMPREHENSIVE INCOME (LOSS) (in millions) Year Ended December 31, 2014 2015 2016 Net income (loss) (241) $ 596 $ 2,371 Other comprehensive income (loss): Foreign currency translation adjustments, net of tax of $(3), $10, and $(49) (325) (210) (279) Net change in unrealized gains (losses) on available-for-sale securities: Unrealized gains (losses), net of tax of $1, $(5), and $(12) (7) Reclassification adjustment for losses (gains) included in "Other income (expense), net," net of tax of $ČÏ), SÓ, and $0 (3) 5 8. Net unrealized gains (losses) on available-for-sale securities (1) (2) 17 Total other comprehensive income (loss) (326) (212) (262) Comprehensive income (loss) (567) $ 384 $ 2,109 See accompanying notes to consolidated financial statements. AMAZON.COM, INC. CONSOLIDATED BALANCE SHEETS (in millions, except per share data) December 31, 2015 2016 ASSETS Current assets: Cash and cash equivalents 2$ 15,890 $ 19,334 Marketable securities 3,918 6,647 Inventories 10,243 11,461 Accounts receivable, net and other 5,654 8,339 Total current assets 35,705 45,781 Property and equipment, net 21,838 29,114 Goodwill 3,759 3,784 Other assets 3,445 4,723 Total assets 2$ 64,747 $ 83,402 LIABILITIES AND STOCKHOLDERS' EQUITY Current liabilities: Accounts payable 2$ 20,397 $ 25,309 Accrued expenses and other 10,372 13,739 Unearned revenue 3,118 4,768 Total current liabilities 33,887 43,816 Long-term debt 8,227 7,694 Other long-term liabilities 9,249 12,607 Commitments and contingencies (Note 7) Stockholders' equity: Preferred stock, $0.01 par value: Authorized shares - 500 Issued and outstanding shares - none Common stock, $0.01 par value: Authorized shares - 5,000 Issued shares – 494 and 500 Outstanding shares -471 and 477 5 5 Treasury stock, at cost (1,837) (1,837) Additional paid-in capital Accumulated other comprehensive loss 13,394 17,186 (723) (985) Retained earnings 2,545 4,916 Total stockholders' equity 13,384 19,285 Total liabilities and stockholders' equity $ 64,747 $ 83,402 See accompanying notes to consolidated financial statements. | AMAZON.COM, INC. CONSOLIDATED STATEMENTS OF STOCKHOLDERS' EQUITY (in millions) Common Stock Additional Paid-In Capital Accumulated Other Comprehensive Income (Loss) Total Stockholders Equity Treasury Stock Retained Earnings Shares Amount Balance as of January 1, 2014 459 $ 5 S (1,837) $ 9,573 $ (185) $ 2,190 $ 9,746 Net loss (241) (241) - Other comprehensive income (loss) (326) (326) | Exercise of common stock options 2 - Excess tax benefits from stock-based compensation 6. Stock-based compensation and issuance of employee benefit plan stock Issuance of common stock for acquisition activity 1,510 1,510 44 44 Balance as of December 31, 2014 465 (1,837) 11,135 (511) 1,949 10,741 Net income 596 596 - Other comprehensive income (loss) (212) (212) Exercise of common stock options 6 4 4 Excess tax benefits from stock-based compensation 119 119 Stock-based compensation and issuance of employee benefit plan stock 2,131 2,131 Issuance of common stock for acquisition activity 5 5 Balance as of December 31, 2015 471 (1,837) 13,394 (723) 2,545 13,384 Net income 2,371 2,371 - Other comprehensive income (loss) (262) (262) | | Exercise of common stock options 1 1 Excess tax benefits from stock-based compensation 829 829 Stock-based compensation and issuance of employee benefit plan stock 2,962 2,962 Balance as of December 31, 2016 477 $ 5 $ (1,837) $ 17,186 S (985) $ 4,916 $ 19,285 See accompanying notes to consolidated financial statements. Wal-Mart Stores, Inc. Consolidated Statement of Income Fiscal Years Ended January 31, (Amounts in millions, except per share data) 2017 2016 2015 Revenues: $478,614 3,516 $482,229 3,422 Net sales $481,317 4,556 Membership and other income Total revenues 485,873 482,130 485,651 Costs and expenses: Cost of sales 361,256 101,853 360,984 97,041 365,086 93,418 Operating, selling, general and administrative expenses Operating income 22,764 24,105 27,147 Interest: Debt 2,044 2,027 2,161 Capital lease and financing obligations Interest income 323 521 300 (100) (81) (113) Interest, net 2,267 2,467 2,348 Income from continuing operations before income taxes Provision for income taxes 20,497 6,204 21,638 6,558 24,799 7,985 Income from continuing operations Income from discontinued operations, net of income taxes 15,080 16,814 285 14,293 15,080 (386) Consolidated net income 14,293 (650) 17,099 (736) Consolidated net income attributable to noncontrolling interest Consolidated net income attributable to Walmart $ 13,643 $ 14,694 $ 16,363 Basic net income per common share: Basic income per common share from continuing operations attributable to Walmart Basic income per common share from discontinued operations attributable to Walmart 4.40 4.58 5.01 0.06 | Basic net income per common share attributable to Walmart $ 4.40 4.58 5.07 Diluted net income per common share: Diluted income per common share from continuing operations attributable to Walmart Diluted income per common share from discontinued operations attributable to Walmart 4.38 4.57 4.99 0.06 Diluted net income per common share attributable to Walmart $ 4.38 $ 4.57 $ 5.05 Weighted-average common shares outstanding: Basic Diluted 3,101 3,112 3,207 3,217 3,230 3,243 Dividends declared per common share 2.00 1.96 1.92 See accompanying notes. is %24 %24 %24 %24 %24 Wal-Mart Stores, Inc. Consolidated Statement of Comprehensive Income Fiscal Years Ended January 31, (Amounts in millions) 2017 2016 2015 $15,080 (386) $17,099 (736) Consolidated net income $14,293 (650) Less consolidated net income attributable to nonredeemable noncontrolling interest Consolidated net income attributable to Walmart 13,643 14,694 16,363 Other comprehensive income (loss), net of income taxes Currency translation and other Net investment hedges Cash flow hedges Minimum pension liability (2,882) 413 (5,220) 366 (4,558) 379 21 (202) 86 (470) (69) (397) Other comprehensive income (loss), net of income taxes Less other comprehensive income (loss) attributable to nonredeemable noncontrolling interest (2,845) 210 (4,970) 541 (4,718) 546 Other comprehensive income (loss) attributable to Walmart (2,635) (4,429) (4,172) Comprehensive income, net of income taxes Less comprehensive income (loss) attributable to nonredeemable noncontrolling interest 11,448 (440) 10,110 155 12,381 (190) Comprehensive income attributable to Walmart $11,008 $10,265 $12,191 See accompanying notes. Wal-Mart Stores, Inc. Consolidated Balance Sheets As of January 31, (Amounts in millions) 2017 2016 ASSETS Current assets: $ 6,867 5,835 43,046 $ 8,705 Cash and cash equivalents Receivables, net 5,624 44,469 Inventories Prepaid expenses and other 1,941 1,441 Total current assets 57,689 60,239 Property and equipment: Property and equipment Less accumulated depreciation 179,492 (71,782) 176,958 (66,787) 107,710 Property and equipment, net Property under capital lease and financing obligations: Property under capital lease and financing obligations 110,171 11,637 (5,169) 11,096 (4,751) Less accumulated amortization Property under capital lease and financing obligations, net 6,468 17,037 6,345 16,695 Goodwill Other assets and deferred charges 9,921 6,131 Total assets $198,825 $199,581 LIABILITIES AND EQUITY Current liabilities: Short-term borrowings Accounts payable $ 1,099 41,433 20,654 $ 2,708 38,487 19,607 Accrued liabilities Accrued income taxes 921 521 2,256 2,745 Long-term debt due within one year Capital lease and financing obligations due within one year 565 551 Total current liabilities 66,928 64,619 Long-term debt Long-term capital lease and financing obligations 36,015 6,003 9,344 38,214 5,816 7,321 Deferred income taxes and other Commitments and contingencies Equity: Common stock 305 317 Capital in excess of par value Retained earnings 2,371 89,354 1,805 90,021 (11,597) Accumulated other comprehensive loss (14,232) Total Walmart shareholders' equity Nonredeemable noncontrolling interest 77,798 2,737 80,546 3,065 Total equity 80,535 83,611 Total liabilities and equity $198,825 $199,581 See accompanying notes. Wal-Mart Stores, Inc. Consolidated Statements of Shareholders' Equity and Redeemaole Noncontrolling Interest Accumulated Total Capital in Excess of Amount Par Value Redeemable Total Noncontrolling Other Walmart Nonredeemable Common Stock Retained Comprehensive Shareholders Noncontrlling Equity (Amounts in millions) Shares Earnings Loss Interest Equity Interest $323 $2,362 $76,566 16,363 $ (2,996) $76,255 16,363 $ 1,491 $5,084 Balances as of February 1, 2014 Consolidated net income $81,339 17,099 3,233 736 Other comprehensive loss, net of income taxes (4,172) (4,172) (546) (4,718) Cash dividends declared ($1.92 per share) Purchase of Company stock (6,185) (6,185) (980) (6,185) (13) (1) (29) (950) (980) Purchase of redeemable noncontrolling interest (1,491) | Other 8 1 129 (17) 113 (731) (618) Balances as of January 31, 2015 3,228 2,462 81,394 14,694 323 4,543 85,777 14,694 (7,168) 85,937 15,080 Consolidated net income 386 Other comprehensive loss, net of income taxes (4,429) (4,429) (541) (4,970) Cash dividends declared ($1.96 per share) Purchase of Company stock Cash dividend declared to (6,294) (6,294) (6,294) (65) (6) (102) (4,148) (4,256) (4,256) noncontrolling interest (691) (632) (691) (1,195) Other (1) (555) (8) (563) Balances as of January 31, 2016 3,162 Consolidated net income 317 1,805 90,021 13,643 (11,597) 80,546 13,643 3,065 83,611 14,293 650 Other comprehensive loss, net of income taxes (2,635) (2,635) (210) (2,845) Cash dividends declared ($2.00 per share) Purchase of Company stock (6,216) (8,090) (6,216) (8,276) (6,216) (8,276) (120) (12) (174) Cash dividend declared to (519) 487 noncontrolling interest (519) (249) | | Other 6 740 (4) 736 Balances as of January 31, 2017 3,048 $305 $2,371 $89,354 $(14,232) $77,798 $2,737 $80,535 2$ See accompanying notes. Wal-Mart Stores, Inc. Consolidated Statements of Cash Flow Fiscal Years Ended January 31, (Amounts in millions) 2017 2016 2015 Cash flows from operating activities: $ 14,293 $ 15,080 $ 17,099 (285) Consolidated net income Income from discontinued operations, net of income taxes Income from continuing operations Adjustments to reconcile income from continuing operations to net cash provided by operating activities: Depreciation and amortization 14,293 15,080 16,814 9,454 (672) 1,410 9,173 (503) 10,080 Deferred income taxes 761 Other operating activities Changes in certain assets and liabilities, net of effects of acquisitions: Receivables, net 206 785 (402) 1,021 3,942 (19) (703) 2,008 (569) Inventories (1,229) 2,678 Accounts payable Accrued liabilities 1,137 1,303 (472) 1,249 Accrued income taxes 492 166 Net cash provided by operating activities 31,530 27,389 28,564 Cash flows from investing activities: Payments for property and equipment Proceeds from the disposal of property and equipment Proceeds from the disposal of certain operations (10,619) (11,477) (12,174) 456 635 570 662 246 671 (1,901) (2,463) (122) Purchase of available for sale securities Investment and business acquisitions, net of cash acquired Other investing activities (79) (192) Net cash used in investing activities (13,987) (10,675) (11,125) Cash flows from financing activities: Net change in short-term borrowings Proceeds from issuance of long-term debt Payments of long-term debt Dividends paid Purchase of Company stock Dividends paid to noncontrolling interest Purchase of noncontrolling interest Other financing activities (6,288) 5,174 (3,904) (6,185) (1,673) 1,235 137 39 (2,055) (6,216) (8,298) (479) (90) (4,432) (6,294) (4,112) (719) (1,326) (1,015) (600) (1,844) (409) (255) (513) Net cash used in financing activities (18,929) (16,122) (15,071) Effect of exchange rates on cash and cash equivalents (452) (1,022) (514) Net increase (decrease) in cash and cash equivalents Cash and cash equivalents at beginning of year (1,838) 8,705 (430) 9,135 1,854 7,281 Cash and cash equivalents at end of year $ 6,867 $ 8,705 $ 9,135 Supplemental disclosure of cash flow information: Income taxes paid Interest paid 4,507 2,351 8,111 2,540 8,169 2,433 See accompanying notes. Based on the information contained in these financial statements (For Amazon use values for December 31, 2016 and for Wal-Mart use values for January 31, 2017.), determine the following values for each company. (Round all percentages to 1 decimal place, e.g. 17.5%.) (1) Profit margin for 2016. (For Amazon, use "Total net sales.") (Show decrease with either a negative sign, e.g. -15.2% or in parentheses, e.g. (15.2)%.) Profit margin Amazon.com % Wal-Mart Stores (2) Gross profit for 2016. (Enter amounts in millions.) Gross profit Amazon.com Wal-Mart Stores %24 (3) Gross profit rate for 2016. Gross profit rate Amazon.com Wal-Mart Stores (4) Operating income for 2016. (Enter amounts in millions.) Operating income (000's) Amazon.com 24 Wal-Mart Stores (5) Percentage change in operating income from 2015 to 2016. (Show decrease with either a negative sign, e.g. -15.2% or in parentheses, e.g. (15.2)%.) Percent change in operating income Amazon.com Wal-Mart Stores AMAZON.COM, INC. CONSOLIDATED STATEMENTS OF CASH FLOWS (in millions) Year Ended December 31, 2014 8,658 $ 2016 15,890 2015 CASH AND CASH EQUIVALENTS, BEGINNING OF PERIOD 14,557 S OPERATING ACTIVITIES: Net income (loss) (241) 596 2,371 Adjustments to reconcile net income (loss) to net cash from operating activities: Depreciation of property and equipment, including internal-use software and website development, and other amortization, including capitalized content costs Stock-based compensation 4,746 6,281 8,116 1,497 2,119 2,975 Other operating expense, net 129 155 160 Other expense (income), net 59 250 (20) Deferred income taxes (316) 81 (246) Excess tax benefits from stock-based compensation (6) (119) (829) Changes in operating assets and liabilities: Inventories (1,193) (2,187) (1,426) Accounts receivable, net and other (1,039) (1,755) (3,367) Accounts payable 1,759 4,294 5,030 Accrued expenses and other 706 913 1,724 Additions to unearned revenue 4,433 7,401 11,931 Amortization of previously unearned revenue (3,692) (6,109) (9,976) Net cash provided by (used in) operating activities 6,842 11,920 16,443 INVESTING ACTIVITIES: Purchases of property and equipment, including internal-use software and website development, net Acquisitions, net of cash acquired, and other (4,893) (4,589) (6,737) (979) (795) (116) Sales and maturities of marketable securities 3,349 3,025 4,733 Purchases of marketable securities (2,542) (4,091) (7,756) Net cash provided by (used in) investing activities (5,065) (6,450) (9,876) FINANCING ACTIVITIES: Excess tax benefits from stock-based compensation 6. 119 829 Proceeds from long-term debt and other 6,359 353 621 Repayments of long-term debt and other (513) (1,652) (354) Principal repayments of capital lease obligations (1,285) (2,462) (3,860) Principal repayments of finance lease obligations (135) (121) (147) Net cash provided by (used in) financing activities 4,432 (3,763) (2,911) Foreign currency effect on cash and cash equivalents (310) (374) (212) Net increase (decrease) in cash and cash equivalents 5,899 1,333 3,444 CASH AND CASH EQUIVALENTS, END OF PERIOD 2$ 14,557 15,890 $ 19,334 SUPPLEMENTAL CASH FLOWW INFORMATION: Cash paid for rest on long-term debt 91 $ 325 290 Cash paid for interest on capital and finance lease obligations 86 153 206 Cash paid for income taxes, net of refunds 177 273 412 Property and equipment acquired under capital leases 4,008 4,717 5,704 Property and equipment acquired under build-to-suit leases 920 544 1.209 See accompanying notes to consolidated financial statements. AMAZON.COM, INC. CONSOLIDATED STATEMENTS OF OPERATIONS (in millions, except per share data) Year Ended December 31, 2014 2015 2016 Net product sales 70,080 $ 79,268 $ 94,665 Net service sales 18,908 27,738 41,322 Total net sales 88,988 107,006 135,987 Operating expenses: Cost of sales 62,752 71,651 88,265 Fulfillment 10,766 13,410 17,619 Marketing 4,332 5,254 7,233 Technology and content 9,275 12,540 16,085 General and administrative 1,552 1,747 2,432 Other operating expense, net 133 171 167 Total operating expenses 88,810 104,773 131,801 Operating income 178 2,233 4,186 Interest income 39 50 100 Interest expense (210) (459) (484) Other income (expense), net (118) (256) 90 Total non-operating income (expense) (289) (665) (294) Income (loss) before income taxes (111) 1,568 3,892 Provision for income taxes (167) (950) (1,425) Equity-method investment activity, net of tax 37 (22) (96) Net income (loss) $ (241) $ 596 $ 2,371 Basic earnings per share 2$ (0.52) $ 1.28 $ 5.01 Diluted earnings per share (0.52) $ 1.25 $ 4.90 Weighted-average shares used in computation of earnings per share: Basic 462 467 474 Diluted 462 477 484 See accompanying notes to consolidated financial statements. AMAZON.COM, INC. CONSOLIDATED STATEMENTS OF COMPREHENSIVE INCOME (LOSS) (in millions) Year Ended December 31, 2014 2015 2016 Net income (loss) (241) $ 596 $ 2,371 Other comprehensive income (loss): Foreign currency translation adjustments, net of tax of $(3), $10, and $(49) (325) (210) (279) Net change in unrealized gains (losses) on available-for-sale securities: Unrealized gains (losses), net of tax of $1, $(5), and $(12) (7) Reclassification adjustment for losses (gains) included in "Other income (expense), net," net of tax of $ČÏ), SÓ, and $0 (3) 5 8. Net unrealized gains (losses) on available-for-sale securities (1) (2) 17 Total other comprehensive income (loss) (326) (212) (262) Comprehensive income (loss) (567) $ 384 $ 2,109 See accompanying notes to consolidated financial statements. AMAZON.COM, INC. CONSOLIDATED BALANCE SHEETS (in millions, except per share data) December 31, 2015 2016 ASSETS Current assets: Cash and cash equivalents 2$ 15,890 $ 19,334 Marketable securities 3,918 6,647 Inventories 10,243 11,461 Accounts receivable, net and other 5,654 8,339 Total current assets 35,705 45,781 Property and equipment, net 21,838 29,114 Goodwill 3,759 3,784 Other assets 3,445 4,723 Total assets 2$ 64,747 $ 83,402 LIABILITIES AND STOCKHOLDERS' EQUITY Current liabilities: Accounts payable 2$ 20,397 $ 25,309 Accrued expenses and other 10,372 13,739 Unearned revenue 3,118 4,768 Total current liabilities 33,887 43,816 Long-term debt 8,227 7,694 Other long-term liabilities 9,249 12,607 Commitments and contingencies (Note 7) Stockholders' equity: Preferred stock, $0.01 par value: Authorized shares - 500 Issued and outstanding shares - none Common stock, $0.01 par value: Authorized shares - 5,000 Issued shares – 494 and 500 Outstanding shares -471 and 477 5 5 Treasury stock, at cost (1,837) (1,837) Additional paid-in capital Accumulated other comprehensive loss 13,394 17,186 (723) (985) Retained earnings 2,545 4,916 Total stockholders' equity 13,384 19,285 Total liabilities and stockholders' equity $ 64,747 $ 83,402 See accompanying notes to consolidated financial statements. | AMAZON.COM, INC. CONSOLIDATED STATEMENTS OF STOCKHOLDERS' EQUITY (in millions) Common Stock Additional Paid-In Capital Accumulated Other Comprehensive Income (Loss) Total Stockholders Equity Treasury Stock Retained Earnings Shares Amount Balance as of January 1, 2014 459 $ 5 S (1,837) $ 9,573 $ (185) $ 2,190 $ 9,746 Net loss (241) (241) - Other comprehensive income (loss) (326) (326) | Exercise of common stock options 2 - Excess tax benefits from stock-based compensation 6. Stock-based compensation and issuance of employee benefit plan stock Issuance of common stock for acquisition activity 1,510 1,510 44 44 Balance as of December 31, 2014 465 (1,837) 11,135 (511) 1,949 10,741 Net income 596 596 - Other comprehensive income (loss) (212) (212) Exercise of common stock options 6 4 4 Excess tax benefits from stock-based compensation 119 119 Stock-based compensation and issuance of employee benefit plan stock 2,131 2,131 Issuance of common stock for acquisition activity 5 5 Balance as of December 31, 2015 471 (1,837) 13,394 (723) 2,545 13,384 Net income 2,371 2,371 - Other comprehensive income (loss) (262) (262) | | Exercise of common stock options 1 1 Excess tax benefits from stock-based compensation 829 829 Stock-based compensation and issuance of employee benefit plan stock 2,962 2,962 Balance as of December 31, 2016 477 $ 5 $ (1,837) $ 17,186 S (985) $ 4,916 $ 19,285 See accompanying notes to consolidated financial statements. Wal-Mart Stores, Inc. Consolidated Statement of Income Fiscal Years Ended January 31, (Amounts in millions, except per share data) 2017 2016 2015 Revenues: $478,614 3,516 $482,229 3,422 Net sales $481,317 4,556 Membership and other income Total revenues 485,873 482,130 485,651 Costs and expenses: Cost of sales 361,256 101,853 360,984 97,041 365,086 93,418 Operating, selling, general and administrative expenses Operating income 22,764 24,105 27,147 Interest: Debt 2,044 2,027 2,161 Capital lease and financing obligations Interest income 323 521 300 (100) (81) (113) Interest, net 2,267 2,467 2,348 Income from continuing operations before income taxes Provision for income taxes 20,497 6,204 21,638 6,558 24,799 7,985 Income from continuing operations Income from discontinued operations, net of income taxes 15,080 16,814 285 14,293 15,080 (386) Consolidated net income 14,293 (650) 17,099 (736) Consolidated net income attributable to noncontrolling interest Consolidated net income attributable to Walmart $ 13,643 $ 14,694 $ 16,363 Basic net income per common share: Basic income per common share from continuing operations attributable to Walmart Basic income per common share from discontinued operations attributable to Walmart 4.40 4.58 5.01 0.06 | Basic net income per common share attributable to Walmart $ 4.40 4.58 5.07 Diluted net income per common share: Diluted income per common share from continuing operations attributable to Walmart Diluted income per common share from discontinued operations attributable to Walmart 4.38 4.57 4.99 0.06 Diluted net income per common share attributable to Walmart $ 4.38 $ 4.57 $ 5.05 Weighted-average common shares outstanding: Basic Diluted 3,101 3,112 3,207 3,217 3,230 3,243 Dividends declared per common share 2.00 1.96 1.92 See accompanying notes. is %24 %24 %24 %24 %24 Wal-Mart Stores, Inc. Consolidated Statement of Comprehensive Income Fiscal Years Ended January 31, (Amounts in millions) 2017 2016 2015 $15,080 (386) $17,099 (736) Consolidated net income $14,293 (650) Less consolidated net income attributable to nonredeemable noncontrolling interest Consolidated net income attributable to Walmart 13,643 14,694 16,363 Other comprehensive income (loss), net of income taxes Currency translation and other Net investment hedges Cash flow hedges Minimum pension liability (2,882) 413 (5,220) 366 (4,558) 379 21 (202) 86 (470) (69) (397) Other comprehensive income (loss), net of income taxes Less other comprehensive income (loss) attributable to nonredeemable noncontrolling interest (2,845) 210 (4,970) 541 (4,718) 546 Other comprehensive income (loss) attributable to Walmart (2,635) (4,429) (4,172) Comprehensive income, net of income taxes Less comprehensive income (loss) attributable to nonredeemable noncontrolling interest 11,448 (440) 10,110 155 12,381 (190) Comprehensive income attributable to Walmart $11,008 $10,265 $12,191 See accompanying notes. Wal-Mart Stores, Inc. Consolidated Balance Sheets As of January 31, (Amounts in millions) 2017 2016 ASSETS Current assets: $ 6,867 5,835 43,046 $ 8,705 Cash and cash equivalents Receivables, net 5,624 44,469 Inventories Prepaid expenses and other 1,941 1,441 Total current assets 57,689 60,239 Property and equipment: Property and equipment Less accumulated depreciation 179,492 (71,782) 176,958 (66,787) 107,710 Property and equipment, net Property under capital lease and financing obligations: Property under capital lease and financing obligations 110,171 11,637 (5,169) 11,096 (4,751) Less accumulated amortization Property under capital lease and financing obligations, net 6,468 17,037 6,345 16,695 Goodwill Other assets and deferred charges 9,921 6,131 Total assets $198,825 $199,581 LIABILITIES AND EQUITY Current liabilities: Short-term borrowings Accounts payable $ 1,099 41,433 20,654 $ 2,708 38,487 19,607 Accrued liabilities Accrued income taxes 921 521 2,256 2,745 Long-term debt due within one year Capital lease and financing obligations due within one year 565 551 Total current liabilities 66,928 64,619 Long-term debt Long-term capital lease and financing obligations 36,015 6,003 9,344 38,214 5,816 7,321 Deferred income taxes and other Commitments and contingencies Equity: Common stock 305 317 Capital in excess of par value Retained earnings 2,371 89,354 1,805 90,021 (11,597) Accumulated other comprehensive loss (14,232) Total Walmart shareholders' equity Nonredeemable noncontrolling interest 77,798 2,737 80,546 3,065 Total equity 80,535 83,611 Total liabilities and equity $198,825 $199,581 See accompanying notes. Wal-Mart Stores, Inc. Consolidated Statements of Shareholders' Equity and Redeemaole Noncontrolling Interest Accumulated Total Capital in Excess of Amount Par Value Redeemable Total Noncontrolling Other Walmart Nonredeemable Common Stock Retained Comprehensive Shareholders Noncontrlling Equity (Amounts in millions) Shares Earnings Loss Interest Equity Interest $323 $2,362 $76,566 16,363 $ (2,996) $76,255 16,363 $ 1,491 $5,084 Balances as of February 1, 2014 Consolidated net income $81,339 17,099 3,233 736 Other comprehensive loss, net of income taxes (4,172) (4,172) (546) (4,718) Cash dividends declared ($1.92 per share) Purchase of Company stock (6,185) (6,185) (980) (6,185) (13) (1) (29) (950) (980) Purchase of redeemable noncontrolling interest (1,491) | Other 8 1 129 (17) 113 (731) (618) Balances as of January 31, 2015 3,228 2,462 81,394 14,694 323 4,543 85,777 14,694 (7,168) 85,937 15,080 Consolidated net income 386 Other comprehensive loss, net of income taxes (4,429) (4,429) (541) (4,970) Cash dividends declared ($1.96 per share) Purchase of Company stock Cash dividend declared to (6,294) (6,294) (6,294) (65) (6) (102) (4,148) (4,256) (4,256) noncontrolling interest (691) (632) (691) (1,195) Other (1) (555) (8) (563) Balances as of January 31, 2016 3,162 Consolidated net income 317 1,805 90,021 13,643 (11,597) 80,546 13,643 3,065 83,611 14,293 650 Other comprehensive loss, net of income taxes (2,635) (2,635) (210) (2,845) Cash dividends declared ($2.00 per share) Purchase of Company stock (6,216) (8,090) (6,216) (8,276) (6,216) (8,276) (120) (12) (174) Cash dividend declared to (519) 487 noncontrolling interest (519) (249) | | Other 6 740 (4) 736 Balances as of January 31, 2017 3,048 $305 $2,371 $89,354 $(14,232) $77,798 $2,737 $80,535 2$ See accompanying notes. Wal-Mart Stores, Inc. Consolidated Statements of Cash Flow Fiscal Years Ended January 31, (Amounts in millions) 2017 2016 2015 Cash flows from operating activities: $ 14,293 $ 15,080 $ 17,099 (285) Consolidated net income Income from discontinued operations, net of income taxes Income from continuing operations Adjustments to reconcile income from continuing operations to net cash provided by operating activities: Depreciation and amortization 14,293 15,080 16,814 9,454 (672) 1,410 9,173 (503) 10,080 Deferred income taxes 761 Other operating activities Changes in certain assets and liabilities, net of effects of acquisitions: Receivables, net 206 785 (402) 1,021 3,942 (19) (703) 2,008 (569) Inventories (1,229) 2,678 Accounts payable Accrued liabilities 1,137 1,303 (472) 1,249 Accrued income taxes 492 166 Net cash provided by operating activities 31,530 27,389 28,564 Cash flows from investing activities: Payments for property and equipment Proceeds from the disposal of property and equipment Proceeds from the disposal of certain operations (10,619) (11,477) (12,174) 456 635 570 662 246 671 (1,901) (2,463) (122) Purchase of available for sale securities Investment and business acquisitions, net of cash acquired Other investing activities (79) (192) Net cash used in investing activities (13,987) (10,675) (11,125) Cash flows from financing activities: Net change in short-term borrowings Proceeds from issuance of long-term debt Payments of long-term debt Dividends paid Purchase of Company stock Dividends paid to noncontrolling interest Purchase of noncontrolling interest Other financing activities (6,288) 5,174 (3,904) (6,185) (1,673) 1,235 137 39 (2,055) (6,216) (8,298) (479) (90) (4,432) (6,294) (4,112) (719) (1,326) (1,015) (600) (1,844) (409) (255) (513) Net cash used in financing activities (18,929) (16,122) (15,071) Effect of exchange rates on cash and cash equivalents (452) (1,022) (514) Net increase (decrease) in cash and cash equivalents Cash and cash equivalents at beginning of year (1,838) 8,705 (430) 9,135 1,854 7,281 Cash and cash equivalents at end of year $ 6,867 $ 8,705 $ 9,135 Supplemental disclosure of cash flow information: Income taxes paid Interest paid 4,507 2,351 8,111 2,540 8,169 2,433 See accompanying notes.
Expert Answer:
Answer rating: 100% (QA)
Answer As per given information AmazonCom Inc WalMart Stores Inc For Dec 31 2016 For Dec 31 2015 For Jan 31 2017 For Jan 31 2016 Net Sales 135987 1070... View the full answer

Related Book For 
Managing Operations Across the Supply Chain
ISBN: 978-0078024030
2nd edition
Authors: Morgan Swink, Steven Melnyk, Bixby Cooper, Janet Hartley
Posted Date:
Students also viewed these general management questions
-
Based on the information contained in these financial statements, compute free cash flow for each company. COLUMBIA SPORTSWEAR COMPANY CONSOLIDATED STATEMENTS OF OPERATIONS (In thousands, except per...
-
Mackenzie Plc engages in the manufacturing of small household appliances. The following are extracts from the accounting records of Mackenzie Ple at 31 December 2021 and 2020. Mackenzie Ple...
-
Based on the information contained within this chapter, what are the critical linkages between the logistics management system and other functions such as production and purchasing?
-
A production line will be used to manufacture an item. The line will be operated with using the same personnel during single shift operations. During the initial line certification, the first item...
-
How does the gravitational force on a falling body compare with the air resistance it encounters before it reaches terminal velocity? After reaching terminal velocity?
-
In Problems 13 through 22, first verify that the given vectors are solutions of the given system. Then use the Wronskian to show that they are linearly independent. Finally, write the general...
-
Consider the following cases. (a) A small 0.6-in.-long fish swims with a speed of \(0.8 \mathrm{in} / \mathrm{s}\). Would a boundary layer type flow be developed along the sides of the fish? Explain....
-
Consider the following data for two products of Vigano Manufacturing. Required 1. Using direct labor hours as the basis for assigning overhead costs, determine the total production cost per unit for...
-
Create thesis statement for interesting topic in abnormal psychology. The overall topic must be within the scope of abnormal psychology, and not sociology, developmental psychology, etc.
-
How would the companys cash needs change for the company in Examples 14-1 to 14-5 if the third project started in May instead of February and the retention was not released until the following year?
-
Rowan, Inc.'s, income statement is shown below. Based on this income statement and the other information provided, calculate the net cash provided by operations using the indirect method. Rowan, Inc....
-
The buyer and seller of merchandise must agree on who is responsible for paying freight terms. Show your understanding of freight terms by selecting all of the correct statements below. Terms FOB...
-
Describe the nature, type, and valuation of current liabilities that are in the balance sheet of your project company's annual report.
-
What is the equilibrium price? Please round your answer to the nearest hundredth. What is the equilibrium quantity? Please round your answer to the nearest integer. What is the total revenue at...
-
What in your view are the three most important aspects of Capital Budgeting? Explain why you have chosen these three over other potentially important facets of budgeting. Respond to this to make your...
-
SMC 60- 25 80 70 50 40 Revenue and cost (dollars) 30 20 10 22 ATC AVC D MR 0 20 40 60 80 100 120 140 160 Output The graph above shows the demand and cost conditions facing a monopolist. What price...
-
What and why form would an individual use who has less than $50,000 in taxable income from wages, salaries, tips, unemployment compensation, interest, or dividends, and who is married and does not...
-
Show that the peak of the black body spectrum as a function of ? is given by eq. (22.14) kg T Wmax = 2.82
-
Why should the firm never outsource its core capabilities? What happens if the firm is approached by a supplier who is willing to supply goods and services based on these core capabilities at a...
-
You are concerned about the quality of parts that you are receiving from your supplier. Consequently, you decide to take 25 batches of samples (where each sample consists of 50 units) and to do 100%...
-
This case gives students an exercise in mapping out a set of tasks and wrestling with ill-defined precedence relationships, external constraints, and possible risks. The case illustrates the...
-
Identify each of the following as a consumer product or a business product, or classify it as both: a. frozen yogurt b. iPad c. gasoline d. boat trailer e. hand sanitizer f. Post-its
-
What are the steps in developing a marketing strategy?
-
What is the difference between primary data and secondary data?

Study smarter with the SolutionInn App