

Mini-case Assignment #1 Receivables and Securitization - Wells Fargo, 2019 Attached please find Income Statement, Balance...
Fantastic news! We've Found the answer you've been seeking!
Question:

Transcribed Image Text:
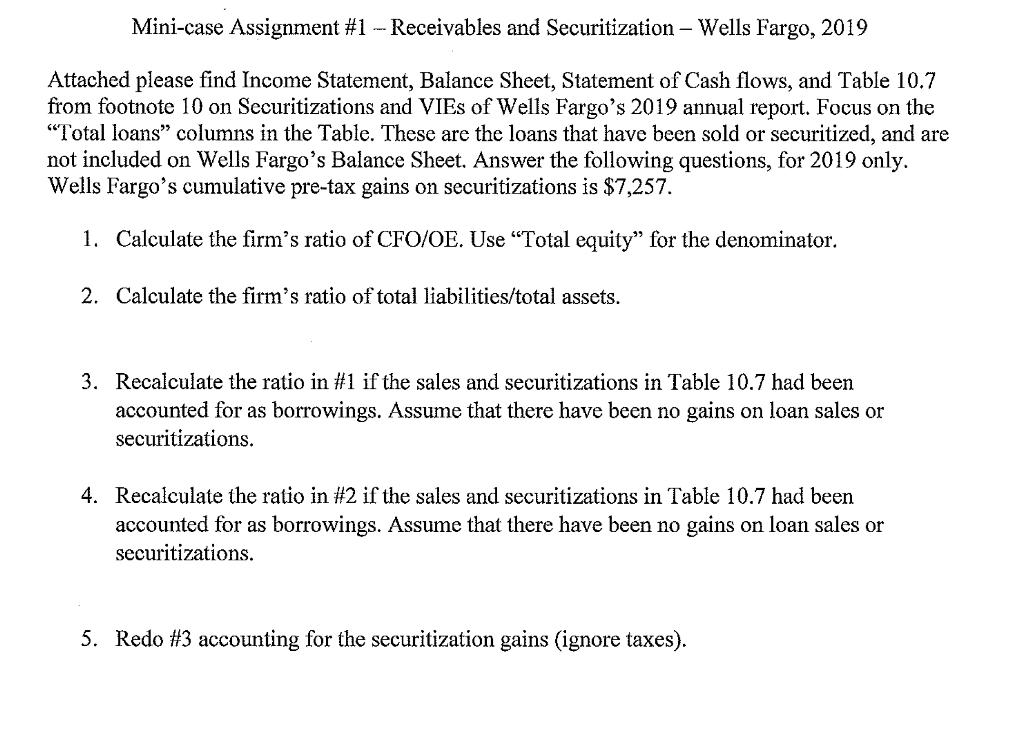
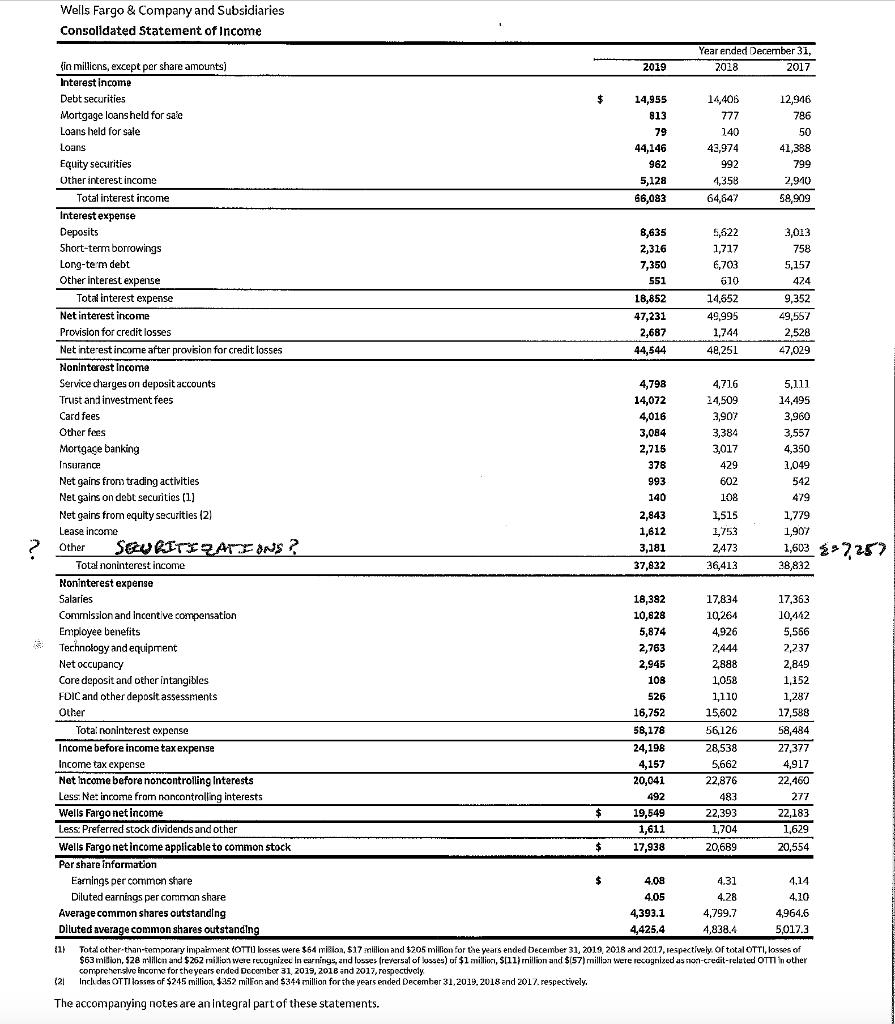
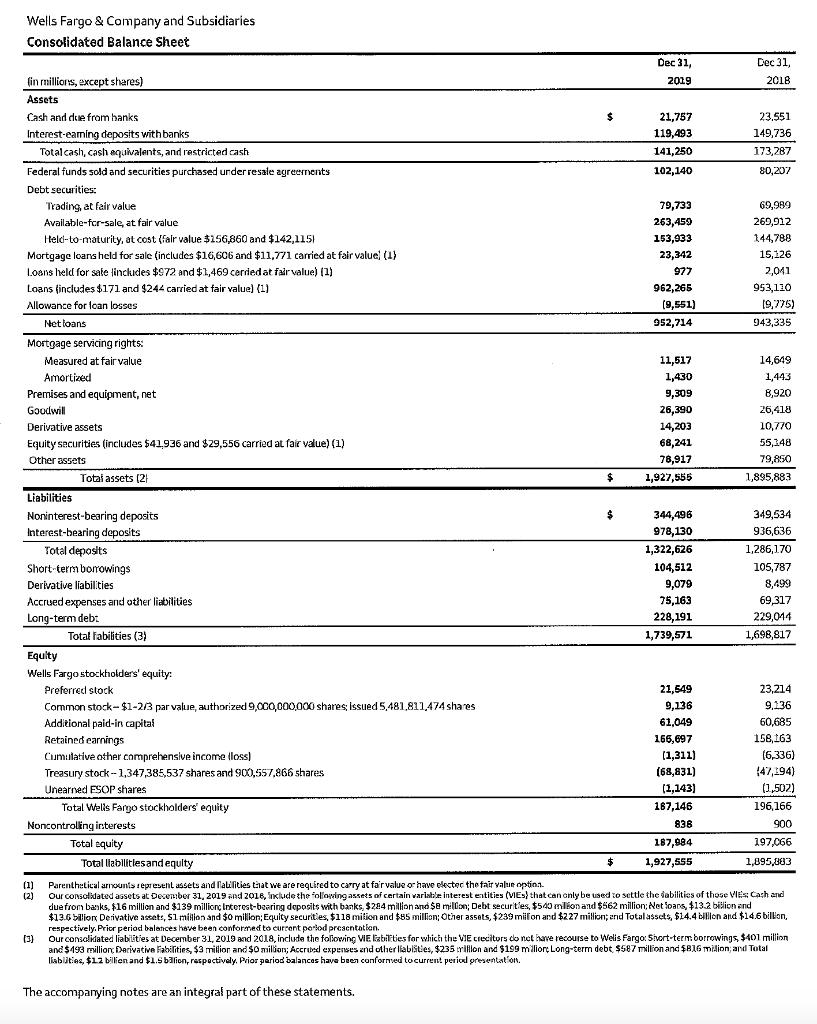
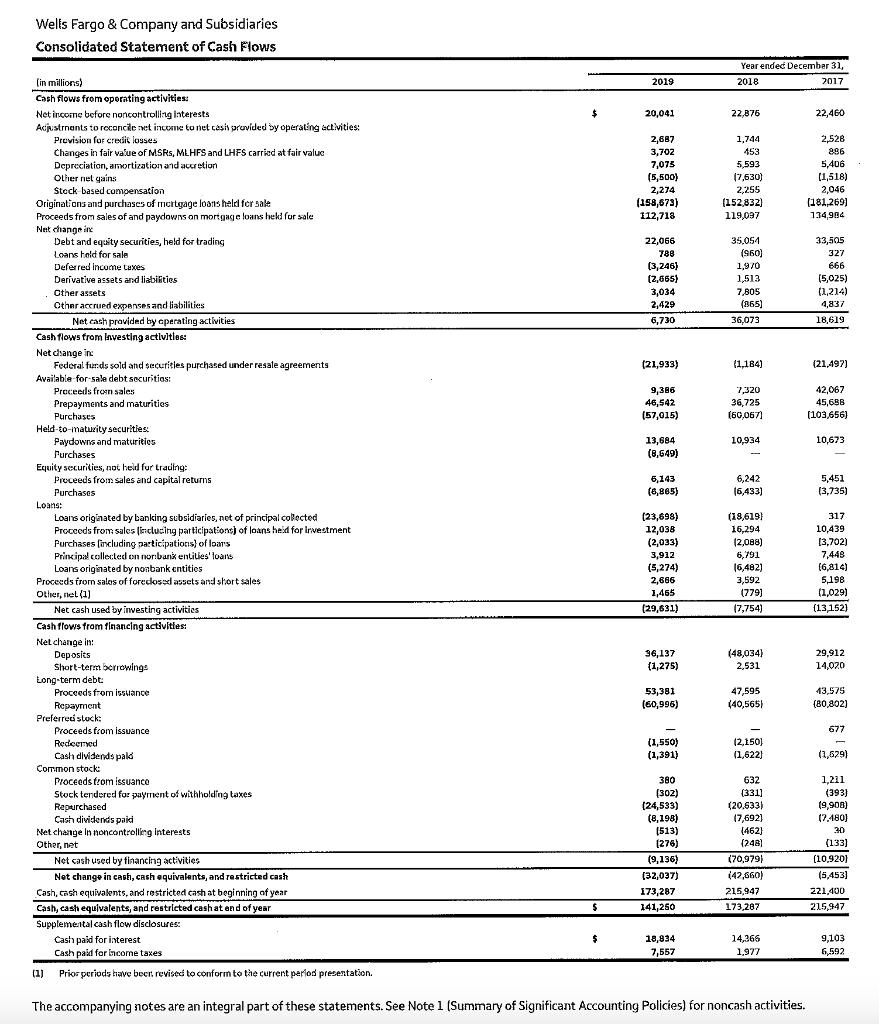
Mini-case Assignment #1 Receivables and Securitization - Wells Fargo, 2019 Attached please find Income Statement, Balance Sheet, Statement of Cash flows, and Table 10.7 from footnote 10 on Securitizations and VIES of Wells Fargo's 2019 annual report. Focus on the "Total loans" columns in the Table. These are the loans that have been sold or securitized, and are not included on Wells Fargo's Balance Sheet. Answer the following questions, for 2019 only. Wells Fargo's cumulative pre-tax gains on securitizations is $7,257. 1. Calculate the firm's ratio of CFO/OE. Use "Total equity" for the denominator. 2. Calculate the firm's ratio of total liabilities/total assets. 3. Recalculate the ratio in #1 if the sales and securitizations in Table 10.7 had been accounted for as borrowings. Assume that there have been no gains on loan sales or securitizations. 4. Recalculate the ratio in #2 if the sales and securitizations in Table 10.7 had been accounted for as borrowings. Assume that there have been no gains on loan sales or securitizations. 5. Redo #3 accounting for the securitization gains (ignore taxes). Wells Fargo & Company and Subsidiaries Consolidated Statement of Income Year ended December 31, fin miliens, except per share amounts) 2019 2018 2017 Interest income Debt securities $. 14,955 14,406 12,946 Mortgage loansheld for sale 813 77 786 Loans held for sale 79 140 50 Loans 44,146 43,974 41,388 Equity securities Other interest income 962 992 799 5,128 4,358 2,940 Total interest income 66,083 64,647 58,909 Interest expense Deposits Short-term borrowings 8,635 2,316 5,622 3,013 17ק,נ 758 Long-tem debt Other interest expense 7,350 6,703 5,157 551 610 474 Total interest expense 18,852 14,652 9,352 Net interest income 47,231 49,995 49,557 Provision for credit losses 2,687 1,744 2,528 Net interest income after provision for credit losses 44,544 48,251 47,029 Noninterest Income Service dharges on depositaccounts 4,798 4,71.6 5,111 Trust and investment fees 14,072 14,509 14,495 Card fees 4,016 3,907 3,960 Other fees 3,084 3,384 3,557 Mortgage banking Insurance ל1ב,2 3,017 4,350 378 429 1,049 Net gains frons trading activities Net gains on debt securities (1) 993 602 542 140 108 479 Net gains from equity securities (2) Lease income 1,515 1,753 1,779 1,907 2,843 1,612 ? Other SEURITIZAI ONS ? 1,603 2257 3,181 2,473 Totał noninterest income 37,832 36,413 38,832 Noninterest expense Salaries 18,382 17,834 17,363 Commisslon and Incentive compensation 10,828 10,264 10,442 Employee benefits Technołogy and equipment 5,874 4,926 5,56 2,763 2,444 2,237 Net occupancy 2,945 2,888 2,849 Core deposit and other intangibles FOIC and other deposit assessments 108 1,058 1,152 526 1,110 1,287 Other 16,752 15,602 17,588 Tota: noninterest expense 58,178 56,126 58,484 Income before income tax expense 24,198 28,538 27,377 Income tax expense 4,157 5,662 4,917 Net income before noncontrolling Interests Less. Ne: income from noncontrolling interests Wells Fargo net income 20,041 22,876 22,460 492 483 277 19,549 1,611 22,393 22,183 Less: Preferred stock dividends and other 1,704 1,629 Wells Fargo netincome applicable to common stock 17,938 20,689 20,554 Per share information Earnings per common share 24 4.08 4.31 4,14 4.10 Diluted earnings per comman share Average common shares outstanding Diluted average common shares outstanding 4.05 4.28 4,393.1 4,799.7 4,964,6 4,425.4 4,838.4 5,017.3 Total other-than-temporary impainment (OTTI) losses were $64 mišion, $17 milion and $205 million for the years ended December 31, 2019, 2018 and 2017, respectively. Of total OTTI, losses of $63 milion, $28 nlillen and $262 nilion were recognizec in earnings, and losses (reversal of lusses) of $1 miliori, $[11) million and $(57) millian were recognized as Fnori-credit-related OTT in other comprehersive Encone for the years erded Decomber 31, 2019, 2018 and 2017, respoctivoly (21 Inclu das OTTI losses of $245 millioa, $352 milion and $344 million for the years ended December 31,2019, 2018 and 2017. respectively. The accompanying notes are an integral partof these statements. Wells Fargo & Company and Subsidiaries Consolidated Balance Sheet Dec 31, Dec 31, (in milliors, except shares) 2019 2018 Assets Cash and due from hanks %24 21,757 23,551 Interest-eaming deposits withbanks 119,493 149,736 Totalcash, cash equivalents, and restricted cash 141,250 173,287 Federal funds sold and securities purchased under resale agreements 102,140 80,207 Debt securities: Trading, at fair value 79,733 69,989 263,459 153,933 Available-for-sale, at fair value 269,912 Held-to-maturity, at cost (fair value $156,860 and $142,1151 Mortgage loans held for sale (includes $16,606 and $11,771 carried at fair value (1) Loans held for sale linckudes $972 and $1,469 cerdedat fair value) (1) 144,788 23,342 15,126 977 2,01 Loạns (includes $171 and $244 carried at fair value) (1) 962,265 953,110 Allowance for loan losses (9,551) (9,775) Net loans 952,714 943,335 Mortgage servicing rights: Measured at fair value 11,517 14,649 Amortized 1,430 1,443 Premises and equipment, net 9,309 8,920 Goodwill 26,390 26,418 Derivative assets 14,203 10,770 Equity sacurities (includes $41,936 and $29,556 carried at fair value) (1) 68,241 55,148 Other assets 78,917 79,850 Totai assets (2} 1,927,555 1,895,883 Liabilities 349,534 936,636 344,496 Noninterest-bearing deposits Interest-bearing deposits 978,130 Total deposits 1,322,626 1,286,170 Short-term borowings 104,512 105,787 Derivative liabilities 9,079 8,499 Accrued expenses and other liabilities Long-term deb: 75,163 69,317 228,191 229,014 Total fabilities (3) 1,739,571 1,698,817 Equity Wells Fargo stockholders' equity: Preferred stock 21,549 23,214 Common stock- $1-2/3 par value, authorized 9,000,000,000 shares; Issued 5,481,811,474 shares 9,136 9,136 Additional paid-irn capital 61,049 60,685 Retained earnings 166,697 158,163 (6,336) (47,194) Cumalative other comprehensive income lloss) (1,311) (68,831) (1,143) Treasury stock -1,347,385,537 shares and 900,5S7,866 shares Unearned ESOP shares (1,502) Total Wells Fargo stockholders' equity 167,146 196,166 Noncontroling interests 838 900 Total equity 187,984 197,066 Total llabilitlesand equity 1,927,555 1,895,883 (1) Parenthetical arrounts represent assets and lalifities that we arerequired to carry at fair value or have electec the fair value optina. (2) Our consolidated assets at Decenber 31, 2019 and 2016, include the folloving assets of certain varlaln interest entities (VIES) that can anly be used to settle the dabilities of those VItis: Cach and duefrom banks, $16 million and $139 millionç Interest-bearing deposits with banks, $284 million and $8 millon; Debt securities, $540 milion and $562 million; Net loans, $13.2 bilion end $13.6 blion Derivative assets, S1milon and $0 milllon; Equity securities, $118 milion and $85 million; Other assets, $239milon and $227 million; end Total assets, $14.4 bilon and $14.6 billon, respectively. Prior period balances hae been conformed to current pertod preaentation. band! (3) Our consclidated liabilities at December 31, 2019 and 2018, include the following VIE Eabities for which the VIE crecitors do net have recourse to Welis Fargo: Sivort-termborrowings, $401 million and $493 million, Darivative Fabilities, $3 millior and $0 million; Accrued expenses end other liabišties, $235 rililon and $199 miliorç Long-term debt $587 million and $B16 midion, and Total liabiities, $12 bilien and $1.5 balion, respectivaly. Prior period balances have been confornved tocurrent period presentation. The accompanying notes are an integral part of these statements. Wells Fargo & Company and Subsidiaries Consolidated Statement of Cash Flows Year endec Decembar 31, (in millions) 2019 2018 2017 Cash flows from oporating activities: Net income before noncontrolling Interests 20,041 22,876 22,460 Acijustrnants to reconcile vet income to net casis pravided by operating activities: Prevision for credit losses 2,687 1,744 2,528 Changes in fair value of MSRS, MLHFS and LHFS carried at fair valuc Depreciation, amortization and accretion Olher net gains Stock based compensation Originations and purchases of mertgage loans held for sale Proceeds from sales of and paydowns on mortgage loans heki for sale Net change ine Debt and equity securities, held for trading Loans held for sale Deferred incume taxes 3,702 453 886 7,075 5,593 5,406 (5,500) (7,630) (1,518) 2,255 (152,832) 119,097 2,274 2,046 (181,269) (158,673) 112,718 134,984 35,054 (S60) 22,066 33,505 788 327 (3,246) (2,665) 3,034 1,9/0 666 (5,025 (1,214) Derivative assets and liabilities 1,513 Other assets 7,805 Other accrued expenses and liabilities 2,429 (865) 4,837 Net cash provided by operating activities 6,730 36,073 18,619 Cash flows from Iavesting activities: Net dsange in: Federal funds sold and securities purchased under resale agreements Available for-sale debt securitios: (21,933) (1,184) (21,497) 42,067 45,688 (103,656) Proceeds from sales 9,386 7,320 Prepayments and maturities 46,542 36,725 Purchases (57,015) (60,067) Held-to-maturity securities: 10,934 10,673 Paydowns and maturities Purchases 13,684 (8,649) Equity securities, not held fur traulng: Preceeds from sales and capital returns Purchases 6,143 6,242 5,451 (6,865) (6,433) (3,735) Loans: Loans originated by banking subsidiaries, net of principal colected Procceds from sales (inclucing participations) of loans heid for Irvestment Purchases (including participations) of loars Principal collected on nor:banik entilies'loans Loans originated by nonbank entities Procesds from salos of foreclosed assets and short sales (23,698) (18,619) 16,294 (2,088) 6,791 (6,482) 3,592 317 12,038 (2,033) 3,912 (5,274) 10,439 [3,702) 7,448 (6,814) 5,198 2,666 1,465 Otlher, nel (1) (779) (1,029) (29,631) (7,754) (13,152) Net cash used by investing activities Cash flows from financing activitles: Net change in: Deposits Short-term berrowings Long-term debt 36,137 (1,275) (48,034) 29,912 2,531 14,020 47,595 (40,565) Proceeds from isuance 53,381 13,575 (60,996) (80,802) Repayment Preferred stock: Proceeds from issuance 677 (2,150) (1,550) (1,391) Redeemed Cash dividends pakd (1,622) (1,629) Common stock: Proceeds from issuance Stock tendered fo: payment of withholding taxes Repurchased Cash dividends paki Net change in noncontrolling interests 380 632 1,211 (302) (24,533) (8,198) (513) [276) (331) (20.633) (7,692) (393) (9,908) (7.480) (462) (248) 30 Other, net (133) Net cash used by financing activities (9,136) (70,979) (10,920) Net change in cash, cash equivalents, and restricted cash (32,037) (42,660) (5,453) 173,287 141,250 Cash, cash equivalents, and restricted cash at beginning of year 215,947 221,400 Cash, cash equivalents, and restricted cashat end of year 173,287 215,947 Supplementalcash flow disclosures: Cash paid for interest Cash paid for bncome taxes 18,834 14,366 9,103 7,557 1,977 6,592 (1) Prior periods have beer. revised to conform to the current period presentation. The accompanying notes are an integral part of these statements. See Note 1 (Summary of Significant Accounting Policies) for noncash activities. In addition to residential MSRS included in the previous table, we have a small portfolio of commercial MSRS which are carried at LOCOM with a fair value of $1.9 billion and $2.3 billion at December 31, 2019 and 2018, respectively. Prepayment assumptions do not significantly impact values of commercial MSRS and commercial mortgage bonds as most commercial loans include contractual restrictions on prepayment. Servicing costs are not a driver of our MSR value as we are typically primary or master servicer; the higher costs of servicing delinquent and foreclosed loans is generally born by the special servicer. The primary economic driver impacting the fair value of our commercial MSRS is forward interest rates, which are derived from market observable yield curves used to price capital markets instruments. Market interest rates significantly affect interest earned on custodial deposit balances. The sensitivity of the current fair value to an immediate adverse 25% change in the assumption about interest earned on deposit balances at December 31, 2019 and 2018, results in a decrease in fair value of $205 million and $320 million, respectively. See Note 11 (Mortgage Banking Activities) for further information on our commercial MSRS. The sensitivities in the preceding paragraph and table are hypothetical and caution should be exercised when relying on this data. Changes in value based on variations in assumptions generally cannot be extrapolated because the relationship of the change in the assumption to the change in value may not be linear. Also, the effect of a variation in a particular assumption on the value of the other interests held is calculated independently without changing any other assumptions. In reality, changes in one factor may result in changes in others (for example, changes in prepayment speed estimates could result in changes in the credit losses), which might magnify or counteract the sensitivities. Off-Balance Sheet Loans Table 10.7 presents information about the principal balances of off-balance sheet loans that were sold or securitized, including residential mortgage loans sold to FNMA, FHLMC, GNMA and other investors, for which we have some form of continuing involvement (including servicer). Delinquent loans include loans 90 days or more past due and loans in bankruptcy, regardless of delinquency status. For loans sold or securitized where servicing is our only form of continuing involvement, we would only experience a loss if we were required to repurchase a delinquent loan or foreclosed asset due to a breach in representations and warranties associated with our loan sale or servicing contracts. Table 10.7: Off-Balance Sheet Loans Sold or Securitized Net charge-offs (3) Delinguent loans and foredosed assets (1) Total loans Year ended December 31, December 31, December 31, (in millions} 2019 2018 2019 2018 2019 2018 Commercial: Real estate mortgage 2$ 112,507 105,173 776 1,008 179 739 Total commerciał 112,507 105,173 776 1,008 179 739 Consumer: Real estate 1-4 family first mortgage 1,008,446 1,097,128 6,664 8,947 229 466 Real estate 1-4 family junior lien mortgage 13 2 Total consumer 1,008,459 1,097,128 6,666 8,947 229 466 Total off balance sheet sold or securitized loans (2) 1,120,966 1,202,301 7,442 9,955 408 1,205 (1) Includes $492 million and $675 tmal'on of commercial foreclosed assets and $356 milion and $582 milion of consumer foreciosed assets at December 31, 2019 and 2018, respectively. (2) At December 31, 2019 and 2018, the table includes total loans of $1.0 trillion and $1.1 trillion, delinquent ioans of $5.2 billion and $6.4 billlon, and foreclosed assets of $251 million and $442 milion, respectively, for FNMA, FHI.MC and GNMA. (3) Net charge-offs exclude loans sold to FNMA, FHLMCand GNMA as we do not service or manage the underlying real estate upon forectosure and, as stuch, do not have access to net charge-off information. Mini-case Assignment #1 Receivables and Securitization - Wells Fargo, 2019 Attached please find Income Statement, Balance Sheet, Statement of Cash flows, and Table 10.7 from footnote 10 on Securitizations and VIES of Wells Fargo's 2019 annual report. Focus on the "Total loans" columns in the Table. These are the loans that have been sold or securitized, and are not included on Wells Fargo's Balance Sheet. Answer the following questions, for 2019 only. Wells Fargo's cumulative pre-tax gains on securitizations is $7,257. 1. Calculate the firm's ratio of CFO/OE. Use "Total equity" for the denominator. 2. Calculate the firm's ratio of total liabilities/total assets. 3. Recalculate the ratio in #1 if the sales and securitizations in Table 10.7 had been accounted for as borrowings. Assume that there have been no gains on loan sales or securitizations. 4. Recalculate the ratio in #2 if the sales and securitizations in Table 10.7 had been accounted for as borrowings. Assume that there have been no gains on loan sales or securitizations. 5. Redo #3 accounting for the securitization gains (ignore taxes). Wells Fargo & Company and Subsidiaries Consolidated Statement of Income Year ended December 31, fin miliens, except per share amounts) 2019 2018 2017 Interest income Debt securities $. 14,955 14,406 12,946 Mortgage loansheld for sale 813 77 786 Loans held for sale 79 140 50 Loans 44,146 43,974 41,388 Equity securities Other interest income 962 992 799 5,128 4,358 2,940 Total interest income 66,083 64,647 58,909 Interest expense Deposits Short-term borrowings 8,635 2,316 5,622 3,013 17ק,נ 758 Long-tem debt Other interest expense 7,350 6,703 5,157 551 610 474 Total interest expense 18,852 14,652 9,352 Net interest income 47,231 49,995 49,557 Provision for credit losses 2,687 1,744 2,528 Net interest income after provision for credit losses 44,544 48,251 47,029 Noninterest Income Service dharges on depositaccounts 4,798 4,71.6 5,111 Trust and investment fees 14,072 14,509 14,495 Card fees 4,016 3,907 3,960 Other fees 3,084 3,384 3,557 Mortgage banking Insurance ל1ב,2 3,017 4,350 378 429 1,049 Net gains frons trading activities Net gains on debt securities (1) 993 602 542 140 108 479 Net gains from equity securities (2) Lease income 1,515 1,753 1,779 1,907 2,843 1,612 ? Other SEURITIZAI ONS ? 1,603 2257 3,181 2,473 Totał noninterest income 37,832 36,413 38,832 Noninterest expense Salaries 18,382 17,834 17,363 Commisslon and Incentive compensation 10,828 10,264 10,442 Employee benefits Technołogy and equipment 5,874 4,926 5,56 2,763 2,444 2,237 Net occupancy 2,945 2,888 2,849 Core deposit and other intangibles FOIC and other deposit assessments 108 1,058 1,152 526 1,110 1,287 Other 16,752 15,602 17,588 Tota: noninterest expense 58,178 56,126 58,484 Income before income tax expense 24,198 28,538 27,377 Income tax expense 4,157 5,662 4,917 Net income before noncontrolling Interests Less. Ne: income from noncontrolling interests Wells Fargo net income 20,041 22,876 22,460 492 483 277 19,549 1,611 22,393 22,183 Less: Preferred stock dividends and other 1,704 1,629 Wells Fargo netincome applicable to common stock 17,938 20,689 20,554 Per share information Earnings per common share 24 4.08 4.31 4,14 4.10 Diluted earnings per comman share Average common shares outstanding Diluted average common shares outstanding 4.05 4.28 4,393.1 4,799.7 4,964,6 4,425.4 4,838.4 5,017.3 Total other-than-temporary impainment (OTTI) losses were $64 mišion, $17 milion and $205 million for the years ended December 31, 2019, 2018 and 2017, respectively. Of total OTTI, losses of $63 milion, $28 nlillen and $262 nilion were recognizec in earnings, and losses (reversal of lusses) of $1 miliori, $[11) million and $(57) millian were recognized as Fnori-credit-related OTT in other comprehersive Encone for the years erded Decomber 31, 2019, 2018 and 2017, respoctivoly (21 Inclu das OTTI losses of $245 millioa, $352 milion and $344 million for the years ended December 31,2019, 2018 and 2017. respectively. The accompanying notes are an integral partof these statements. Wells Fargo & Company and Subsidiaries Consolidated Balance Sheet Dec 31, Dec 31, (in milliors, except shares) 2019 2018 Assets Cash and due from hanks %24 21,757 23,551 Interest-eaming deposits withbanks 119,493 149,736 Totalcash, cash equivalents, and restricted cash 141,250 173,287 Federal funds sold and securities purchased under resale agreements 102,140 80,207 Debt securities: Trading, at fair value 79,733 69,989 263,459 153,933 Available-for-sale, at fair value 269,912 Held-to-maturity, at cost (fair value $156,860 and $142,1151 Mortgage loans held for sale (includes $16,606 and $11,771 carried at fair value (1) Loans held for sale linckudes $972 and $1,469 cerdedat fair value) (1) 144,788 23,342 15,126 977 2,01 Loạns (includes $171 and $244 carried at fair value) (1) 962,265 953,110 Allowance for loan losses (9,551) (9,775) Net loans 952,714 943,335 Mortgage servicing rights: Measured at fair value 11,517 14,649 Amortized 1,430 1,443 Premises and equipment, net 9,309 8,920 Goodwill 26,390 26,418 Derivative assets 14,203 10,770 Equity sacurities (includes $41,936 and $29,556 carried at fair value) (1) 68,241 55,148 Other assets 78,917 79,850 Totai assets (2} 1,927,555 1,895,883 Liabilities 349,534 936,636 344,496 Noninterest-bearing deposits Interest-bearing deposits 978,130 Total deposits 1,322,626 1,286,170 Short-term borowings 104,512 105,787 Derivative liabilities 9,079 8,499 Accrued expenses and other liabilities Long-term deb: 75,163 69,317 228,191 229,014 Total fabilities (3) 1,739,571 1,698,817 Equity Wells Fargo stockholders' equity: Preferred stock 21,549 23,214 Common stock- $1-2/3 par value, authorized 9,000,000,000 shares; Issued 5,481,811,474 shares 9,136 9,136 Additional paid-irn capital 61,049 60,685 Retained earnings 166,697 158,163 (6,336) (47,194) Cumalative other comprehensive income lloss) (1,311) (68,831) (1,143) Treasury stock -1,347,385,537 shares and 900,5S7,866 shares Unearned ESOP shares (1,502) Total Wells Fargo stockholders' equity 167,146 196,166 Noncontroling interests 838 900 Total equity 187,984 197,066 Total llabilitlesand equity 1,927,555 1,895,883 (1) Parenthetical arrounts represent assets and lalifities that we arerequired to carry at fair value or have electec the fair value optina. (2) Our consolidated assets at Decenber 31, 2019 and 2016, include the folloving assets of certain varlaln interest entities (VIES) that can anly be used to settle the dabilities of those VItis: Cach and duefrom banks, $16 million and $139 millionç Interest-bearing deposits with banks, $284 million and $8 millon; Debt securities, $540 milion and $562 million; Net loans, $13.2 bilion end $13.6 blion Derivative assets, S1milon and $0 milllon; Equity securities, $118 milion and $85 million; Other assets, $239milon and $227 million; end Total assets, $14.4 bilon and $14.6 billon, respectively. Prior period balances hae been conformed to current pertod preaentation. band! (3) Our consclidated liabilities at December 31, 2019 and 2018, include the following VIE Eabities for which the VIE crecitors do net have recourse to Welis Fargo: Sivort-termborrowings, $401 million and $493 million, Darivative Fabilities, $3 millior and $0 million; Accrued expenses end other liabišties, $235 rililon and $199 miliorç Long-term debt $587 million and $B16 midion, and Total liabiities, $12 bilien and $1.5 balion, respectivaly. Prior period balances have been confornved tocurrent period presentation. The accompanying notes are an integral part of these statements. Wells Fargo & Company and Subsidiaries Consolidated Statement of Cash Flows Year endec Decembar 31, (in millions) 2019 2018 2017 Cash flows from oporating activities: Net income before noncontrolling Interests 20,041 22,876 22,460 Acijustrnants to reconcile vet income to net casis pravided by operating activities: Prevision for credit losses 2,687 1,744 2,528 Changes in fair value of MSRS, MLHFS and LHFS carried at fair valuc Depreciation, amortization and accretion Olher net gains Stock based compensation Originations and purchases of mertgage loans held for sale Proceeds from sales of and paydowns on mortgage loans heki for sale Net change ine Debt and equity securities, held for trading Loans held for sale Deferred incume taxes 3,702 453 886 7,075 5,593 5,406 (5,500) (7,630) (1,518) 2,255 (152,832) 119,097 2,274 2,046 (181,269) (158,673) 112,718 134,984 35,054 (S60) 22,066 33,505 788 327 (3,246) (2,665) 3,034 1,9/0 666 (5,025 (1,214) Derivative assets and liabilities 1,513 Other assets 7,805 Other accrued expenses and liabilities 2,429 (865) 4,837 Net cash provided by operating activities 6,730 36,073 18,619 Cash flows from Iavesting activities: Net dsange in: Federal funds sold and securities purchased under resale agreements Available for-sale debt securitios: (21,933) (1,184) (21,497) 42,067 45,688 (103,656) Proceeds from sales 9,386 7,320 Prepayments and maturities 46,542 36,725 Purchases (57,015) (60,067) Held-to-maturity securities: 10,934 10,673 Paydowns and maturities Purchases 13,684 (8,649) Equity securities, not held fur traulng: Preceeds from sales and capital returns Purchases 6,143 6,242 5,451 (6,865) (6,433) (3,735) Loans: Loans originated by banking subsidiaries, net of principal colected Procceds from sales (inclucing participations) of loans heid for Irvestment Purchases (including participations) of loars Principal collected on nor:banik entilies'loans Loans originated by nonbank entities Procesds from salos of foreclosed assets and short sales (23,698) (18,619) 16,294 (2,088) 6,791 (6,482) 3,592 317 12,038 (2,033) 3,912 (5,274) 10,439 [3,702) 7,448 (6,814) 5,198 2,666 1,465 Otlher, nel (1) (779) (1,029) (29,631) (7,754) (13,152) Net cash used by investing activities Cash flows from financing activitles: Net change in: Deposits Short-term berrowings Long-term debt 36,137 (1,275) (48,034) 29,912 2,531 14,020 47,595 (40,565) Proceeds from isuance 53,381 13,575 (60,996) (80,802) Repayment Preferred stock: Proceeds from issuance 677 (2,150) (1,550) (1,391) Redeemed Cash dividends pakd (1,622) (1,629) Common stock: Proceeds from issuance Stock tendered fo: payment of withholding taxes Repurchased Cash dividends paki Net change in noncontrolling interests 380 632 1,211 (302) (24,533) (8,198) (513) [276) (331) (20.633) (7,692) (393) (9,908) (7.480) (462) (248) 30 Other, net (133) Net cash used by financing activities (9,136) (70,979) (10,920) Net change in cash, cash equivalents, and restricted cash (32,037) (42,660) (5,453) 173,287 141,250 Cash, cash equivalents, and restricted cash at beginning of year 215,947 221,400 Cash, cash equivalents, and restricted cashat end of year 173,287 215,947 Supplementalcash flow disclosures: Cash paid for interest Cash paid for bncome taxes 18,834 14,366 9,103 7,557 1,977 6,592 (1) Prior periods have beer. revised to conform to the current period presentation. The accompanying notes are an integral part of these statements. See Note 1 (Summary of Significant Accounting Policies) for noncash activities. In addition to residential MSRS included in the previous table, we have a small portfolio of commercial MSRS which are carried at LOCOM with a fair value of $1.9 billion and $2.3 billion at December 31, 2019 and 2018, respectively. Prepayment assumptions do not significantly impact values of commercial MSRS and commercial mortgage bonds as most commercial loans include contractual restrictions on prepayment. Servicing costs are not a driver of our MSR value as we are typically primary or master servicer; the higher costs of servicing delinquent and foreclosed loans is generally born by the special servicer. The primary economic driver impacting the fair value of our commercial MSRS is forward interest rates, which are derived from market observable yield curves used to price capital markets instruments. Market interest rates significantly affect interest earned on custodial deposit balances. The sensitivity of the current fair value to an immediate adverse 25% change in the assumption about interest earned on deposit balances at December 31, 2019 and 2018, results in a decrease in fair value of $205 million and $320 million, respectively. See Note 11 (Mortgage Banking Activities) for further information on our commercial MSRS. The sensitivities in the preceding paragraph and table are hypothetical and caution should be exercised when relying on this data. Changes in value based on variations in assumptions generally cannot be extrapolated because the relationship of the change in the assumption to the change in value may not be linear. Also, the effect of a variation in a particular assumption on the value of the other interests held is calculated independently without changing any other assumptions. In reality, changes in one factor may result in changes in others (for example, changes in prepayment speed estimates could result in changes in the credit losses), which might magnify or counteract the sensitivities. Off-Balance Sheet Loans Table 10.7 presents information about the principal balances of off-balance sheet loans that were sold or securitized, including residential mortgage loans sold to FNMA, FHLMC, GNMA and other investors, for which we have some form of continuing involvement (including servicer). Delinquent loans include loans 90 days or more past due and loans in bankruptcy, regardless of delinquency status. For loans sold or securitized where servicing is our only form of continuing involvement, we would only experience a loss if we were required to repurchase a delinquent loan or foreclosed asset due to a breach in representations and warranties associated with our loan sale or servicing contracts. Table 10.7: Off-Balance Sheet Loans Sold or Securitized Net charge-offs (3) Delinguent loans and foredosed assets (1) Total loans Year ended December 31, December 31, December 31, (in millions} 2019 2018 2019 2018 2019 2018 Commercial: Real estate mortgage 2$ 112,507 105,173 776 1,008 179 739 Total commerciał 112,507 105,173 776 1,008 179 739 Consumer: Real estate 1-4 family first mortgage 1,008,446 1,097,128 6,664 8,947 229 466 Real estate 1-4 family junior lien mortgage 13 2 Total consumer 1,008,459 1,097,128 6,666 8,947 229 466 Total off balance sheet sold or securitized loans (2) 1,120,966 1,202,301 7,442 9,955 408 1,205 (1) Includes $492 million and $675 tmal'on of commercial foreclosed assets and $356 milion and $582 milion of consumer foreciosed assets at December 31, 2019 and 2018, respectively. (2) At December 31, 2019 and 2018, the table includes total loans of $1.0 trillion and $1.1 trillion, delinquent ioans of $5.2 billion and $6.4 billlon, and foreclosed assets of $251 million and $442 milion, respectively, for FNMA, FHI.MC and GNMA. (3) Net charge-offs exclude loans sold to FNMA, FHLMCand GNMA as we do not service or manage the underlying real estate upon forectosure and, as stuch, do not have access to net charge-off information.
Expert Answer:

Related Book For 

Financial and Managerial Accounting the basis for business decisions
ISBN: 978-1259692406
18th edition
Authors: Jan Williams, Susan Haka, Mark Bettner, Joseph Carcello
Posted Date:
Students also viewed these accounting questions
-
In the year ended December 31 2017 Hexham Inc Hexham reported net income of 5 100 000 which included a writeoff of 1 377 000 of company assets During 2017 accounts receivable increased by 137 700...
-
The income statement for Delta-tec Inc. for the year ended December 31, 2016, was as follows: Delta-tec Inc. Income Statement (selected items) For the Year Ended December 31, 2016 1 Income from...
-
Krauss Companys income statement for the year ended December 31, 2008, contained the following condensed information. Krausss balance sheet contained the following comparative data at December 31....
-
What are the advantages and disadvantages of the net realizable method of allocating joint costs?
-
A unity feedback system has a loop transfer function Sketch the root locus. Determine the gain K when the complex roots of the characteristic equation have a ζ approximately equal to...
-
Liquid water at 380 K and 5 MPa flows at a rate of 1 gal/min in a nominal 1-in, schedule-40 pipe (of 1.049-in inside diameter). Determine the average velocity (m/s) of the water.
-
The mean room and board expense per year at four-year colleges is \($10,453\). You randomly select 9 four-year colleges. What is the probability that the mean room and board is less than \($10,750?\)...
-
AARP reported on a study conducted to learn how long it takes individuals to prepare their federal income tax return (AARP Bulletin, April 2008). The data contained in the file named TaxReturn are...
-
One capital investment that State Insurance Company Limited might need to secure financing for in the coming fiscal year is the purchase of a new claims processing system. The estimated cost of the...
-
At time t = 0, the baseball player releases a ball with the initial conditions shown in the figure. Determine the quantities r, r, r, , , and , all relative to the x-y coordinate system shown, at...
-
Critical thinking supports effective communication, supported judgment, reasoning, reflection, and justified problem-solving for a particular mode of thought or thinking. 1. Which leadership trait...
-
You have a sample that contains \(9.70 \times 10^{21}\) particles of an unknown gas in a chamber that has a volume of \(0.0100 \mathrm{~m}^{3}\). The initial pressure in the chamber is \(1.84 \times...
-
A \(1.00-\mathrm{mol}\) sample of an ideal diatomic gas in which the gas particles both translate and rotate is initially at \(600 \mathrm{~K}\). Energy is then added thermally to the sample until...
-
A chamber fitted with a piston contains \(1.00 \mathrm{~mol}\) of a monatomic ideal gas that is taken from an initial state i to a final state \(f\) via states 1 and 2 . The chamber volume is...
-
As part of a physics experiment, air under high pressure is allowed to expand isentropically out of a metal can and into an empty plastic bag. When the expansion is complete, the bag and contents are...
-
Two identical thermally insulated spherical tanks, A and B, are connected by a valve. Initially tank A contains \(10 \mathrm{~mol}\) of an ideal diatomic gas, tank B is evacuated, and the valve is...
-
What type of changes are essential in establishing the role of the social work profession in environmental research, policy, and practice? Explain.
-
Use of the contraceptive Depo Provera appears to triple women's risk of infection with chlamydia and gonorrhea , a study reports today. An estimated 20 million to 30 million women worldwide use Depo...
-
Refer to the Demonstration Problem illustrated in the previous chapter. Prepare a 10-column worksheet for Internet Consulting Service, Inc., dated December 31, current year. At the bottom of your...
-
What factors might a company consider in establishing a minimum required return on an investment proposal?
-
Joy Sun organized Ray Beam, Inc., in January 2015. The corporation immediately issued at $15 per share one-half of its 260,000 authorized shares of $1 par value common stock. On January 2, 2016, the...
-
The position of a particle undergoing simple harmonic motion is given by \(x(t)=20 \cos (8 \pi t)\), where \(x\) is in millimeters and \(t\) is in seconds. For this motion, what are the (a)...
-
Fill in the blanks to make the following statements correct. a. It is difficult to compare two or more data series when absolute numbers and different units are used. For that reason we construct...
-
Fill in the blanks to make the following statements correct. a. On a graph with Y on the vertical axis and X on the horizontal axis, the slope of a straight line is calculated as ___________. b. In...

Study smarter with the SolutionInn App