

Review the most recent annual reports of The Coca-Cola Company and PepsiCo focusing on the balance...
Fantastic news! We've Found the answer you've been seeking!
Question:
Transcribed Image Text:
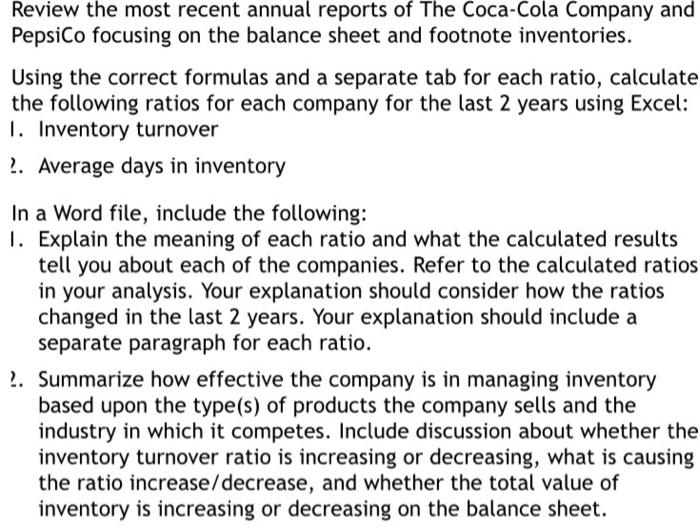
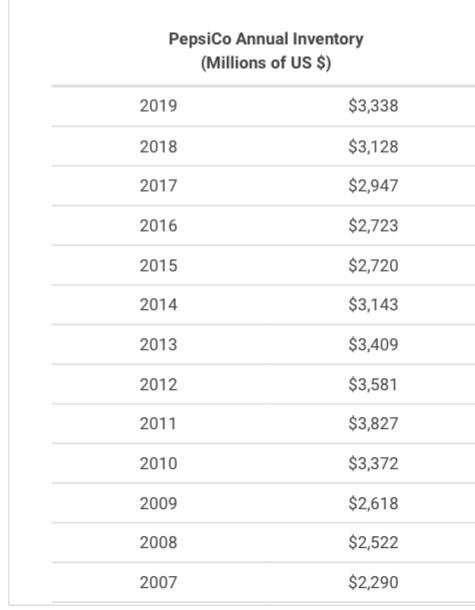
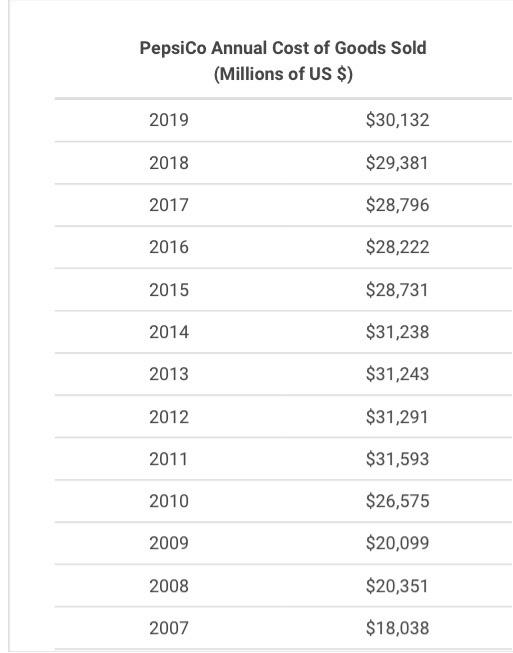
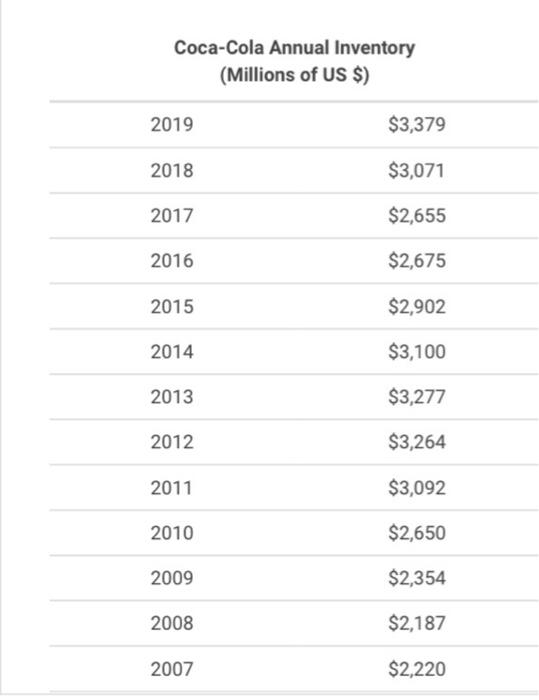
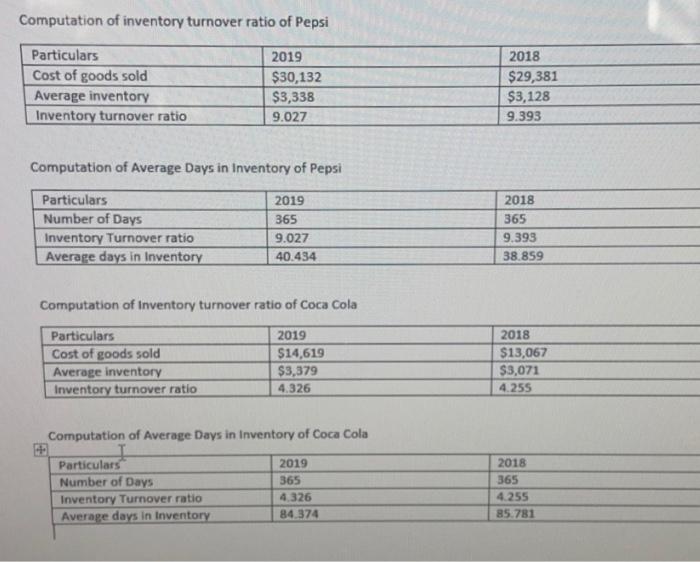
Review the most recent annual reports of The Coca-Cola Company and PepsiCo focusing on the balance sheet and footnote inventories. Using the correct formulas and a separate tab for each ratio, calculate the following ratios for each company for the last 2 years using Excel: 1. Inventory turnover 2. Average days in inventory In a Word file, include the following: 1. Explain the meaning of each ratio and what the calculated results tell you about each of the companies. Refer to the calculated ratios in your analysis. Your explanation should consider how the ratios changed in the last 2 years. Your explanation should include a separate paragraph for each ratio. 2. Summarize how effective the company is in managing inventory based upon the type(s) of products the company sells and the industry in which it competes. Include discussion about whether the inventory turnover ratio is increasing or decreasing, what is causing the ratio increase/decrease, and whether the total value of inventory is increasing or decreasing on the balance sheet. Pepsico Annual Inventory (Millions of US $) 2019 $3,338 2018 $3,128 2017 $2,947 2016 $2,723 2015 $2,720 2014 $3,143 2013 $3,409 2012 $3,581 2011 $3,827 2010 $3,372 2009 $2,618 2008 $2,522 2007 $2,290 Pepsico Annual Cost of Goods Sold (Millions of US $) 2019 $30,132 2018 $29,381 2017 $28,796 2016 $28,222 2015 $28,731 2014 $31,238 2013 $31,243 2012 $31,291 2011 $31,593 2010 $26,575 2009 $20,099 2008 $20,351 2007 $18,038 Coca-Cola Annual Cost of Goods Sold (Millions of US $) 2019 $14,619 2018 $13,067 2017 $13,721 2016 $16,465 2015 $17,482 2014 $17,889 2013 $18,421 2012 $19,053 2011 $18,215 2010 $12,693 2009 $11,088 2008 $11,374 2007 $10,406 Coca-Cola Annual Inventory (Millions of US $) 2019 $3,379 2018 $3,071 2017 $2,655 2016 $2,675 2015 $2,902 2014 $3,100 2013 $3,277 2012 $3,264 2011 $3,092 2010 $2,650 2009 $2,354 2008 $2,187 2007 $2,220 Computation of inventory turnover ratio of Pepsi Particulars 2019 2018 Cost of goods sold $30,132 $29,381 Average inventory Inventory turnover ratio $3,338 $3,128 9.027 9.393 Computation of Average Days in Inventory of Pepsi Particulars 2019 2018 Number of Days 365 365 Inventory Turnover ratio 9.027 9.393 Average days in Inventory 40.434 38.859 Computation of Inventory turnover ratio of Coca Cola Particulars 2019 2018 Cost of goods sold Average inventory Inventory turnover ratio $14,619 $3,379 $13,067 $3,071 4.326 4.255 Computation of Average Days in Inventory of Coca Cola Particulars Number of Days 2019 2018 365 365 Inventory Turnover ratio Average days in Inventory 4.326 4.255 84.374 85.781 Review the most recent annual reports of The Coca-Cola Company and PepsiCo focusing on the balance sheet and footnote inventories. Using the correct formulas and a separate tab for each ratio, calculate the following ratios for each company for the last 2 years using Excel: 1. Inventory turnover 2. Average days in inventory In a Word file, include the following: 1. Explain the meaning of each ratio and what the calculated results tell you about each of the companies. Refer to the calculated ratios in your analysis. Your explanation should consider how the ratios changed in the last 2 years. Your explanation should include a separate paragraph for each ratio. 2. Summarize how effective the company is in managing inventory based upon the type(s) of products the company sells and the industry in which it competes. Include discussion about whether the inventory turnover ratio is increasing or decreasing, what is causing the ratio increase/decrease, and whether the total value of inventory is increasing or decreasing on the balance sheet. Pepsico Annual Inventory (Millions of US $) 2019 $3,338 2018 $3,128 2017 $2,947 2016 $2,723 2015 $2,720 2014 $3,143 2013 $3,409 2012 $3,581 2011 $3,827 2010 $3,372 2009 $2,618 2008 $2,522 2007 $2,290 Pepsico Annual Cost of Goods Sold (Millions of US $) 2019 $30,132 2018 $29,381 2017 $28,796 2016 $28,222 2015 $28,731 2014 $31,238 2013 $31,243 2012 $31,291 2011 $31,593 2010 $26,575 2009 $20,099 2008 $20,351 2007 $18,038 Coca-Cola Annual Cost of Goods Sold (Millions of US $) 2019 $14,619 2018 $13,067 2017 $13,721 2016 $16,465 2015 $17,482 2014 $17,889 2013 $18,421 2012 $19,053 2011 $18,215 2010 $12,693 2009 $11,088 2008 $11,374 2007 $10,406 Coca-Cola Annual Inventory (Millions of US $) 2019 $3,379 2018 $3,071 2017 $2,655 2016 $2,675 2015 $2,902 2014 $3,100 2013 $3,277 2012 $3,264 2011 $3,092 2010 $2,650 2009 $2,354 2008 $2,187 2007 $2,220 Computation of inventory turnover ratio of Pepsi Particulars 2019 2018 Cost of goods sold $30,132 $29,381 Average inventory Inventory turnover ratio $3,338 $3,128 9.027 9.393 Computation of Average Days in Inventory of Pepsi Particulars 2019 2018 Number of Days 365 365 Inventory Turnover ratio 9.027 9.393 Average days in Inventory 40.434 38.859 Computation of Inventory turnover ratio of Coca Cola Particulars 2019 2018 Cost of goods sold Average inventory Inventory turnover ratio $14,619 $3,379 $13,067 $3,071 4.326 4.255 Computation of Average Days in Inventory of Coca Cola Particulars Number of Days 2019 2018 365 365 Inventory Turnover ratio Average days in Inventory 4.326 4.255 84.374 85.781 Review the most recent annual reports of The Coca-Cola Company and PepsiCo focusing on the balance sheet and footnote inventories. Using the correct formulas and a separate tab for each ratio, calculate the following ratios for each company for the last 2 years using Excel: 1. Inventory turnover 2. Average days in inventory In a Word file, include the following: 1. Explain the meaning of each ratio and what the calculated results tell you about each of the companies. Refer to the calculated ratios in your analysis. Your explanation should consider how the ratios changed in the last 2 years. Your explanation should include a separate paragraph for each ratio. 2. Summarize how effective the company is in managing inventory based upon the type(s) of products the company sells and the industry in which it competes. Include discussion about whether the inventory turnover ratio is increasing or decreasing, what is causing the ratio increase/decrease, and whether the total value of inventory is increasing or decreasing on the balance sheet. Pepsico Annual Inventory (Millions of US $) 2019 $3,338 2018 $3,128 2017 $2,947 2016 $2,723 2015 $2,720 2014 $3,143 2013 $3,409 2012 $3,581 2011 $3,827 2010 $3,372 2009 $2,618 2008 $2,522 2007 $2,290 Pepsico Annual Cost of Goods Sold (Millions of US $) 2019 $30,132 2018 $29,381 2017 $28,796 2016 $28,222 2015 $28,731 2014 $31,238 2013 $31,243 2012 $31,291 2011 $31,593 2010 $26,575 2009 $20,099 2008 $20,351 2007 $18,038 Coca-Cola Annual Cost of Goods Sold (Millions of US $) 2019 $14,619 2018 $13,067 2017 $13,721 2016 $16,465 2015 $17,482 2014 $17,889 2013 $18,421 2012 $19,053 2011 $18,215 2010 $12,693 2009 $11,088 2008 $11,374 2007 $10,406 Coca-Cola Annual Inventory (Millions of US $) 2019 $3,379 2018 $3,071 2017 $2,655 2016 $2,675 2015 $2,902 2014 $3,100 2013 $3,277 2012 $3,264 2011 $3,092 2010 $2,650 2009 $2,354 2008 $2,187 2007 $2,220 Computation of inventory turnover ratio of Pepsi Particulars 2019 2018 Cost of goods sold $30,132 $29,381 Average inventory Inventory turnover ratio $3,338 $3,128 9.027 9.393 Computation of Average Days in Inventory of Pepsi Particulars 2019 2018 Number of Days 365 365 Inventory Turnover ratio 9.027 9.393 Average days in Inventory 40.434 38.859 Computation of Inventory turnover ratio of Coca Cola Particulars 2019 2018 Cost of goods sold Average inventory Inventory turnover ratio $14,619 $3,379 $13,067 $3,071 4.326 4.255 Computation of Average Days in Inventory of Coca Cola Particulars Number of Days 2019 2018 365 365 Inventory Turnover ratio Average days in Inventory 4.326 4.255 84.374 85.781 Review the most recent annual reports of The Coca-Cola Company and PepsiCo focusing on the balance sheet and footnote inventories. Using the correct formulas and a separate tab for each ratio, calculate the following ratios for each company for the last 2 years using Excel: 1. Inventory turnover 2. Average days in inventory In a Word file, include the following: 1. Explain the meaning of each ratio and what the calculated results tell you about each of the companies. Refer to the calculated ratios in your analysis. Your explanation should consider how the ratios changed in the last 2 years. Your explanation should include a separate paragraph for each ratio. 2. Summarize how effective the company is in managing inventory based upon the type(s) of products the company sells and the industry in which it competes. Include discussion about whether the inventory turnover ratio is increasing or decreasing, what is causing the ratio increase/decrease, and whether the total value of inventory is increasing or decreasing on the balance sheet. Pepsico Annual Inventory (Millions of US $) 2019 $3,338 2018 $3,128 2017 $2,947 2016 $2,723 2015 $2,720 2014 $3,143 2013 $3,409 2012 $3,581 2011 $3,827 2010 $3,372 2009 $2,618 2008 $2,522 2007 $2,290 Pepsico Annual Cost of Goods Sold (Millions of US $) 2019 $30,132 2018 $29,381 2017 $28,796 2016 $28,222 2015 $28,731 2014 $31,238 2013 $31,243 2012 $31,291 2011 $31,593 2010 $26,575 2009 $20,099 2008 $20,351 2007 $18,038 Coca-Cola Annual Cost of Goods Sold (Millions of US $) 2019 $14,619 2018 $13,067 2017 $13,721 2016 $16,465 2015 $17,482 2014 $17,889 2013 $18,421 2012 $19,053 2011 $18,215 2010 $12,693 2009 $11,088 2008 $11,374 2007 $10,406 Coca-Cola Annual Inventory (Millions of US $) 2019 $3,379 2018 $3,071 2017 $2,655 2016 $2,675 2015 $2,902 2014 $3,100 2013 $3,277 2012 $3,264 2011 $3,092 2010 $2,650 2009 $2,354 2008 $2,187 2007 $2,220 Computation of inventory turnover ratio of Pepsi Particulars 2019 2018 Cost of goods sold $30,132 $29,381 Average inventory Inventory turnover ratio $3,338 $3,128 9.027 9.393 Computation of Average Days in Inventory of Pepsi Particulars 2019 2018 Number of Days 365 365 Inventory Turnover ratio 9.027 9.393 Average days in Inventory 40.434 38.859 Computation of Inventory turnover ratio of Coca Cola Particulars 2019 2018 Cost of goods sold Average inventory Inventory turnover ratio $14,619 $3,379 $13,067 $3,071 4.326 4.255 Computation of Average Days in Inventory of Coca Cola Particulars Number of Days 2019 2018 365 365 Inventory Turnover ratio Average days in Inventory 4.326 4.255 84.374 85.781 Review the most recent annual reports of The Coca-Cola Company and PepsiCo focusing on the balance sheet and footnote inventories. Using the correct formulas and a separate tab for each ratio, calculate the following ratios for each company for the last 2 years using Excel: 1. Inventory turnover 2. Average days in inventory In a Word file, include the following: 1. Explain the meaning of each ratio and what the calculated results tell you about each of the companies. Refer to the calculated ratios in your analysis. Your explanation should consider how the ratios changed in the last 2 years. Your explanation should include a separate paragraph for each ratio. 2. Summarize how effective the company is in managing inventory based upon the type(s) of products the company sells and the industry in which it competes. Include discussion about whether the inventory turnover ratio is increasing or decreasing, what is causing the ratio increase/decrease, and whether the total value of inventory is increasing or decreasing on the balance sheet. Pepsico Annual Inventory (Millions of US $) 2019 $3,338 2018 $3,128 2017 $2,947 2016 $2,723 2015 $2,720 2014 $3,143 2013 $3,409 2012 $3,581 2011 $3,827 2010 $3,372 2009 $2,618 2008 $2,522 2007 $2,290 Pepsico Annual Cost of Goods Sold (Millions of US $) 2019 $30,132 2018 $29,381 2017 $28,796 2016 $28,222 2015 $28,731 2014 $31,238 2013 $31,243 2012 $31,291 2011 $31,593 2010 $26,575 2009 $20,099 2008 $20,351 2007 $18,038 Coca-Cola Annual Cost of Goods Sold (Millions of US $) 2019 $14,619 2018 $13,067 2017 $13,721 2016 $16,465 2015 $17,482 2014 $17,889 2013 $18,421 2012 $19,053 2011 $18,215 2010 $12,693 2009 $11,088 2008 $11,374 2007 $10,406 Coca-Cola Annual Inventory (Millions of US $) 2019 $3,379 2018 $3,071 2017 $2,655 2016 $2,675 2015 $2,902 2014 $3,100 2013 $3,277 2012 $3,264 2011 $3,092 2010 $2,650 2009 $2,354 2008 $2,187 2007 $2,220 Computation of inventory turnover ratio of Pepsi Particulars 2019 2018 Cost of goods sold $30,132 $29,381 Average inventory Inventory turnover ratio $3,338 $3,128 9.027 9.393 Computation of Average Days in Inventory of Pepsi Particulars 2019 2018 Number of Days 365 365 Inventory Turnover ratio 9.027 9.393 Average days in Inventory 40.434 38.859 Computation of Inventory turnover ratio of Coca Cola Particulars 2019 2018 Cost of goods sold Average inventory Inventory turnover ratio $14,619 $3,379 $13,067 $3,071 4.326 4.255 Computation of Average Days in Inventory of Coca Cola Particulars Number of Days 2019 2018 365 365 Inventory Turnover ratio Average days in Inventory 4.326 4.255 84.374 85.781 Review the most recent annual reports of The Coca-Cola Company and PepsiCo focusing on the balance sheet and footnote inventories. Using the correct formulas and a separate tab for each ratio, calculate the following ratios for each company for the last 2 years using Excel: 1. Inventory turnover 2. Average days in inventory In a Word file, include the following: 1. Explain the meaning of each ratio and what the calculated results tell you about each of the companies. Refer to the calculated ratios in your analysis. Your explanation should consider how the ratios changed in the last 2 years. Your explanation should include a separate paragraph for each ratio. 2. Summarize how effective the company is in managing inventory based upon the type(s) of products the company sells and the industry in which it competes. Include discussion about whether the inventory turnover ratio is increasing or decreasing, what is causing the ratio increase/decrease, and whether the total value of inventory is increasing or decreasing on the balance sheet. Pepsico Annual Inventory (Millions of US $) 2019 $3,338 2018 $3,128 2017 $2,947 2016 $2,723 2015 $2,720 2014 $3,143 2013 $3,409 2012 $3,581 2011 $3,827 2010 $3,372 2009 $2,618 2008 $2,522 2007 $2,290 Pepsico Annual Cost of Goods Sold (Millions of US $) 2019 $30,132 2018 $29,381 2017 $28,796 2016 $28,222 2015 $28,731 2014 $31,238 2013 $31,243 2012 $31,291 2011 $31,593 2010 $26,575 2009 $20,099 2008 $20,351 2007 $18,038 Coca-Cola Annual Cost of Goods Sold (Millions of US $) 2019 $14,619 2018 $13,067 2017 $13,721 2016 $16,465 2015 $17,482 2014 $17,889 2013 $18,421 2012 $19,053 2011 $18,215 2010 $12,693 2009 $11,088 2008 $11,374 2007 $10,406 Coca-Cola Annual Inventory (Millions of US $) 2019 $3,379 2018 $3,071 2017 $2,655 2016 $2,675 2015 $2,902 2014 $3,100 2013 $3,277 2012 $3,264 2011 $3,092 2010 $2,650 2009 $2,354 2008 $2,187 2007 $2,220 Computation of inventory turnover ratio of Pepsi Particulars 2019 2018 Cost of goods sold $30,132 $29,381 Average inventory Inventory turnover ratio $3,338 $3,128 9.027 9.393 Computation of Average Days in Inventory of Pepsi Particulars 2019 2018 Number of Days 365 365 Inventory Turnover ratio 9.027 9.393 Average days in Inventory 40.434 38.859 Computation of Inventory turnover ratio of Coca Cola Particulars 2019 2018 Cost of goods sold Average inventory Inventory turnover ratio $14,619 $3,379 $13,067 $3,071 4.326 4.255 Computation of Average Days in Inventory of Coca Cola Particulars Number of Days 2019 2018 365 365 Inventory Turnover ratio Average days in Inventory 4.326 4.255 84.374 85.781 Review the most recent annual reports of The Coca-Cola Company and PepsiCo focusing on the balance sheet and footnote inventories. Using the correct formulas and a separate tab for each ratio, calculate the following ratios for each company for the last 2 years using Excel: 1. Inventory turnover 2. Average days in inventory In a Word file, include the following: 1. Explain the meaning of each ratio and what the calculated results tell you about each of the companies. Refer to the calculated ratios in your analysis. Your explanation should consider how the ratios changed in the last 2 years. Your explanation should include a separate paragraph for each ratio. 2. Summarize how effective the company is in managing inventory based upon the type(s) of products the company sells and the industry in which it competes. Include discussion about whether the inventory turnover ratio is increasing or decreasing, what is causing the ratio increase/decrease, and whether the total value of inventory is increasing or decreasing on the balance sheet. Pepsico Annual Inventory (Millions of US $) 2019 $3,338 2018 $3,128 2017 $2,947 2016 $2,723 2015 $2,720 2014 $3,143 2013 $3,409 2012 $3,581 2011 $3,827 2010 $3,372 2009 $2,618 2008 $2,522 2007 $2,290 Pepsico Annual Cost of Goods Sold (Millions of US $) 2019 $30,132 2018 $29,381 2017 $28,796 2016 $28,222 2015 $28,731 2014 $31,238 2013 $31,243 2012 $31,291 2011 $31,593 2010 $26,575 2009 $20,099 2008 $20,351 2007 $18,038 Coca-Cola Annual Cost of Goods Sold (Millions of US $) 2019 $14,619 2018 $13,067 2017 $13,721 2016 $16,465 2015 $17,482 2014 $17,889 2013 $18,421 2012 $19,053 2011 $18,215 2010 $12,693 2009 $11,088 2008 $11,374 2007 $10,406 Coca-Cola Annual Inventory (Millions of US $) 2019 $3,379 2018 $3,071 2017 $2,655 2016 $2,675 2015 $2,902 2014 $3,100 2013 $3,277 2012 $3,264 2011 $3,092 2010 $2,650 2009 $2,354 2008 $2,187 2007 $2,220 Computation of inventory turnover ratio of Pepsi Particulars 2019 2018 Cost of goods sold $30,132 $29,381 Average inventory Inventory turnover ratio $3,338 $3,128 9.027 9.393 Computation of Average Days in Inventory of Pepsi Particulars 2019 2018 Number of Days 365 365 Inventory Turnover ratio 9.027 9.393 Average days in Inventory 40.434 38.859 Computation of Inventory turnover ratio of Coca Cola Particulars 2019 2018 Cost of goods sold Average inventory Inventory turnover ratio $14,619 $3,379 $13,067 $3,071 4.326 4.255 Computation of Average Days in Inventory of Coca Cola Particulars Number of Days 2019 2018 365 365 Inventory Turnover ratio Average days in Inventory 4.326 4.255 84.374 85.781 Review the most recent annual reports of The Coca-Cola Company and PepsiCo focusing on the balance sheet and footnote inventories. Using the correct formulas and a separate tab for each ratio, calculate the following ratios for each company for the last 2 years using Excel: 1. Inventory turnover 2. Average days in inventory In a Word file, include the following: 1. Explain the meaning of each ratio and what the calculated results tell you about each of the companies. Refer to the calculated ratios in your analysis. Your explanation should consider how the ratios changed in the last 2 years. Your explanation should include a separate paragraph for each ratio. 2. Summarize how effective the company is in managing inventory based upon the type(s) of products the company sells and the industry in which it competes. Include discussion about whether the inventory turnover ratio is increasing or decreasing, what is causing the ratio increase/decrease, and whether the total value of inventory is increasing or decreasing on the balance sheet. Pepsico Annual Inventory (Millions of US $) 2019 $3,338 2018 $3,128 2017 $2,947 2016 $2,723 2015 $2,720 2014 $3,143 2013 $3,409 2012 $3,581 2011 $3,827 2010 $3,372 2009 $2,618 2008 $2,522 2007 $2,290 Pepsico Annual Cost of Goods Sold (Millions of US $) 2019 $30,132 2018 $29,381 2017 $28,796 2016 $28,222 2015 $28,731 2014 $31,238 2013 $31,243 2012 $31,291 2011 $31,593 2010 $26,575 2009 $20,099 2008 $20,351 2007 $18,038 Coca-Cola Annual Cost of Goods Sold (Millions of US $) 2019 $14,619 2018 $13,067 2017 $13,721 2016 $16,465 2015 $17,482 2014 $17,889 2013 $18,421 2012 $19,053 2011 $18,215 2010 $12,693 2009 $11,088 2008 $11,374 2007 $10,406 Coca-Cola Annual Inventory (Millions of US $) 2019 $3,379 2018 $3,071 2017 $2,655 2016 $2,675 2015 $2,902 2014 $3,100 2013 $3,277 2012 $3,264 2011 $3,092 2010 $2,650 2009 $2,354 2008 $2,187 2007 $2,220 Computation of inventory turnover ratio of Pepsi Particulars 2019 2018 Cost of goods sold $30,132 $29,381 Average inventory Inventory turnover ratio $3,338 $3,128 9.027 9.393 Computation of Average Days in Inventory of Pepsi Particulars 2019 2018 Number of Days 365 365 Inventory Turnover ratio 9.027 9.393 Average days in Inventory 40.434 38.859 Computation of Inventory turnover ratio of Coca Cola Particulars 2019 2018 Cost of goods sold Average inventory Inventory turnover ratio $14,619 $3,379 $13,067 $3,071 4.326 4.255 Computation of Average Days in Inventory of Coca Cola Particulars Number of Days 2019 2018 365 365 Inventory Turnover ratio Average days in Inventory 4.326 4.255 84.374 85.781 Review the most recent annual reports of The Coca-Cola Company and PepsiCo focusing on the balance sheet and footnote inventories. Using the correct formulas and a separate tab for each ratio, calculate the following ratios for each company for the last 2 years using Excel: 1. Inventory turnover 2. Average days in inventory In a Word file, include the following: 1. Explain the meaning of each ratio and what the calculated results tell you about each of the companies. Refer to the calculated ratios in your analysis. Your explanation should consider how the ratios changed in the last 2 years. Your explanation should include a separate paragraph for each ratio. 2. Summarize how effective the company is in managing inventory based upon the type(s) of products the company sells and the industry in which it competes. Include discussion about whether the inventory turnover ratio is increasing or decreasing, what is causing the ratio increase/decrease, and whether the total value of inventory is increasing or decreasing on the balance sheet. Pepsico Annual Inventory (Millions of US $) 2019 $3,338 2018 $3,128 2017 $2,947 2016 $2,723 2015 $2,720 2014 $3,143 2013 $3,409 2012 $3,581 2011 $3,827 2010 $3,372 2009 $2,618 2008 $2,522 2007 $2,290 Pepsico Annual Cost of Goods Sold (Millions of US $) 2019 $30,132 2018 $29,381 2017 $28,796 2016 $28,222 2015 $28,731 2014 $31,238 2013 $31,243 2012 $31,291 2011 $31,593 2010 $26,575 2009 $20,099 2008 $20,351 2007 $18,038 Coca-Cola Annual Cost of Goods Sold (Millions of US $) 2019 $14,619 2018 $13,067 2017 $13,721 2016 $16,465 2015 $17,482 2014 $17,889 2013 $18,421 2012 $19,053 2011 $18,215 2010 $12,693 2009 $11,088 2008 $11,374 2007 $10,406 Coca-Cola Annual Inventory (Millions of US $) 2019 $3,379 2018 $3,071 2017 $2,655 2016 $2,675 2015 $2,902 2014 $3,100 2013 $3,277 2012 $3,264 2011 $3,092 2010 $2,650 2009 $2,354 2008 $2,187 2007 $2,220 Computation of inventory turnover ratio of Pepsi Particulars 2019 2018 Cost of goods sold $30,132 $29,381 Average inventory Inventory turnover ratio $3,338 $3,128 9.027 9.393 Computation of Average Days in Inventory of Pepsi Particulars 2019 2018 Number of Days 365 365 Inventory Turnover ratio 9.027 9.393 Average days in Inventory 40.434 38.859 Computation of Inventory turnover ratio of Coca Cola Particulars 2019 2018 Cost of goods sold Average inventory Inventory turnover ratio $14,619 $3,379 $13,067 $3,071 4.326 4.255 Computation of Average Days in Inventory of Coca Cola Particulars Number of Days 2019 2018 365 365 Inventory Turnover ratio Average days in Inventory 4.326 4.255 84.374 85.781 Review the most recent annual reports of The Coca-Cola Company and PepsiCo focusing on the balance sheet and footnote inventories. Using the correct formulas and a separate tab for each ratio, calculate the following ratios for each company for the last 2 years using Excel: 1. Inventory turnover 2. Average days in inventory In a Word file, include the following: 1. Explain the meaning of each ratio and what the calculated results tell you about each of the companies. Refer to the calculated ratios in your analysis. Your explanation should consider how the ratios changed in the last 2 years. Your explanation should include a separate paragraph for each ratio. 2. Summarize how effective the company is in managing inventory based upon the type(s) of products the company sells and the industry in which it competes. Include discussion about whether the inventory turnover ratio is increasing or decreasing, what is causing the ratio increase/decrease, and whether the total value of inventory is increasing or decreasing on the balance sheet. Pepsico Annual Inventory (Millions of US $) 2019 $3,338 2018 $3,128 2017 $2,947 2016 $2,723 2015 $2,720 2014 $3,143 2013 $3,409 2012 $3,581 2011 $3,827 2010 $3,372 2009 $2,618 2008 $2,522 2007 $2,290 Pepsico Annual Cost of Goods Sold (Millions of US $) 2019 $30,132 2018 $29,381 2017 $28,796 2016 $28,222 2015 $28,731 2014 $31,238 2013 $31,243 2012 $31,291 2011 $31,593 2010 $26,575 2009 $20,099 2008 $20,351 2007 $18,038 Coca-Cola Annual Cost of Goods Sold (Millions of US $) 2019 $14,619 2018 $13,067 2017 $13,721 2016 $16,465 2015 $17,482 2014 $17,889 2013 $18,421 2012 $19,053 2011 $18,215 2010 $12,693 2009 $11,088 2008 $11,374 2007 $10,406 Coca-Cola Annual Inventory (Millions of US $) 2019 $3,379 2018 $3,071 2017 $2,655 2016 $2,675 2015 $2,902 2014 $3,100 2013 $3,277 2012 $3,264 2011 $3,092 2010 $2,650 2009 $2,354 2008 $2,187 2007 $2,220 Computation of inventory turnover ratio of Pepsi Particulars 2019 2018 Cost of goods sold $30,132 $29,381 Average inventory Inventory turnover ratio $3,338 $3,128 9.027 9.393 Computation of Average Days in Inventory of Pepsi Particulars 2019 2018 Number of Days 365 365 Inventory Turnover ratio 9.027 9.393 Average days in Inventory 40.434 38.859 Computation of Inventory turnover ratio of Coca Cola Particulars 2019 2018 Cost of goods sold Average inventory Inventory turnover ratio $14,619 $3,379 $13,067 $3,071 4.326 4.255 Computation of Average Days in Inventory of Coca Cola Particulars Number of Days 2019 2018 365 365 Inventory Turnover ratio Average days in Inventory 4.326 4.255 84.374 85.781 Review the most recent annual reports of The Coca-Cola Company and PepsiCo focusing on the balance sheet and footnote inventories. Using the correct formulas and a separate tab for each ratio, calculate the following ratios for each company for the last 2 years using Excel: 1. Inventory turnover 2. Average days in inventory In a Word file, include the following: 1. Explain the meaning of each ratio and what the calculated results tell you about each of the companies. Refer to the calculated ratios in your analysis. Your explanation should consider how the ratios changed in the last 2 years. Your explanation should include a separate paragraph for each ratio. 2. Summarize how effective the company is in managing inventory based upon the type(s) of products the company sells and the industry in which it competes. Include discussion about whether the inventory turnover ratio is increasing or decreasing, what is causing the ratio increase/decrease, and whether the total value of inventory is increasing or decreasing on the balance sheet. Pepsico Annual Inventory (Millions of US $) 2019 $3,338 2018 $3,128 2017 $2,947 2016 $2,723 2015 $2,720 2014 $3,143 2013 $3,409 2012 $3,581 2011 $3,827 2010 $3,372 2009 $2,618 2008 $2,522 2007 $2,290 Pepsico Annual Cost of Goods Sold (Millions of US $) 2019 $30,132 2018 $29,381 2017 $28,796 2016 $28,222 2015 $28,731 2014 $31,238 2013 $31,243 2012 $31,291 2011 $31,593 2010 $26,575 2009 $20,099 2008 $20,351 2007 $18,038 Coca-Cola Annual Cost of Goods Sold (Millions of US $) 2019 $14,619 2018 $13,067 2017 $13,721 2016 $16,465 2015 $17,482 2014 $17,889 2013 $18,421 2012 $19,053 2011 $18,215 2010 $12,693 2009 $11,088 2008 $11,374 2007 $10,406 Coca-Cola Annual Inventory (Millions of US $) 2019 $3,379 2018 $3,071 2017 $2,655 2016 $2,675 2015 $2,902 2014 $3,100 2013 $3,277 2012 $3,264 2011 $3,092 2010 $2,650 2009 $2,354 2008 $2,187 2007 $2,220 Computation of inventory turnover ratio of Pepsi Particulars 2019 2018 Cost of goods sold $30,132 $29,381 Average inventory Inventory turnover ratio $3,338 $3,128 9.027 9.393 Computation of Average Days in Inventory of Pepsi Particulars 2019 2018 Number of Days 365 365 Inventory Turnover ratio 9.027 9.393 Average days in Inventory 40.434 38.859 Computation of Inventory turnover ratio of Coca Cola Particulars 2019 2018 Cost of goods sold Average inventory Inventory turnover ratio $14,619 $3,379 $13,067 $3,071 4.326 4.255 Computation of Average Days in Inventory of Coca Cola Particulars Number of Days 2019 2018 365 365 Inventory Turnover ratio Average days in Inventory 4.326 4.255 84.374 85.781 Review the most recent annual reports of The Coca-Cola Company and PepsiCo focusing on the balance sheet and footnote inventories. Using the correct formulas and a separate tab for each ratio, calculate the following ratios for each company for the last 2 years using Excel: 1. Inventory turnover 2. Average days in inventory In a Word file, include the following: 1. Explain the meaning of each ratio and what the calculated results tell you about each of the companies. Refer to the calculated ratios in your analysis. Your explanation should consider how the ratios changed in the last 2 years. Your explanation should include a separate paragraph for each ratio. 2. Summarize how effective the company is in managing inventory based upon the type(s) of products the company sells and the industry in which it competes. Include discussion about whether the inventory turnover ratio is increasing or decreasing, what is causing the ratio increase/decrease, and whether the total value of inventory is increasing or decreasing on the balance sheet. Pepsico Annual Inventory (Millions of US $) 2019 $3,338 2018 $3,128 2017 $2,947 2016 $2,723 2015 $2,720 2014 $3,143 2013 $3,409 2012 $3,581 2011 $3,827 2010 $3,372 2009 $2,618 2008 $2,522 2007 $2,290 Pepsico Annual Cost of Goods Sold (Millions of US $) 2019 $30,132 2018 $29,381 2017 $28,796 2016 $28,222 2015 $28,731 2014 $31,238 2013 $31,243 2012 $31,291 2011 $31,593 2010 $26,575 2009 $20,099 2008 $20,351 2007 $18,038 Coca-Cola Annual Cost of Goods Sold (Millions of US $) 2019 $14,619 2018 $13,067 2017 $13,721 2016 $16,465 2015 $17,482 2014 $17,889 2013 $18,421 2012 $19,053 2011 $18,215 2010 $12,693 2009 $11,088 2008 $11,374 2007 $10,406 Coca-Cola Annual Inventory (Millions of US $) 2019 $3,379 2018 $3,071 2017 $2,655 2016 $2,675 2015 $2,902 2014 $3,100 2013 $3,277 2012 $3,264 2011 $3,092 2010 $2,650 2009 $2,354 2008 $2,187 2007 $2,220 Computation of inventory turnover ratio of Pepsi Particulars 2019 2018 Cost of goods sold $30,132 $29,381 Average inventory Inventory turnover ratio $3,338 $3,128 9.027 9.393 Computation of Average Days in Inventory of Pepsi Particulars 2019 2018 Number of Days 365 365 Inventory Turnover ratio 9.027 9.393 Average days in Inventory 40.434 38.859 Computation of Inventory turnover ratio of Coca Cola Particulars 2019 2018 Cost of goods sold Average inventory Inventory turnover ratio $14,619 $3,379 $13,067 $3,071 4.326 4.255 Computation of Average Days in Inventory of Coca Cola Particulars Number of Days 2019 2018 365 365 Inventory Turnover ratio Average days in Inventory 4.326 4.255 84.374 85.781
Expert Answer:
Answer rating: 100% (QA)
TURNOVER RATIO INVENTORY COST OF Products SOLD AVG INVENTORIES AVERAGE DAYS IN I... View the full answer

Related Book For 
Managerial Accounting A Focus on Ethical Decision Making
ISBN: 978-0324663853
5th edition
Authors: Steve Jackson, Roby Sawyers, Greg Jenkins
Posted Date:
Students also viewed these finance questions
-
A Quality Circle leader is confused about the seven basic quality tools, and approaches you to help him in using a tool for identifying the root cause of the problem. Discuss with example what tool...
-
The purpose of this assignment is to make sure that the students can work with the fork, pipe, and dup system calls. It should also grant some insight into how the shell makes input/output...
-
Write a blog post of no more than 800 words . The blog post should include five elements; particularly, it should -have a title and an image -have a logical structure and be targeted for a specific...
-
If you sign up for a savings account with an annual interest rate of 12% (1% per month) that you will receive 4 million won in 2 years, what is the monthly amount you have to pay? However, suppose...
-
Which retailers have the strongest image and equity in your mind? Think about the brands they sell. Do they help to contribute to the equity of the retailer? Conversely, how does that retailers image...
-
A partially completed charge sales systems flowchart is on page 312. The flowchart depicts the charge sales activities of the Bottom Manufacturing Corporation. A customer's purchase order is...
-
The account balances for Atlantis Aquatics, Inc., for the year ended December 31, 2010, are presented next in random order: Requirements 1. Prepare Atlantis Aquatics single-step income statement. 2....
-
Mr. Brooks is employed as a financial analyst by a large Canadian public firm located in Winnipeg. During 2018, his basic gross salary amounts to $63,000. In addition, he was awarded an $11,000 bonus...
-
1) A client, Kim, quickly accepted Jack's bid on a home remodeling contract. Kim stated clear priorities on project requirements at the beginning, and never reached out to Jack again throughout the...
-
The following information appeared in the annual reports of Borden, inc., Exxon Corporation, and Visa Inc., Accruals for environmental matters are recorded when it is probable that a liability has...
-
Sales/revenues show a decreasing trend while COGS (Costs of Good Sold) indicates a decreasing trend from 2019 to 2020. For example, the sales/revenue was decrease from $25,331 to $18,097 while the...
-
Give examples of activities covered by ESG and sustainability that are not climate risk issues.
-
How can pension plans and mutual funds help solve the global warming problem?
-
What are the investment grade ratings used by S&P.
-
What are the advantages of expected shortfall over value at risk?
-
Explain how machine learning is changing the way lending decisions are made. What are the risks in relying on machine learning algorithms for these decisions?
-
In a production economy, suppose that output in period 2 depends on investment in period 1 according to the function Q2 = 30 . a. What is the equation that represents the marginal product of...
-
Provide a draft/outline of legal research involving an indigenous Canadian woman charged with assault causing bodily harm under (Sec 267b) of the Criminal Code, where the crown wants a 12-month jail...
-
Define strategic and operational planning.
-
Describe the basic elements of a job cost sheet.
-
Hammonds Hammocks produces and sells top-of-the-line Brazilian-style hammocks. The company prepared a production budget for the second quarter of the year that revealed that required production is...
-
What is automatic control?
-
A block diagram is represented by (a) circles (b) triangles (c) rectangles (d) parallelograms
-
What is a transducer? Explain the principle of operation of a transducer.

Study smarter with the SolutionInn App