

Question: Answer question with graphs and data sets in different colors Consider the following samples of gas: A sample composition pressure temperature sample composition pressure temperature
Answer question with graphs and data sets in different colors
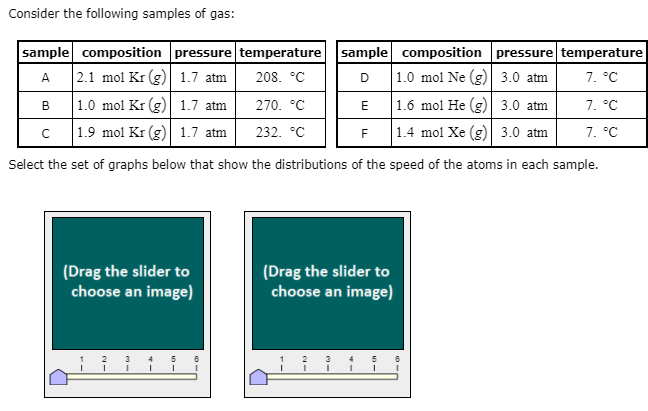
Consider the following samples of gas: A sample composition pressure temperature sample composition pressure temperature 2.1 mol Kr(g) 1.7 atm 208. C D 1.0 mol Ne (g) 3.0 atm 7. C B 1.0 mol Kr (g) 1.7 atm 270. C E 1.6 mol He (g) 3.0 atm 7. C 1.9 mol Kr (g) 1.7 atm 232. C 1.4 mol Xe (g) 3.0 atm 7. C Select the set of graphs below that show the distributions of the speed of the atoms in each sample. F (Drag the slider to choose an image) (Drag the slider to choose an image)
Step by Step Solution
There are 3 Steps involved in it
1 Expert Approved Answer
Step: 1 Unlock

Question Has Been Solved by an Expert!
Get step-by-step solutions from verified subject matter experts
Step: 2 Unlock
Step: 3 Unlock