

A nationwide standardized test taken by high- school juniors and seniors may or may not measure...
Fantastic news! We've Found the answer you've been seeking!
Question:
Transcribed Image Text:
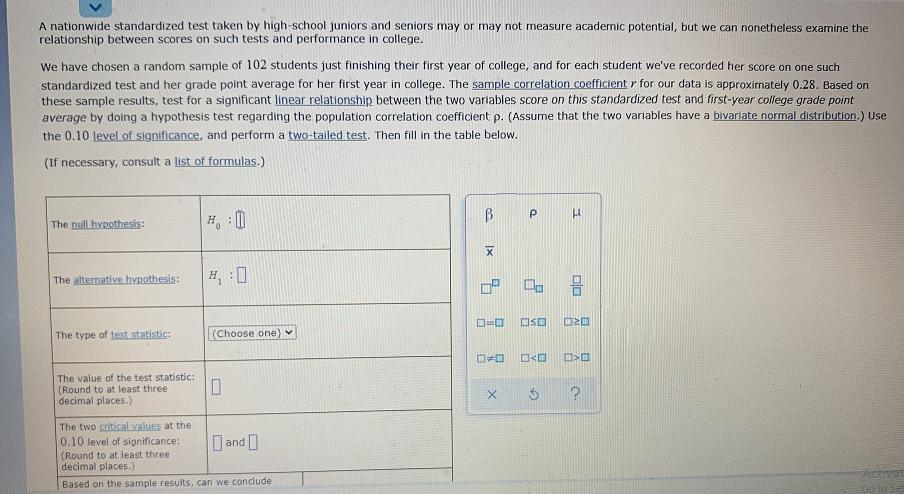
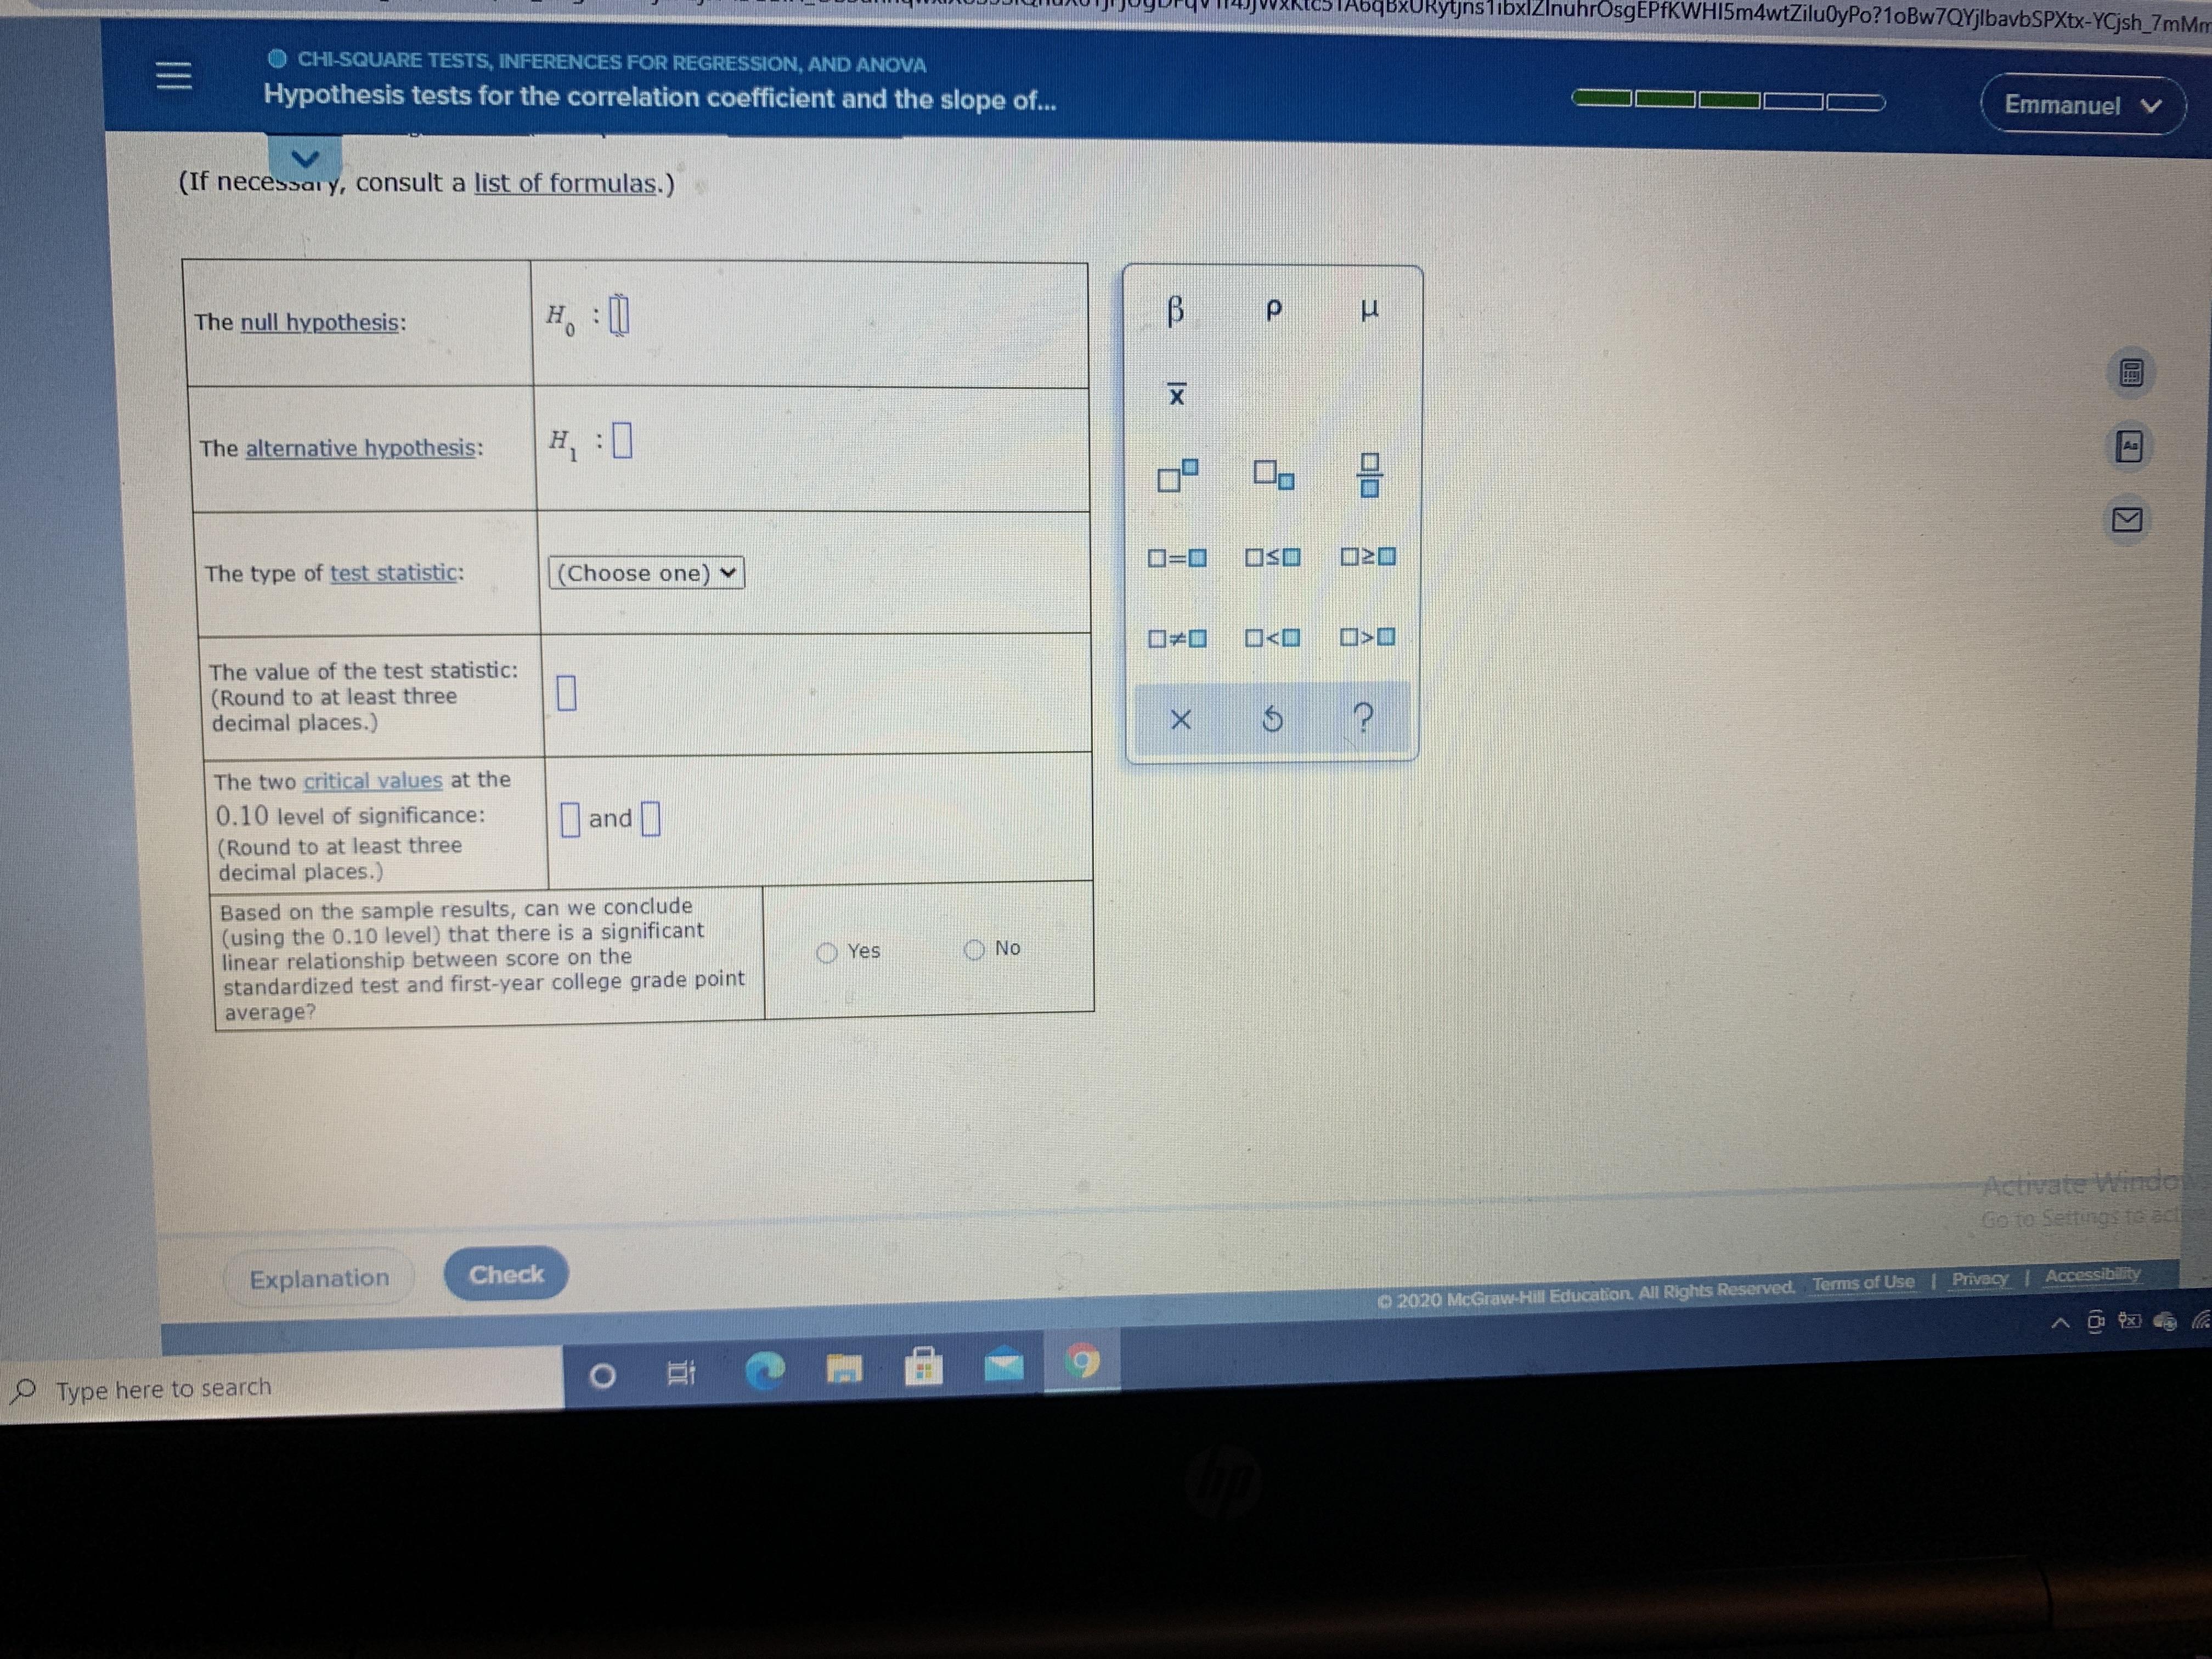
A nationwide standardized test taken by high- school juniors and seniors may or may not measure academic potential, but we can nonetheless examine the relationship between scores on such tests and performance in college. We have chosen a random sample of 102 students just finishing their first year of college, and for each student we've recorded her score on one such standardized test and her grade point average for her first year in college. The sample correlation coefficient r for our data is approximately 0.28. Based on these sample results, test for a significant linear relationship between the two variables score on this standardized test and first-year college grade point average by doing a hypothesis test regarding the population correlation coefficient p. (Assume that the two variables have a bivariate normal distribution.) Use the 0.10 level of significance, and perform a two-tailed test. Then fill in the table below. (If necessary, consult a list of formulas.) The null hypothesis: H, : 0 The altemative hypothesis: OSO The type of test statistic: (Choose one)v The value of the test statistic: (Round to at least three decimal places.) The two critical values at the 0.10 level of significance: (Round to at least three decimal places.) O and ] Astve Based on the sample results, can we conclude tc5TAbqBxURytjnslibxlZlnuhrOsgEPfKWHI5m4wtZilu0yPo?1oBw7QYjlbavbSPXtx-YCjsh_7mMm O CHI-SQUARE TESTS, INFERENCES FOR REGRESSION, AND ANOVA Hypothesis tests for the correlation coefficient and the slope of... Emmanuel V (If necessar y, consult a list of formulas.) The null hypothesis: Ho The alternative hypothesis: H :0 As O=D0 OSO The type of test statistic: (Choose one ロ+ロ O<O The value of the test statistic: (Round to at least three decimal places.) The two critical values at the 0.10 level of significance: |and| (Round to at least three decimal places.) Based on the sample results, can we conclude (using the 0.10 level) that there is a significant linear relationship between score on the standardized test and first-year college grade point average? O Yes O No सि्ड Go to Settings 1e ectioe Explanation Check O2020 McGraw-Hill Education, All Rights Reserved, Terms of Use Privacy Accessibility Type here to search P. B. II A nationwide standardized test taken by high- school juniors and seniors may or may not measure academic potential, but we can nonetheless examine the relationship between scores on such tests and performance in college. We have chosen a random sample of 102 students just finishing their first year of college, and for each student we've recorded her score on one such standardized test and her grade point average for her first year in college. The sample correlation coefficient r for our data is approximately 0.28. Based on these sample results, test for a significant linear relationship between the two variables score on this standardized test and first-year college grade point average by doing a hypothesis test regarding the population correlation coefficient p. (Assume that the two variables have a bivariate normal distribution.) Use the 0.10 level of significance, and perform a two-tailed test. Then fill in the table below. (If necessary, consult a list of formulas.) The null hypothesis: H, : 0 The altemative hypothesis: OSO The type of test statistic: (Choose one)v The value of the test statistic: (Round to at least three decimal places.) The two critical values at the 0.10 level of significance: (Round to at least three decimal places.) O and ] Astve Based on the sample results, can we conclude tc5TAbqBxURytjnslibxlZlnuhrOsgEPfKWHI5m4wtZilu0yPo?1oBw7QYjlbavbSPXtx-YCjsh_7mMm O CHI-SQUARE TESTS, INFERENCES FOR REGRESSION, AND ANOVA Hypothesis tests for the correlation coefficient and the slope of... Emmanuel V (If necessar y, consult a list of formulas.) The null hypothesis: Ho The alternative hypothesis: H :0 As O=D0 OSO The type of test statistic: (Choose one ロ+ロ O<O The value of the test statistic: (Round to at least three decimal places.) The two critical values at the 0.10 level of significance: |and| (Round to at least three decimal places.) Based on the sample results, can we conclude (using the 0.10 level) that there is a significant linear relationship between score on the standardized test and first-year college grade point average? O Yes O No सि्ड Go to Settings 1e ectioe Explanation Check O2020 McGraw-Hill Education, All Rights Reserved, Terms of Use Privacy Accessibility Type here to search P. B. II
Expert Answer:

Related Book For 

Data Analysis and Decision Making
ISBN: 978-0538476126
4th edition
Authors: Christian Albright, Wayne Winston, Christopher Zappe
Posted Date:
Students also viewed these mathematics questions
-
Based on the MTF11SSD, examine the relationship between a teen's race (RACE) and the number of friends who drink alcohol (FRDRINK) and smoke cigarettes (FRSMOKE). Using SPSS Crosstabs, create two...
-
A researcher conducts an experiment to examine the relationship between the weight gain of chickens whose diets had been supplemented by different amounts of the amino acid lysine and the amount of...
-
Use GSS 2010 to examine the relationship between respondents health (HEALTH) and social class (CLASS). Treat social class as the independent variable. a. Request the appropriate measures of...
-
Suppose that in a wave of pessimism, housing prices fall by 10% across the entire economy. a. Has the stock of real assets of the economy changed? b. Are individuals less wealthy? c. Can you...
-
What types of mutual funds should the Sampsons consider, given their investment objective?
-
A hydrocarbon fuel is burned with air. Assume the air to be a simple mixture of 21% O 2 and 79% N 2 . On a dry basis (all the water vapor has been removed from the products), a volumetric analysis of...
-
Lessee Company enters into a 6-year finance lease of non-specialized equipment with Lessor Company on January 1,2020 . Lessee has agreed to pay \(\$ 28,000\) annually beginning immediately on January...
-
The comparative financial statements of Bettancort Inc. are as follows. The market price of Bettancort Inc. common stock was $71.25 on December 31, 2014. Liabilities Instructions Determine the...
-
Consider a hedge fund with the following fee structure: The annual fee consists of a fixed fee of 1% of assets under management and an incentive fee with a high water mark provision of 20%, with a...
-
Find the transfer function, 1 (s)/T(s) , for the system shown in Figure P2.19. T(1) 0(1) 1 N-m/rad 1 N-m/rad 1 kg-m? 0000 1 kg-m? 1 N-m-s/rad FIGURE P2.19
-
Determine net operating income in the three scenarios. When preparing the 3 income statements, the starting point is the original information provided in the Base Scenario. Scenario 1: Invest in...
-
Hackworth Company's common stock is expected to pay a $4.10 dividend in the coming year. If investors require a 13% return and the growth rate in dividends is expected to be 8%, what should the...
-
2. Ideally, how should Bright's finance department analyze these projects? What do you think is the best method for analyzing them under the circumstances?
-
A rainstorm has caused stock loss of $1,000,000. The insured, Whole Grain Store, has purchased Property All Risks insurance policies from two insurance companies. The extracts of the two Property All...
-
write 500 words on the following topic: "what is the best financial advice you've ever received? Who gave it to you and when? Did you follow it at the time or not? Why do you think this piece of...
-
You are given the following with respect to Treasury securities as of today, May 13, 2015: Security Years to Maturity Annual Semiannual coupon Rate Yield to Maturity A .5 0% 3.0% B 1 0% 3.2% C 1.5...
-
Libraries. Visit one of the online libraries, usingone of the suggestions presented in this chapter or one from your own search. How might this library help you in researching your speeches? Conflict...
-
2.) Find the Laplace transform of f(t) 7e-St cos 2t +9 sinh2 2t. Use Laplace Table. %3D
-
In Example 16.2, the gamma distribution was used to model the skewness to the right of the lifetime distribution. Experiment to see whether the triangular distribution could have been used instead....
-
Find a 95% confidence interval for the proportion of customers who will purchase at least one item if they receive a coupon for 5% off. Repeat for 10% off and for 15% off.
-
Suppose that two dice are tossed. For each die, it is equally likely that 1, 2, 3, 4, 5, or 6 dots will turn up. Let S be the sum of the two dice. a. What is the probability that S will be 5 or 7? b....
-
Brown, Cosden & Co., a medium-sized public accounting firm, was engaged to audit Joslin Supply Inc. Several staff were involved in the audit, all of whom had attended the firm's in-house training...
-
Jan Sharpe recently joined the public accounting firm of Spark, Watts, and Wilcox. She quickly established a repu tation for thoroughness and a steadfast dedication to follow ing prescribed auditing...
-
In confirming accounts receivable on December 31, 2001, the auditor found 15 discrepancies between the cus tomer s records and the recorded amounts in the subsidiary ledger. A copy of all...

Study smarter with the SolutionInn App