

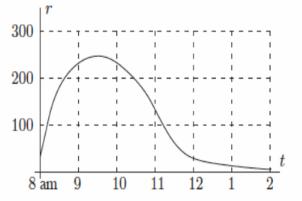
At the right is the graph 1 of the rate r (in 300 arrivals per hour) at
Fantastic news! We've Found the answer you've been seeking!
Question:
At the right is the graph 1 of the rate r (in 300 arrivals per hour) at which patrons arrive at the theater in order to get rush seats for the 200 evening performance. The first people arrive at 8 am and the ticket windows open at 9 am. 100 Suppose that once the windows open, people can be served at an (average) rate of 200 per hour.
Expert Answer:

Related Book For 

Accounting Tools for business decision making
ISBN: 978-0470095461
4th Edition
Authors: kimmel, weygandt, kieso
Posted Date:
