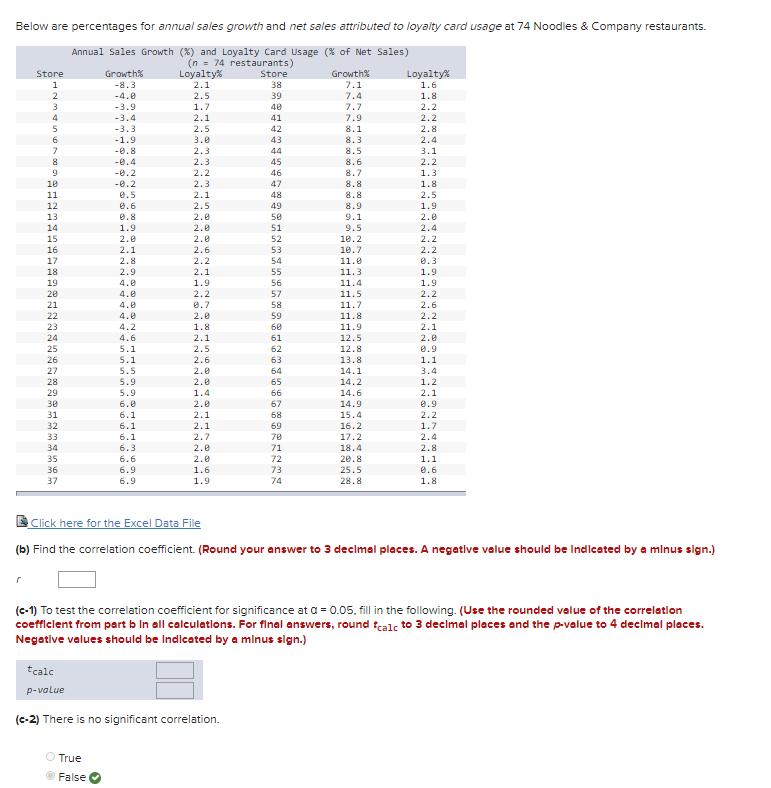
Below are percentages for annual sales growth and net sales attributed to loyaity card usage at...
Fantastic news! We've Found the answer you've been seeking!
Question:
Transcribed Image Text:
Below are percentages for annual sales growth and net sales attributed to loyaity card usage at 74 Noodles & Company restaurants. Annual Sales Growth (%) and Loyalty Card Usage (% of Net Sales) (n = 74 restaurants) Loyalty 2.1 Store 38 Growth% Growth% Loyalty% 1.6 Store 1 -8.3 7.1 2 -4.0 2.5 39 7.4 1.8 3 -3.9 1.7 40 7.7 2.2 2.1 2.5 -3.4 41 7.9 2.2 -3.3 42 8.1 2.8 6. -1.9 3.0 43 8.3 2.4 -0.8 2.3 44 8.5 3.1 -0.4 2.3 45 8.6 2.2 -0.2 2.2 46 8.7 1.3 1.8 -e.2 2.3 2.1 10 47 8.8 11 0.5 48 8.8 2.5 12 0.6 2.5 49 8.9 1.9 13 e.8 2.0 50 9.1 2.0 14 1.9 2.0 51 9.5 2.4 15 2.0 2.0 52 10.2 2.2 2.6 2.2 16 2.1 53 1e.7 2.2 17 2.8 54 11.0 0.3 18 2.9 2.1 55 11.3 1.9 19 4.0 1.9 56 11.4 1.9 20 4.0 2.2 57 2.2 11.5 11.7 21 4.8 e.7 58 2.6 22 4.0 2.0 59 11.8 2.2 23 60 2.1 2.0 4.2 1.8 11.9 2.1 2.5 24 4.6 61 12.5 25 5.1 62 12.8 0.9 26 5.1 2.6 63 13.8 1.1 27 5.5 2.0 64 14.1 3.4 5.9 5.9 6.0 28 2.0 65 14.2 1.2 29 1.4 66 14.6 2.1 30 2.0 67 14.9 0.9 6.1 6.1 31 2.1 68 15.4 2.2 32 2.1 69 16.2 1.7 33 70 17.2 18.4 6.1 2.7 1.4 34 6.3 2.0 71 2.8 35 6.6 6.9 2.0 72 20.8 1.1 36 1.6 73 25.5 0.6 37 6.9 1.9 74 28.8 1.8 BClick here for the Excel Data File (b) Find the correlation coefficient. (Round your answer to 3 decimal places. A negative value should be Indicated by a minus sign.) (c-1) To test the correlation coefficient for significance at a = 0.05. fill in the following. (Use the rounded value of the correlation coefficlent from part b In all calculations. For final answers, round fcalc to 3 decimal places and the p-value to 4 decelmal places. Negative values should be Indicated by a mlnus sign.) tcalc p-value (c-2) There is no significant correlation. O True False Below are percentages for annual sales growth and net sales attributed to loyaity card usage at 74 Noodles & Company restaurants. Annual Sales Growth (%) and Loyalty Card Usage (% of Net Sales) (n = 74 restaurants) Loyalty 2.1 Store 38 Growth% Growth% Loyalty% 1.6 Store 1 -8.3 7.1 2 -4.0 2.5 39 7.4 1.8 3 -3.9 1.7 40 7.7 2.2 2.1 2.5 -3.4 41 7.9 2.2 -3.3 42 8.1 2.8 6. -1.9 3.0 43 8.3 2.4 -0.8 2.3 44 8.5 3.1 -0.4 2.3 45 8.6 2.2 -0.2 2.2 46 8.7 1.3 1.8 -e.2 2.3 2.1 10 47 8.8 11 0.5 48 8.8 2.5 12 0.6 2.5 49 8.9 1.9 13 e.8 2.0 50 9.1 2.0 14 1.9 2.0 51 9.5 2.4 15 2.0 2.0 52 10.2 2.2 2.6 2.2 16 2.1 53 1e.7 2.2 17 2.8 54 11.0 0.3 18 2.9 2.1 55 11.3 1.9 19 4.0 1.9 56 11.4 1.9 20 4.0 2.2 57 2.2 11.5 11.7 21 4.8 e.7 58 2.6 22 4.0 2.0 59 11.8 2.2 23 60 2.1 2.0 4.2 1.8 11.9 2.1 2.5 24 4.6 61 12.5 25 5.1 62 12.8 0.9 26 5.1 2.6 63 13.8 1.1 27 5.5 2.0 64 14.1 3.4 5.9 5.9 6.0 28 2.0 65 14.2 1.2 29 1.4 66 14.6 2.1 30 2.0 67 14.9 0.9 6.1 6.1 31 2.1 68 15.4 2.2 32 2.1 69 16.2 1.7 33 70 17.2 18.4 6.1 2.7 1.4 34 6.3 2.0 71 2.8 35 6.6 6.9 2.0 72 20.8 1.1 36 1.6 73 25.5 0.6 37 6.9 1.9 74 28.8 1.8 BClick here for the Excel Data File (b) Find the correlation coefficient. (Round your answer to 3 decimal places. A negative value should be Indicated by a minus sign.) (c-1) To test the correlation coefficient for significance at a = 0.05. fill in the following. (Use the rounded value of the correlation coefficlent from part b In all calculations. For final answers, round fcalc to 3 decimal places and the p-value to 4 decelmal places. Negative values should be Indicated by a mlnus sign.) tcalc p-value (c-2) There is no significant correlation. O True False
Expert Answer:
Answer rating: 100% (QA)
The data is first typed in Excel and then imported to R b ... View the full answer
Related Book For
Applied Statistics in Business and Economics
ISBN: 978-0073521480
4th edition
Authors: David Doane, Lori Seward
Posted Date:
Students also viewed these mathematics questions
-
Refer to Figure 6-23. The effective price received by sellers after the tax is imposed is a. $3. b. $4. c. $5. d. $6. 9 8 7 6 5 4 3 2 1 price 2 4 160 S after tax S D 8 10 12 14 16 quantity
-
Below are percentages for annual sales growth and net sales attributed to loyalty card usage at 74 Noodles & Company restaurants. (a) Make a scatter plot. (b) Find the correlation coefficient and...
-
(b) Find the correlation coefficient. (Round your answer to 3 decimal places. A negative value should be indicated by a minus sign.) (c-1) To test the correlation coefficient for significance at a =...
-
Write a program MooresLaw that takes a command-line argument \(n\) and outputs the increase in processor speed over a decade if microprocessors double every \(n\) months. How much will processor...
-
What is the relationship between a countrys foreign exchange rate and its net exports? Why?
-
What are the four elements that comprise a companys marketing strategy (or marketing mix) and how do they affect the type of advertising a company uses?
-
What prefiling requirements should be considered?
-
A scientist proposed the following equation of state: p = RT/Vm - B/v2m + Cv3m Show that the equation leads to critical behaviour. Find the critical constants of the gas in terms of Band C and an...
-
Decision analysis: Another grower has available 20,000 pounds of Chardonnay grapes from the 2009 harvest. AVS has the opportunity to buy the juice from these grapes (they have already been harvested...
-
Karla Tanner opens a Web consulting business called Linkworks and completes the following transactions in its first month of operations. April 1 Tanner invests $80,000 cash along with office...
-
The following is the post-closing trial balance for the Whitlow Manufacturing Corporation as of December 31, 2023. Account Title 3 Cash Accounts receivable Inventory Equipment Accumulated...
-
For each of the following experiments, decide whether it would be appropriate to use a sample space which is finite, countably infinite, or continuous. (a) A Geiger counter, located adjacent to a...
-
An Engineers Association consists of 5 civil engineers and 5 mechanical engineers. (a) In how many ways can a committee of 3 civil engineers and 2 mechanical engineers be appointed? (b) If 2 civil...
-
Use the pain tolerance ratings (PainTolerance) after the activity to estimate the difference in mean pain tolerance between those who just completed a synchronized activity and those who did a...
-
If there are 9 cars in a race, in how many different ways can they place first, second, and third?
-
A shipment of 120 burglar alarms contains 5 that are defective. If 3 of these alarms are randomly selected and shipped to a customer, find the probability that the customer will get one bad unit by...
-
After COVID-19 what are the possible scenarios white collar businesses in Tasmania might face? Explain
-
A random sample of 10 houses heated with natural gas in a particular area, is selected, and the amount of gas (in therms) used during the month of January is determined for each house. The resulting...
-
A random sample of 25 items is drawn from a population whose standard deviation is unknown. The sample mean is x-bar = 850 and the sample standard deviation is s = 15. Use Appendix D to find the...
-
(a) Interpret the slope of the fitted regression Number of International Franchises = 247.5 + 1.75 Power Distance Index. The Power Distance Index is a measure on a scale of 0100 of the wealth gap...
-
The fracture strength of a certain type of manufactured glass is normally distributed with a mean of 579 MPa with a standard deviation of 14 MPa. (a) What is the probability that a randomly chosen...
-
Green, CPA, is considering audit risk at the financial statement level in planning the audit of National Federal Bank (NFB) Company's financial statements for the year ended December 31, 19X0. Audit...
-
For the following sets of circumstances, indicate whether the auditor would have a high or low risk of failing to detect these circumstances with appropriate audit procedures. Give reasons for your...
-
Using the audit risk model, calculate detection risk if the other risks are set at these levels. a. Individual audit risk of 5 percent. Inherent risk of 50 percent. Control risk of 40 percent. b....
Study smarter with the SolutionInn App