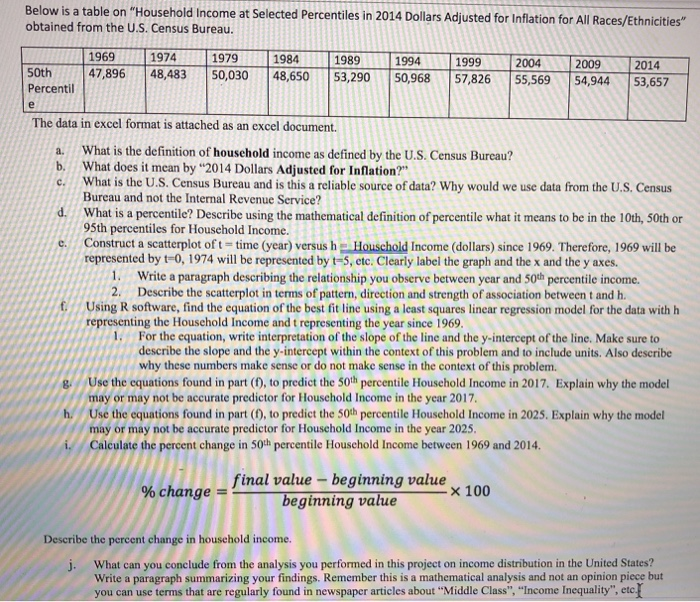
Below is a table on Household Income at Selected Percentiles in 2014 Dollars Adjusted for Inflation...
Fantastic news! We've Found the answer you've been seeking!
Question:
Transcribed Image Text:
Below is a table on "Household Income at Selected Percentiles in 2014 Dollars Adjusted for Inflation for All Races/Ethnicities" obtained from the U.S. Census Bureau. 50th Percentil a. b. C. e The data in excel format is attached as an excel document. d. C. f. 8. 1969 47,896 h. 1974 1984 1989 1994 1999 1979 48,483 50,030 48,650 53,290 50,968 57,826 What is the definition of household income as defined by the U.S. Census Bureau? What does it mean by "2014 Dollars Adjusted for Inflation?" What is the U.S. Census Bureau and is this a reliable source of data? Why would we use data from the U.S. Census Bureau and not the Internal Revenue Service? What is a percentile? Describe using the mathematical definition of percentile what it means to be in the 10th, 50th or 95th percentiles for Household Income. Construct a scatterplot of t-time (year) versus h Household Income (dollars) since 1969. Therefore, 1969 will be represented by t-0, 1974 will be represented by t-5, etc. Clearly label the graph and the x and the y axes. 2004 2014 2009 55,569 54,944 53,657 1. Write a paragraph describing the relationship you observe between year and 50th percentile income. 2. Describe the scatterplot in terms of pattern, direction and strength of association between t and h. Using R software, find the equation of the best fit line using a least squares linear regression model for the data with h representing the Household Income and t representing the year since 1969. 1. For the equation, write interpretation of the slope of the line and the y-intercept of the line. Make sure to describe the slope and the y-intercept within the context of this problem and to include units. Also describe why these numbers make sense or do not make sense in the context of this problem. Use the equations found in part (f), to predict the 50th percentile Household Income in 2017. Explain why the model may or may not be accurate predictor for Household Income in the year 2017. Use the equations found in part (f), to predict the 50th percentile Household Income in 2025. Explain why the model may or may not be accurate predictor for Household Income in the year 2025. Calculate the percent change in 50th percentile Household Income between 1969 and 2014. % change = final value beginning value beginning value x 100 Describe the percent change in household income. j. What can you conclude from the analysis you performed in this project on income distribution in the United States? Write a paragraph summarizing your findings. Remember this is a mathematical analysis and not an opinion piece but you can use terms that are regularly found in newspaper articles about "Middle Class", "Income Inequality", etc. Below is a table on "Household Income at Selected Percentiles in 2014 Dollars Adjusted for Inflation for All Races/Ethnicities" obtained from the U.S. Census Bureau. 50th Percentil a. b. C. e The data in excel format is attached as an excel document. d. C. f. 8. 1969 47,896 h. 1974 1984 1989 1994 1999 1979 48,483 50,030 48,650 53,290 50,968 57,826 What is the definition of household income as defined by the U.S. Census Bureau? What does it mean by "2014 Dollars Adjusted for Inflation?" What is the U.S. Census Bureau and is this a reliable source of data? Why would we use data from the U.S. Census Bureau and not the Internal Revenue Service? What is a percentile? Describe using the mathematical definition of percentile what it means to be in the 10th, 50th or 95th percentiles for Household Income. Construct a scatterplot of t-time (year) versus h Household Income (dollars) since 1969. Therefore, 1969 will be represented by t-0, 1974 will be represented by t-5, etc. Clearly label the graph and the x and the y axes. 2004 2014 2009 55,569 54,944 53,657 1. Write a paragraph describing the relationship you observe between year and 50th percentile income. 2. Describe the scatterplot in terms of pattern, direction and strength of association between t and h. Using R software, find the equation of the best fit line using a least squares linear regression model for the data with h representing the Household Income and t representing the year since 1969. 1. For the equation, write interpretation of the slope of the line and the y-intercept of the line. Make sure to describe the slope and the y-intercept within the context of this problem and to include units. Also describe why these numbers make sense or do not make sense in the context of this problem. Use the equations found in part (f), to predict the 50th percentile Household Income in 2017. Explain why the model may or may not be accurate predictor for Household Income in the year 2017. Use the equations found in part (f), to predict the 50th percentile Household Income in 2025. Explain why the model may or may not be accurate predictor for Household Income in the year 2025. Calculate the percent change in 50th percentile Household Income between 1969 and 2014. % change = final value beginning value beginning value x 100 Describe the percent change in household income. j. What can you conclude from the analysis you performed in this project on income distribution in the United States? Write a paragraph summarizing your findings. Remember this is a mathematical analysis and not an opinion piece but you can use terms that are regularly found in newspaper articles about "Middle Class", "Income Inequality", etc.
Expert Answer:
Answer rating: 100% (QA)
1 Household income as defined by US Census is the aggregate gross income of all the members of the f... View the full answer
Related Book For
International Finance Theory and Policy
ISBN: 978-0133423648
10th edition
Authors: Paul R. Krugman, Maurice Obstfeld, Marc J. Melitz
Posted Date:
Students also viewed these economics questions
-
Below is a table showing population age group projections made by the US Census Bureau for the year 2025 Age Group Number of People (millions) 0 to under 20.... 94.3 20 to under 40.. 92.9 40 to under...
-
Below is a table showing 100-meter finish times (in seconds) for 35 competitors at the NCAA Division III Track and Field Championships recently held in Muncie, Indiana. a. Create a stem-and-leaf...
-
Below is a table of some inflation targeting countries and the years in which they adopted the practice: Country Year of adoption New Zealand................................1990...
-
Explain why the economic order quantity is the intersection of the ordering-cost curve and the carrying-cost curve.
-
Selling a plant, income taxes (CMA, adapted) The Crossroad Company is an international clothing manufacturer. Its Santa Monica plant will become idle on December 31, 2011. Peter Laney, the corporate...
-
Write the formula for the distance d from P 1 = (x 1 , y 1 ) to P 2 = (x 2 , y 2 ).
-
What are high-yield bonds? What is their role in financing firms?
-
The following financial statement information is from five separate companies: Required 1. Answer the following questions about Company A: a. What is the amount of equity on December 31, 2014? b....
-
Question 6 of 10 < > Current Attempt in Progress Your answer is partially correct. Determine the missing amounts. 1. Unit Selling Price $720 2. 3. 17 Unit Variable Costs $360 0.17/1 Qu Acco Unit...
-
What are the triads using roman numerals and figured bass numbers for this excerpt? 30-3. Use Roman numerals and figured bass numbers to identify triads in these works. a. Schubert, "Death and the...
-
Today, you purchased a two-year Treasury STRIP with a face value of $1000. Assume that the one-year spot rate (r1) is 5.00% and the two-year spot rate (r2) is 6.00%. (a) What is the one-year forward...
-
Using Chipotle: Capital structure decision case study Answer the following questions. How does debt policy and the percentage of debt affect Chipotle's firm value Use bullets to highlight the main...
-
Find the local extreme points of f (x) = x e.
-
Case Scenario: Imagine you are a project manager overseeing a team of software developers working on a critical project with a tight deadline. Two team members, Alex and Sarah, have been clashing...
-
Decision Analysis: Myka would like to maintain a 50% gross profit to cover AVS's administrative expenses of US$125,000 and target a 15% net profit. What should the target cost per case be in order to...
-
The restaurant at the Hotel Galaxy offers two choices for breakfast: an all-you-can-eat buffet and an a la carte option, where diners can order from the menu. The buffet option has a budgeted meal...
-
After executing the following three ARM instructions MOV r0, #0xFFFFFFFD MOV r1, #0xFFFFFFF4 ADDS r2, r1, ro The value of r2 = 0x and the C flag = the Z flag = the N flag = , the V flag =
-
Refer to the data for problem 13-36 regarding Long Beach Pharmaceutical Company. Required: Compute each division's residual income for the year under each of the following assumptions about the...
-
The interest rate on U.S. three-month Treasury bills dropped to very low levels at the end of 2008 and remained there for several years. Starting in January 2009 and ending in December 2013, find...
-
Suppose it is possible for a country to leave the euro zone and begin printing its own currency. Suppose also that there is some point at which the ECB (perhaps it is worried about financial losses)...
-
Suppose residents of the U.S. consume relatively more of U.S. export goods than residents of foreign countries. In other words, U.S. export goods have a higher weight in the U.S. CPI than they do in...
-
Charts and graphs are often used to help people understand numbers. To be helpful, charts and graphs must be clearly labeled. Required: 1. Use the data from Application Problem 15-4, Instruction 1,...
-
Denise Young, an accountant for Chiles Corporation, has been asked to prepare an income statement that reports contribution margin. Miss Young has asked you to prepare an analysis of three months...
-
How is a present value factor determined?
Study smarter with the SolutionInn App