

Late in the summer, before the start of the school year, you decide to make a quick
Question:
Late in the summer, before the start of the school year, you decide to make a quick phone call to your old college roommate Jeremy Hertz, who now lives in Aspen, Co where he runs a ski-equipment shop. “I love living in a ski town”, says Jeremy. It’s great here all year round! Why don’t you come for Labor Day weekend? It’ll be beautiful, we can do some hiking and eat in all the good restaurants before they get too crowded”. “Plus”, Jeremy continues, “aren’t you taking a Business Analytics Course? I could use your help with my stocking decision for the upcoming ski season.”
How could you resist? So Labor Day weekend finds you in Jeremy’s apartment, planning your next day hiking excursion. “But first”, you say, “tell me about your stocking problem”.
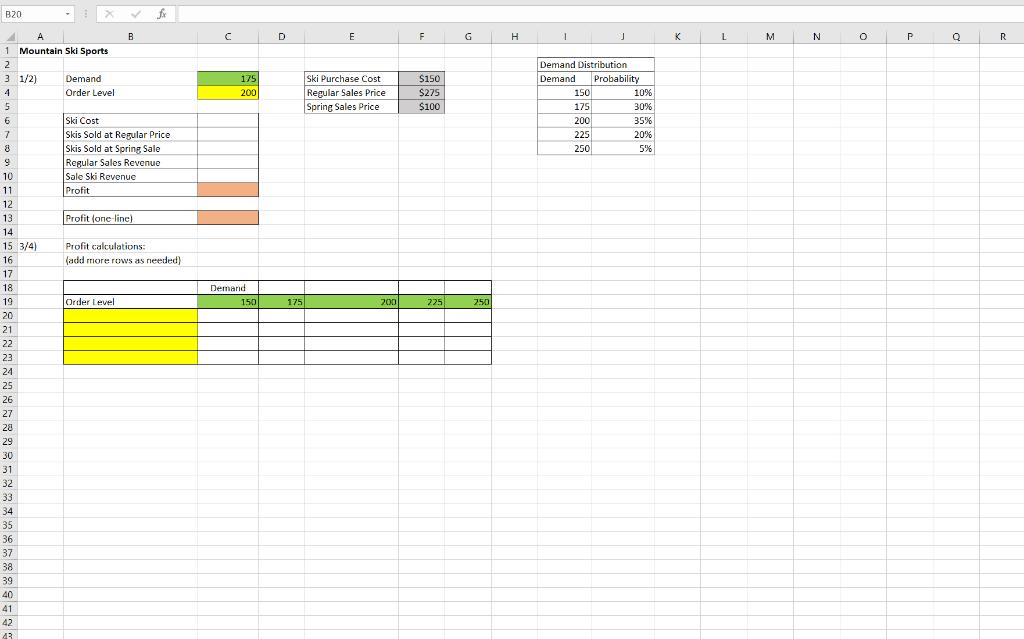
Jeremy says “Why this is hard, is that demand varies. Some seasons I’ve have requests for 250 skis, but one bad year I could only sell 150. Plus there are other complications. If you could help me figure out how many skis to order this year, I’d be truly grateful. Some additional information:
- He purchases skis from a manufacturer each fall for the coming winter season.
- The manufacturer he works with only sells skis in lots of 20.
- The most popular intermediate model costs $150 and sells for $275.
- Special orders take too long, so he can’t sell skis he hasn’t ordered/stocked in the fall.
- If he orders too many skis, those left over at the end of the winter are sold at the store’s spring scales for $100.
- Sales over the years is summarized in the table below.
Demand Prob
150 10%
175 30%
200 35%
225 20%
250 5%
Technical Analysis
- Assume Jeremy orders 200 skis. On the template, fill in the formulas for the given quantities (for a given demand, given an order level of 200). The formula should have only cell addresses (so no embedded numbers).*
- Once you’ve worked out a formula for the profit, with the intermediate calculations showing develop a single cell formula to calculate the same thing. (Or, skip this step and learn how to use the Data Table function in Excel.)
- What are sensible order levels? Set up rows in the table for each sensible order level.
- Use your formula (or the data table function) to determine the profit for each demand/order level pair. (The “$”’s are important here.)
- Do whatever you wish, to help Jeremy choose how many skis to order. Remember, he does not control the demand, but he does know the probabilities of each demand level.
Expert Answer:


Personal Finance
ISBN: 978-1259720680
12th edition
Authors: Jack R. Kapoor, Les R. Dlabay, Robert J. Hughes, Melissa Hart
