

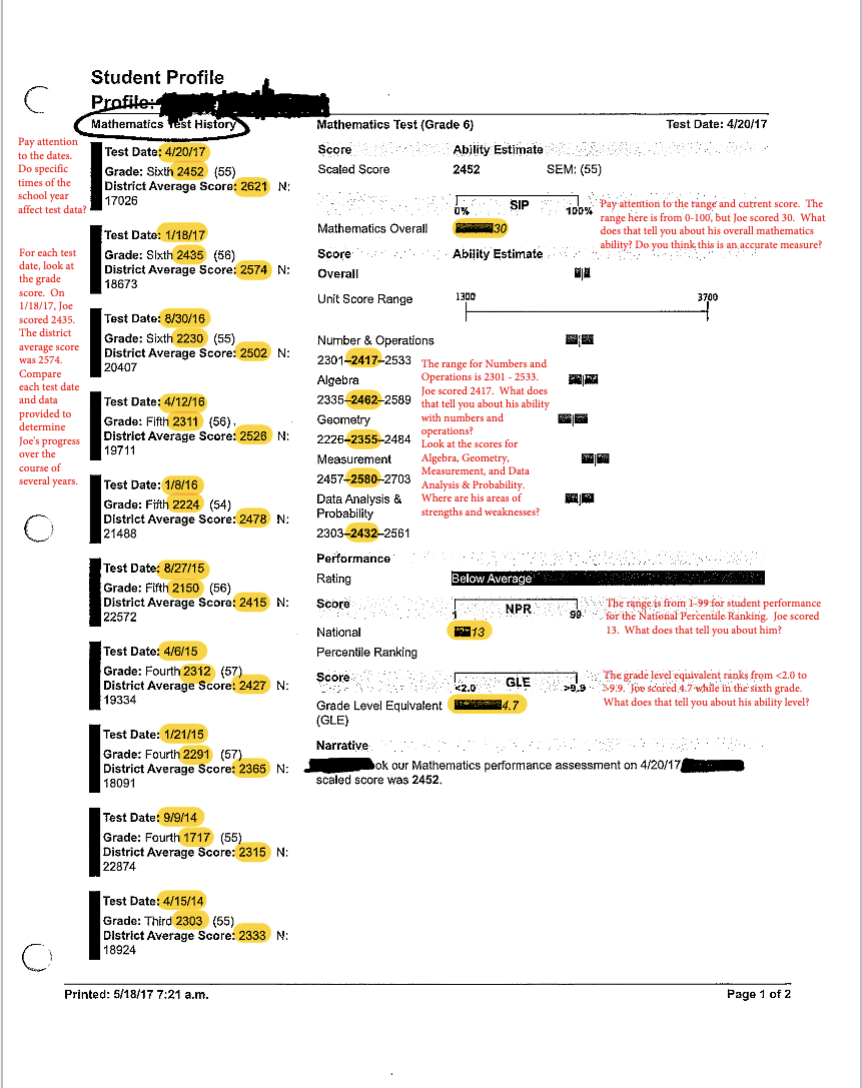
C Pay attention to the dates. Do specific times of the school year affect test data?...
Fantastic news! We've Found the answer you've been seeking!
Question:


Transcribed Image Text:
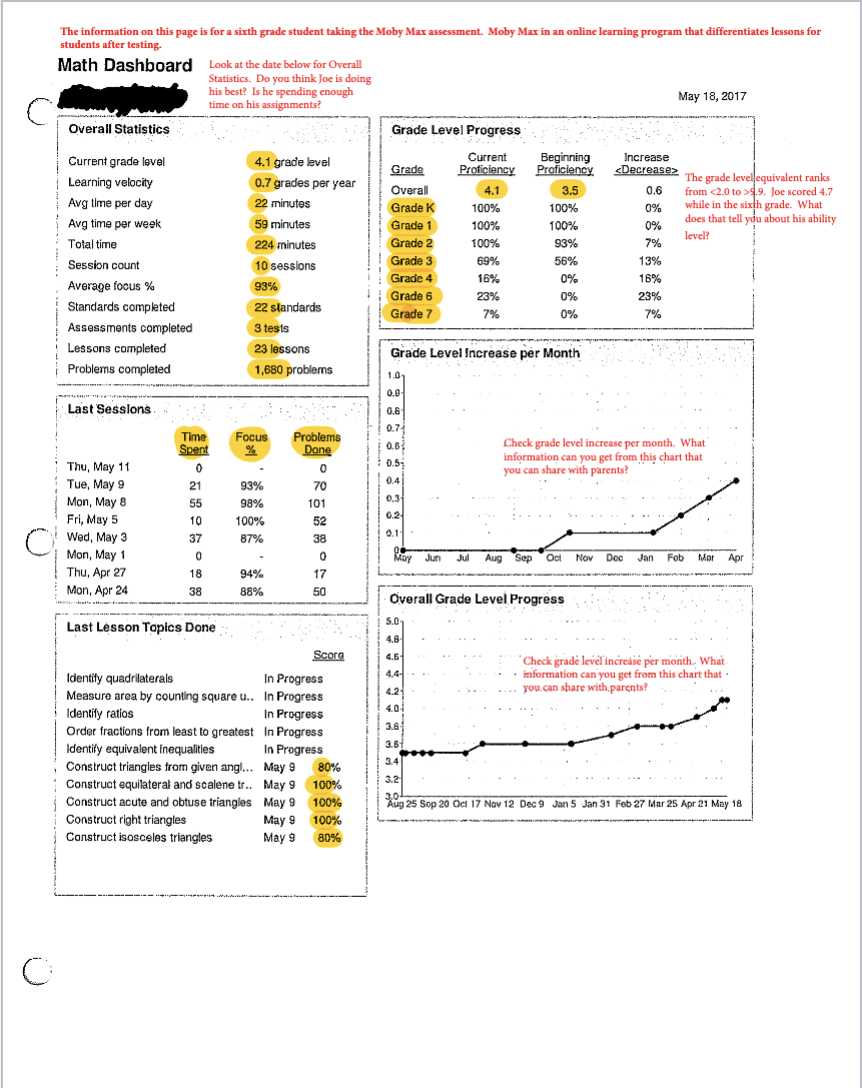
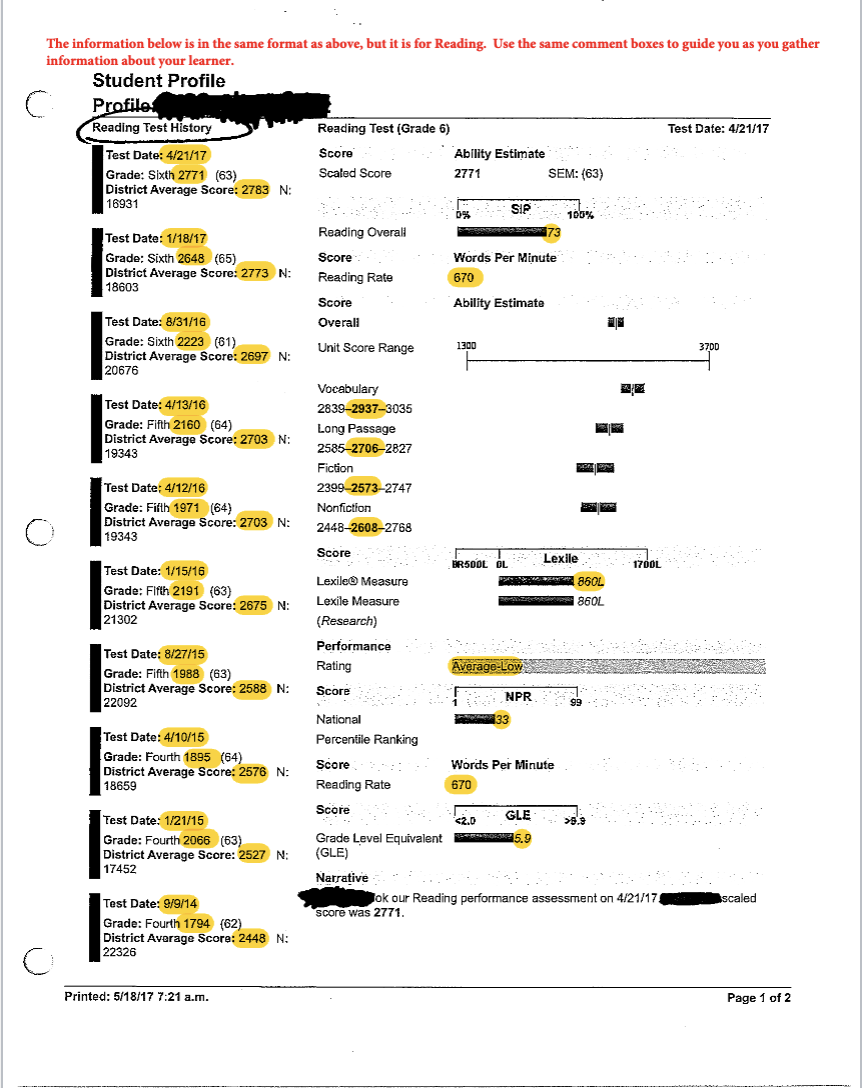
C Pay attention to the dates. Do specific times of the school year affect test data? Student Profile Profile: Mathematics est History Test Date: 4/20/17 Grade: Sixth 2452 (55) District Average Score: 2621 N: 17026 Test Date: 1/18/17 Mathematics Test (Grade 6) Score Ability Estimate Scaled Score 2452 SEM: (55) SIP 0% 100% Mathematics Overall For each test Grade: Sixth 2435 (56) Score Ability Estimate date, look at the grade District Average Score: 2574 N: Overall 18673 score. On Unit Score Range 1300 1/18/17, Joe scored 2435. Test Date: 8/30/16 The district Grade: Sixth 2230 (55) Number & Operations average score was 2574. Compare each test date and data provided to determine Joe's progress over the course of several years. District Average Score: 2502 N: 20407 Test Date: 4/12/16 Grade: Fifth 2311 (56), District Average Score: 2526 N: 19711 Test Date: 1/8/16 Grade: Fifth 2224 (54) District Average Score: 2478 N: 21488 Test Date: 8/27/15 Grade: Fifth 2150 (56) Measurement Algebra, Geometry, Measurement, and Data 2457-2580-2703 Analysis & Probability. Data Analysis & Where are his areas of Probability Algebra Geometry 2301-2417-2533 The range for Numbers and Operations is 2301-2533. Joe scored 2417. What does 2335-2462-2589 that tell you about his ability 2226-2355-2484 Look at the scores for with numbers and operations? 0 Test Date: 4/20/17 Pay attention to the range and current score. The range here is from 0-100, but Joe scored 30. What does that tell you about his overall mathematics ability? Do you think this is an accurate measure? 3700 strengths and weaknesses? 2303-2432-2561 Performance Rating Below Average District Average Score: 2415 N: 22572 Score NPR. National 13 The range is from 1-99 for student performance for the National Percentile Ranking. Joe scored 13. What does that tell you about him? Test Date: 4/6/15 Grade: Fourth 2312 (57) Percentile Ranking Score District Average Score: 2427 N: 19334 <2.0 Grade Level Equivalent (GLE) GLE 4.7 The grade level equivalent ranks from <2.0 to 39.9. Joe scared 4.7 while in the sixth grade. What does that tell you about his ability level? Test Date: 1/21/15 Grade: Fourth 2291 (57) Narrative District Average Score: 2365 N: 18091 ok our Mathematics performance assessment on 4/20/17 scaled score was 2452. Test Date: 9/9/14 Grade: Fourth 1717 (55) District Average Score: 2315 N: 22874 Test Date: 4/15/14 Grade: Third 2303 (55) District Average Score: 2333 N: 18924 Printed: 5/18/17 7:21 a.m. Page 1 of 2 The information on this page is for a sixth grade student taking the Moby Max assessment. Moby Max in an online learning program that differentiates lessons for students after testing. Math Dashboard Look at the date below for Overall Statistics. Do you think Joe is doing his best? Is he spending enough time on his assignments? May 18, 2017 Overall Statistics Grade Level Progress Current grade level 4.1 grade level Learning velocity 0.7 grades per year Grade Overall Current Proficiency 4.1 Beginning Proficiency 3.5 Increase 0.6 Avg time per day 22 minutes Grade K 100% 100% 0% The grade level equivalent ranks from <2.0 to >5.9. Joe scored 4.7 while in the sixth grade. What does that tell you about his ability Avg time per week 59 minutes Grade 1 100% 100% 0% level? Total time 224 minutes Grade 2 100% 93% 7% Grade 3 69% 56% 13% Session count 10 sessions Grade 4 16% 0% 16% Average focus % 93% Grade 6 23% 0% 23% Standards completed Lessons completed 22 standards Grade 7 7% 0% 7% Assessments completed 3 tests 23 lessons Grade Level Increase per Month Problems completed 1,680 problems 1.0 0.0 Last Sessions 0.6 0.7 Time Focus Problems 0.6 Spent % Done 0.5 Thu, May 11 0 0 Check grade level increase per month. What' information can you get from this chart that you can share with parents? Tue, May 9 21 93% 70 0.4) 0.3 Mon, May 8 55 98% 101 0.2 Fri, May 5 10 100% 52 Wed, May 3 0.1 37 87% 38 Mon, May 1 0 0 Ray Jun Jul Aug Sep Oct Nov Doc Jan Fob Mar Thu, Apr 27 18 94% 17 Mon, Apr 24 38 88% 50 Overall Grade Level Progress Last Lesson Topics Done 5.0 4.8 Score 4.5 In Progress Identify quadrilaterals Measure area by counting square u.. In Progress 4.4- 4.2 Check grade level increase per month. What information can you get from this chart that you can share with parents? Identify ratios 4.0+ In Progress Order fractions from least to greatest In Progress 3.8 Identify equivalent inequalities 3.6 In Progress Construct triangles from given angl... 3.4 May 9 80% 3.2 Construct equilateral and scalene tr.. May 9 100% Construct acute and obtuse triangles May 9 100% Aug 25 Sop 20 Oct 17 Nov 12 Dec 9 Jan 5 Jan 31 Feb 27 Mar 25 Apr 21 May 18 Construct right triangles May 9 100% Construct isosceles triangles May 9 80% The information below is in the same format as above, but it is for Reading. Use the same comment boxes to guide you as you gather information about your learner. Student Profile C Profile Reading Test History Reading Test (Grade 6) Test Date: 4/21/17 Test Date: 4/21/17 Score Grade: Sixth 2771 (63) Scaled Score Ability Estimate 2771 SEM: (63) District Average Score: 2783 N: 16931 03 SIP 100% Reading Overall Test Date: 1/18/17 Grade: Sixth 2648 (65) District Average Score: 2773 N: 18603 Test Date: 8/31/16 Grade: Sixth 2223 (61) Score Words Per Minute Reading Rate 670 Score Ability Estimate Overall Unit Score Range 1300 3700 District Average Score: 2697 N: 20676 Test Date: 4/13/16 Grade: Fifth 2160 (64) District Average Score: 2703 N: 19343 Test Date: 4/12/16 Grade: Fifth 1971 (64) District Average Score: 2703 N: 19343 Test Date: 1/15/16 Grade: Fifth 2191 (63) Vocabulary 2839-2937-3035 Long Passage 2585-2706-2827 Fiction 2399-2573-2747 Nonfiction 2448-2608-2768 Score Lexile BR500L OL 1700L Lexile Measure 860L District Average Score: 2675 N: 21302 Lexile Measure 860L (Research) Performance Test Date: 8/27/15 Rating Average-Low Grade: Fifth 1988 (63) District Average Score: 2588 N: 22092 Score NPR 99 National 33 Test Date: 4/10/15 Grade: Fourth 1895 (64) District Average Score: 2576 N: 18659 Test Date: 1/21/15 Grade: Fourth 2066 (63) District Average Score: 2527 N: 17452 Percentile Ranking Score Words Per Minute Reading Rate 670 Score GLE <2.0 59.9 Grade Level Equivalent 5.9 (GLE) Narrative Test Date: 9/9/14 ok our Reading performance assessment on 4/21/17 Bebe scaled score was 2771. Grade: Fourth 1794 (62) District Average Score: 2448 N: 22326 Printed: 5/18/17 7:21 a.m. Page 1 of 2 The information on this page is for a sixth grade student taking the Moby Max assessment. Moby Max in an online learning program that differentiates lessons for students after testing. Language Dashboard May 18, 2017 C Overall Statistics Grade Level Progress Current grade level 3.7 grade level Current Beginning Grade Proficiency Proficiency Increase Learning velocity Avg time per day 4.0 grades per year Overall 3.7 2.3 22 minutes Grade K 100% 100% Avg time per week 33 minutes Grade 1 100% 84% Total time Session count Average focus % Standards completed Assessments completed Lessons completed 155 minutes Grade 2 100% 45% 7 sessions Grade 3 66% 0% 97% Grade Level Increase per Month 31 standards 1.0 3 tests 0.9 46 lessons 0.8 Problems completed 2,715 problems 0.7 0,5 Last Sessions 0.5 0.4 Time Focus Problems Spent % Done 0.3 0.2 Mon, May 15 46 99% 153 0.1- Mon, May 1 0 0 Thu, Apr 27 20 95% 44 May Jun Aug Sop Oct Nov Dec Jan Feb Mar Apr Mon, Apr 24 15 73% 11 Fri, Apr 21 19 100% 54 Overall Grade Level Progress Wed, Apr 19 23 93% 27 Tue, Apr 18 33 94% 4.01 18 Mon, Apr 17 3.9 58 97% 147 3.6 3.4 Last Lesson Topics Done Identify the subject of a sentence P... In Progress 3.2 Score 3.0 28 2.6 Identify proper nouns that name da... In Progress 24 Choose between comparative and... Choose between comparative and... Form superlative adverbs Part 2 Form superlative adverbs Part 1 May 15 85% 2.2 May 15 85% 20 May 15 100% Sep 9 Oct 4 Oct 29 Nov 23 Dec 18 Jan 12 Feb 6 Mar 3 Mar 28 Apr 22 May 18 May 15 100% Form comparative adverbs Part 2 Form comparative adverbs Part 1 Choose between comparative and... May 15 85% Standards Passed Each Month May 15 45% 301 May 15 70% 27- Choose between comparative and... May 15 85% 24 21 18 15 Upcoming Lessons Complete Sentences 12 Simple, Compound, and Complex Sentences Title Capitalization Commas in Addresses Aug Sep Oct Nov Dec Jan Feb Mar Apr May Jun Jul ACT Aspire Summativ Assessed Apt 04:20:17 - Apr 2017 COLLEGE AND CAREER READINESS This information is from the ACT Aspire test. kind-his IGLISH 460 Ready 450 423 440 430 Exceeding 420 410 Close 400 SCIENCE Close 420 450 440 430 Exceeding You can see each subject tested and 420 where "Joe" scored. 410 He either scored In Need of Support Grade 3 4 In Need of Support 5 6 7 8 9 10 ACT Readiness Benchmark 420 National Average: 425 "ready", "close", or 400 "In need of support". Grade 3 45 6 7 8 9 10 ACT Readiness Benchmark: 423 National Average: 422 READING MATH 460 450 450 In Need of Close 440 440 Support 417 415 430 430 What are his subject Exceeding 420 areas of strength and 420 weakness? How did he Close 410 perform nationally? 410 In Need of Suppor In Need of Support 400 400 Grade 3 4 5 6 7 8 9 10 Grade 3 4 5 6 7 8 9 10 ACT Readiness Benchmark: 421 National Average: 420 ACT Readiness Benchmark: 420 National Average: 421 WRITING 450 In Need of Support 18 440 Exceeding 430 Ready Close 420 410 In Need of Support 400 Grade STEM Below Readiness 400 446 419 Your STEM score represents your overall performance on the Science and Math tests. NATIONAL PERCENTILE RANK 345678910 ELA Below Readiness 419 ACT Readiness Benchmark: 428 National Average: 426 403 444 Your English Language Arts (ELA) score represents your overall performance on the English, Reading, and Writing tests. PROGRESS WITH TEXT COMPLEXITY Sufficient Progress Yes No Students must read and understand increasingly complex texts to prepare for the reading demands of college and career. Examples of factors that contribute to text complexity are vocabulary level and sentence structure. The reading test measures progress with text complexity by checking for understanding of texts from a range of complexity levels. ACT Readiness Benchmark for Subjects: Students who score at or above these benchmarks are on target to meet ACT's College and Career Readiness Benchmarks when they leave high school. ACT Readiness Benchmark for ELA and STEM Predicted Path: A projection of where scores will fall based upon expected growth rates. National Average: The mean score of all students in the norm group. about the ACT Aspire assessment and results: DiscoverACTAspire.org Understand the ACT Readiness Level and subject skill performance: DiscoverACTAspire.org/performance-level-descriptors English 45th Reading 29th Writing 13th Science 42nd Math 30th Percantile 1st 25th 50th 75th 100th Your ranks show the percentage of grade 6 students in the nation who received a score that is the same as or lower than yours. For example, a rank of 45 for your English score means 45% of students earned that score or below. PROGRESS TOWARD CAREER READINESS English, Reading, Science, and Math must be tested in the same grade level (grade 8 and above only) to calculate a score. What does the section "Progress With Text Complexity" mean? How can you convey this information to parents? SCALE SCORE RANGE Subject Composite Range English 420-426 Reading 412-418 Writing 413-423 ELA 417-421 Science 418-422 Math STEM 414-420 417-421 All measurements, including test scores, contain uncertainty. Your test score indicates how well you performed on the actual test day. However, this range shows scores you would likely obiain if you took the test again without additional coursework. G2017 by ACT, bc. All rights reserved. ACT, Inc. Condensed www.DiscoverACTAspire.org 548 Crested 6/27/2017 { Aspire Hidromelancy Skill with fewer quasons may be less representative ACT Aspire Summative Assessed Apr 04, 2017-Apr 12, 2017 ENGLISH Production of Writing Birth Date Student ID Each subject is broken down into testing areas. What information can you gather here to convey to parents about Joe's strengths and weaknesses? 4 of 10 40% S Knowledge of Languaga 4 of 5 80% Conventions of Standard English 9 of 20 45% READING Key Ideas and Details 5 of 14 36% Craft and Structure 6 of 11 65% Integration of Knowledge and Ideas 2 of 4 50% WRITING Ideas and Analysis 2 of 6 33% Development and Support 2 of 8 33% Organization 2 of 6 33% Language Use and Conventions 3016 50% Interpretation of Data 8 of 14 57% Scientific Investigation 5 of 12 42% Evaluation of Models, Inferences, and Experimental Results 8 of 14 57% NATH Grade Level Progress 7 of 28 25% The Number System 1 of 4 25% Expressions & Equations Ratios and Proportional Relationships 1 of 4 25% 0 of 4 0% Georsetry 2 of 4 50% Statistics and Probability 0 of 4 0% Integrating Essential Skills 6 of 18 33% Justification and Explanation 5 of 16 31% Modeling 5 of 25 31% ACT Readiness Range: Shows where a student who has met the ACT Readiness Benchmark on this assessment would typically perform. IMPROVEMENT IDEAS TRO Production of Writing: Practice writing for a variety of purposes. Continue working on organizing ideas in logical, cohesive ways and on expressing ideas in a preciso, concise, and stylistically consistent manner. Knowledge of Language: In your writing, work on choosing language that is clear and precise, especially avoiding unnecessary wordiness and redundancy. Also focus on maintaining consistency in style and tone. Conventions of Standard English: Challenge yourself to write more complex sentences, avoiding errors such as misplaced modifiers. Work on using parts of speech and punctuation (including punctuating essential elements) correctly. WEAL Key Ideas and Details: Read as many grade-level texts as you can, focusing on informational texts. Work on reading closely, determining main ideas/thomes, and identifying sequences and relationships (comparative, cause/effect). Craft and Structure: As you read, consider the purpose of texts and parts of texts, how texts are structured, how authors use point of view, how context helps determine word meanings, and how authors use words and phrases. Integration of Knowledge and Ideas: As you read, consider how authors present their arguments. Also read multiple texts with similar topics or similar themes and look for connections between and among these texts. Ideas and Analysis: Practice prewriting strategies such as questioning and brainstorming to generate ideas for a story; when reading a story, try to identify the moral of the story or the lessons it teaches; identify and discuss reasons for selecting one topic for a story over others to fit your writing purpose. Development and Support Review model stories to identify and discuss what types of supporting details and events authors include in order to communicate their ideas; review your writing to identify areas where you can use more details to describe the experience and can explain your ideas with more precision. Organization: Use clustering, concept mapping, or another visual organizer to identify the relationships among the events or characters in a story. Practice arranging the details within a story so the story logically builds and progresses. Review your story to recognize when it wanders away from its main ideas. Language Use and Conventions: Read and discuss the works of skilled writers to become more familiar with correct language use; practice proofreading to identify obvious errors and missing words; revise your writing with a focus on clearly communicating your intended meaning while avoiding vague or imprecise word choices. X Interpretation of Data: Generate and interpret a greater number and variety of diata presentations (scientific tables, line graphs, diagrams). Use trends to extend data in data presentations (interpolation, extrapolation). Scientific investigation: Generate questions that can be investigated and then design and perform controlled experiments to validly test the questions. Examine complex scientific experiments involving multiple variables. Evaluation of Models, Inferences, and Experimental Results: Compare and evaluate the results of scientific experiments and compare and evaluate competing scientific explanations. Examine ways to improve on scientific experiments and explanations. Grade Level Progress: Complete your homework when assigned. Meet with a friend and quiz each other on the concepts learned each day. The Number System: Work on dividing fractions by other fractions. Can you explain what "absolute value" means in more than one way? Expressions & Equations: Work on solving one-variable equations and inequalities and evaluate numerical expressions with whole-number exponents. Can you write an equation that represents the cost of an item in terms of the quantity purchased? Ratios and Proportional Relationships: Work on connecting rate relationships to multiplication, division, and equivalent fractions. For a product at the store, determine the unit rate. .Geometry: Draw a variety of polygons in the standard coordinate plane. Explain how you use the coordinates of their vertices to find the area of those polygons, Statistics and Probability: Work on displaying data in plots on the number sine and summarizing data in relation to context. Integrating Essential Skills: Before you solve a math problem, predict how the solution will go and what method(s) will work. Justification and Explanation: Explain how to solve a problem ca a calculator and why it makes sense to do all the steps. Modeling: Ask someone to describe a mathematical situation and write a numerical statement describing it. That's creating a model. 0 62017 by ACT, Inc. All rights reserved. ACT, Inc. Condenal Resided www.DiscoverACTAspire.org 548 Created B27/2017 ACT spire ACT Aspire Summative Assessed Apr 21, 2016-Apr 25, 2016 Birth Date audent ID Current Progress. Hov potential assapo Howardanlocking his enaarde career? Page 1 of 2. Range Improvement Ideas Work on graphing ordered pairs of corresponding terms from two different pattems and use that to compare the patterns. Can you interpret the numerical expressions to predict something about values without actually finding values? MATH College and Career Readiness: Current and Predicted Path Percentage of Points Achieved in Subject Skills ACT Readiness Close 460 412 450 409-415 440 Score Range 430 Exceeding 420 Ready Geometry 33% Measurement and Data 33% Number and Operations in Base 10 33% 1 of 3 1 of 3 1 of 3 Justification and Explanation 25% 4 of 16 410 Close Grade Level Progress 22% 5 of 23 In Need of Support 400- Modeling 17% Grade 345 6 78910 _ACT Readiness Benchmark 418: National Average 4 of 24 Foundation 14% 2 of 14 Number and Operations-Fractions 0% Operations and Algebraic Thinking 0% 0 of 3 0 of 3 READING In Need of Support 450 409 440 407-411 430 Score Range Exceading 420 Rendy Close 410 In Need of Support 400- Grade 3 4 5 ACT Readiness Benchmark A score was not earned on the following subject tests: Science: Invalid Please contact your school if you have questions. 6 7 8 9 10 418: National Average Craft and Structure 65% Integration of Knowledge and Ideas 50% Key Ideas and Details 21% 5 of 11 2 of 4 3 of 14 ACT Readiness Range Read as many grade-level texts as you can. Work on identifying Important details, drawing reasonable conclusions, recognizing main ideas and themes, and understanding how parts of a text relate. ACT Readiness Benchmark: Students scoring at or above these benchmarks are on laget to meel ACT's College and Career Readiness Benchmarks. A student on target for College and Career Readiness is perferining at an academic achievement level that Indicates they are likely to be successful in college or job training after high school. Score Range: All measurements, including test scores, contain uncertainty. Your test score indicates how well you performed on the actual test day, however the Score Range shows the scores you would likely obtain if you took the test again without additional coursework. These scores are elinates of oldal knowledge and adiment. The student's actual element could be slightly higher or lower the scores shown. 2016 by ACT, Inc. Fight ACT Readiness Range: Where a student who has met the ACT Readiness Benchmark woukl typically perform. Predicted Path: Projection of where scores wil fall based upon expected growth rates. National Average: Mean score of all students in the norm group for the grade and subject. ACT, Inc-Conde Restled wwww.discoveractaspre.org/perl-overvielunderlanding-results! 548 Created 7/22/201 AC spire ACT Aspire Summative Assessed Apr 21 2016 Apr 25, 2016 NATIONAL PERCENTILE RANK Mathematics WW2 12th Reading 9th English Not tested Science Invalid Percentile Writing Not tested 25 50 75 100 Supplemental Scores How can additional performance measures inform decisions? ege 2 of 2 Your ranks show the percentage of other grade 5 students in the nation who received a score that is the same as or lower than yours. For example, a rank of 12 for your Mathematics score means 12% of students earned that score or below. ENGLISH LANGUAGE ARTS English, Reading and Writing Combined Score English, Reading, and Writing must be tested in the same grade level to calculate a score, PROGHEGO WMN TEXT GOMA CITY Students must read and understand increasingly complex texts to prepare for the reading demands of college and career. Examples of factors that contribute to text complexity are vocabulary level and sentence structure. The reading test measures progress with text complexity by checking for understanding of texts from a range of complexity levels. Sufficient Progress No Build reading experiences with texts about a variety of subjects. Make sure to check your understanding as you read, and practice using reading strategies to make sense of challenging texts. STEW Science and Mathematics Combined Score PROGRESS TOWARD CAREER READMESS Science and Mathematics must be tested in the same grade level to calculate a score. English, Reading, Science, and Mathematics must be tested in the same grade level (grade 8 and above only) to calculate a score. C Pay attention to the dates. Do specific times of the school year affect test data? Student Profile Profile: Mathematics est History Test Date: 4/20/17 Grade: Sixth 2452 (55) District Average Score: 2621 N: 17026 Test Date: 1/18/17 Mathematics Test (Grade 6) Score Ability Estimate Scaled Score 2452 SEM: (55) SIP 0% 100% Mathematics Overall For each test Grade: Sixth 2435 (56) Score Ability Estimate date, look at the grade District Average Score: 2574 N: Overall 18673 score. On Unit Score Range 1300 1/18/17, Joe scored 2435. Test Date: 8/30/16 The district Grade: Sixth 2230 (55) Number & Operations average score was 2574. Compare each test date and data provided to determine Joe's progress over the course of several years. District Average Score: 2502 N: 20407 Test Date: 4/12/16 Grade: Fifth 2311 (56), District Average Score: 2526 N: 19711 Test Date: 1/8/16 Grade: Fifth 2224 (54) District Average Score: 2478 N: 21488 Test Date: 8/27/15 Grade: Fifth 2150 (56) Measurement Algebra, Geometry, Measurement, and Data 2457-2580-2703 Analysis & Probability. Data Analysis & Where are his areas of Probability Algebra Geometry 2301-2417-2533 The range for Numbers and Operations is 2301-2533. Joe scored 2417. What does 2335-2462-2589 that tell you about his ability 2226-2355-2484 Look at the scores for with numbers and operations? 0 Test Date: 4/20/17 Pay attention to the range and current score. The range here is from 0-100, but Joe scored 30. What does that tell you about his overall mathematics ability? Do you think this is an accurate measure? 3700 strengths and weaknesses? 2303-2432-2561 Performance Rating Below Average District Average Score: 2415 N: 22572 Score NPR. National 13 The range is from 1-99 for student performance for the National Percentile Ranking. Joe scored 13. What does that tell you about him? Test Date: 4/6/15 Grade: Fourth 2312 (57) Percentile Ranking Score District Average Score: 2427 N: 19334 <2.0 Grade Level Equivalent (GLE) GLE 4.7 The grade level equivalent ranks from <2.0 to 39.9. Joe scared 4.7 while in the sixth grade. What does that tell you about his ability level? Test Date: 1/21/15 Grade: Fourth 2291 (57) Narrative District Average Score: 2365 N: 18091 ok our Mathematics performance assessment on 4/20/17 scaled score was 2452. Test Date: 9/9/14 Grade: Fourth 1717 (55) District Average Score: 2315 N: 22874 Test Date: 4/15/14 Grade: Third 2303 (55) District Average Score: 2333 N: 18924 Printed: 5/18/17 7:21 a.m. Page 1 of 2 The information on this page is for a sixth grade student taking the Moby Max assessment. Moby Max in an online learning program that differentiates lessons for students after testing. Math Dashboard Look at the date below for Overall Statistics. Do you think Joe is doing his best? Is he spending enough time on his assignments? May 18, 2017 Overall Statistics Grade Level Progress Current grade level 4.1 grade level Learning velocity 0.7 grades per year Grade Overall Current Proficiency 4.1 Beginning Proficiency 3.5 Increase 0.6 Avg time per day 22 minutes Grade K 100% 100% 0% The grade level equivalent ranks from <2.0 to >5.9. Joe scored 4.7 while in the sixth grade. What does that tell you about his ability Avg time per week 59 minutes Grade 1 100% 100% 0% level? Total time 224 minutes Grade 2 100% 93% 7% Grade 3 69% 56% 13% Session count 10 sessions Grade 4 16% 0% 16% Average focus % 93% Grade 6 23% 0% 23% Standards completed Lessons completed 22 standards Grade 7 7% 0% 7% Assessments completed 3 tests 23 lessons Grade Level Increase per Month Problems completed 1,680 problems 1.0 0.0 Last Sessions 0.6 0.7 Time Focus Problems 0.6 Spent % Done 0.5 Thu, May 11 0 0 Check grade level increase per month. What' information can you get from this chart that you can share with parents? Tue, May 9 21 93% 70 0.4) 0.3 Mon, May 8 55 98% 101 0.2 Fri, May 5 10 100% 52 Wed, May 3 0.1 37 87% 38 Mon, May 1 0 0 Ray Jun Jul Aug Sep Oct Nov Doc Jan Fob Mar Thu, Apr 27 18 94% 17 Mon, Apr 24 38 88% 50 Overall Grade Level Progress Last Lesson Topics Done 5.0 4.8 Score 4.5 In Progress Identify quadrilaterals Measure area by counting square u.. In Progress 4.4- 4.2 Check grade level increase per month. What information can you get from this chart that you can share with parents? Identify ratios 4.0+ In Progress Order fractions from least to greatest In Progress 3.8 Identify equivalent inequalities 3.6 In Progress Construct triangles from given angl... 3.4 May 9 80% 3.2 Construct equilateral and scalene tr.. May 9 100% Construct acute and obtuse triangles May 9 100% Aug 25 Sop 20 Oct 17 Nov 12 Dec 9 Jan 5 Jan 31 Feb 27 Mar 25 Apr 21 May 18 Construct right triangles May 9 100% Construct isosceles triangles May 9 80% The information below is in the same format as above, but it is for Reading. Use the same comment boxes to guide you as you gather information about your learner. Student Profile C Profile Reading Test History Reading Test (Grade 6) Test Date: 4/21/17 Test Date: 4/21/17 Score Grade: Sixth 2771 (63) Scaled Score Ability Estimate 2771 SEM: (63) District Average Score: 2783 N: 16931 03 SIP 100% Reading Overall Test Date: 1/18/17 Grade: Sixth 2648 (65) District Average Score: 2773 N: 18603 Test Date: 8/31/16 Grade: Sixth 2223 (61) Score Words Per Minute Reading Rate 670 Score Ability Estimate Overall Unit Score Range 1300 3700 District Average Score: 2697 N: 20676 Test Date: 4/13/16 Grade: Fifth 2160 (64) District Average Score: 2703 N: 19343 Test Date: 4/12/16 Grade: Fifth 1971 (64) District Average Score: 2703 N: 19343 Test Date: 1/15/16 Grade: Fifth 2191 (63) Vocabulary 2839-2937-3035 Long Passage 2585-2706-2827 Fiction 2399-2573-2747 Nonfiction 2448-2608-2768 Score Lexile BR500L OL 1700L Lexile Measure 860L District Average Score: 2675 N: 21302 Lexile Measure 860L (Research) Performance Test Date: 8/27/15 Rating Average-Low Grade: Fifth 1988 (63) District Average Score: 2588 N: 22092 Score NPR 99 National 33 Test Date: 4/10/15 Grade: Fourth 1895 (64) District Average Score: 2576 N: 18659 Test Date: 1/21/15 Grade: Fourth 2066 (63) District Average Score: 2527 N: 17452 Percentile Ranking Score Words Per Minute Reading Rate 670 Score GLE <2.0 59.9 Grade Level Equivalent 5.9 (GLE) Narrative Test Date: 9/9/14 ok our Reading performance assessment on 4/21/17 Bebe scaled score was 2771. Grade: Fourth 1794 (62) District Average Score: 2448 N: 22326 Printed: 5/18/17 7:21 a.m. Page 1 of 2 The information on this page is for a sixth grade student taking the Moby Max assessment. Moby Max in an online learning program that differentiates lessons for students after testing. Language Dashboard May 18, 2017 C Overall Statistics Grade Level Progress Current grade level 3.7 grade level Current Beginning Grade Proficiency Proficiency Increase Learning velocity Avg time per day 4.0 grades per year Overall 3.7 2.3 22 minutes Grade K 100% 100% Avg time per week 33 minutes Grade 1 100% 84% Total time Session count Average focus % Standards completed Assessments completed Lessons completed 155 minutes Grade 2 100% 45% 7 sessions Grade 3 66% 0% 97% Grade Level Increase per Month 31 standards 1.0 3 tests 0.9 46 lessons 0.8 Problems completed 2,715 problems 0.7 0,5 Last Sessions 0.5 0.4 Time Focus Problems Spent % Done 0.3 0.2 Mon, May 15 46 99% 153 0.1- Mon, May 1 0 0 Thu, Apr 27 20 95% 44 May Jun Aug Sop Oct Nov Dec Jan Feb Mar Apr Mon, Apr 24 15 73% 11 Fri, Apr 21 19 100% 54 Overall Grade Level Progress Wed, Apr 19 23 93% 27 Tue, Apr 18 33 94% 4.01 18 Mon, Apr 17 3.9 58 97% 147 3.6 3.4 Last Lesson Topics Done Identify the subject of a sentence P... In Progress 3.2 Score 3.0 28 2.6 Identify proper nouns that name da... In Progress 24 Choose between comparative and... Choose between comparative and... Form superlative adverbs Part 2 Form superlative adverbs Part 1 May 15 85% 2.2 May 15 85% 20 May 15 100% Sep 9 Oct 4 Oct 29 Nov 23 Dec 18 Jan 12 Feb 6 Mar 3 Mar 28 Apr 22 May 18 May 15 100% Form comparative adverbs Part 2 Form comparative adverbs Part 1 Choose between comparative and... May 15 85% Standards Passed Each Month May 15 45% 301 May 15 70% 27- Choose between comparative and... May 15 85% 24 21 18 15 Upcoming Lessons Complete Sentences 12 Simple, Compound, and Complex Sentences Title Capitalization Commas in Addresses Aug Sep Oct Nov Dec Jan Feb Mar Apr May Jun Jul ACT Aspire Summativ Assessed Apt 04:20:17 - Apr 2017 COLLEGE AND CAREER READINESS This information is from the ACT Aspire test. kind-his IGLISH 460 Ready 450 423 440 430 Exceeding 420 410 Close 400 SCIENCE Close 420 450 440 430 Exceeding You can see each subject tested and 420 where "Joe" scored. 410 He either scored In Need of Support Grade 3 4 In Need of Support 5 6 7 8 9 10 ACT Readiness Benchmark 420 National Average: 425 "ready", "close", or 400 "In need of support". Grade 3 45 6 7 8 9 10 ACT Readiness Benchmark: 423 National Average: 422 READING MATH 460 450 450 In Need of Close 440 440 Support 417 415 430 430 What are his subject Exceeding 420 areas of strength and 420 weakness? How did he Close 410 perform nationally? 410 In Need of Suppor In Need of Support 400 400 Grade 3 4 5 6 7 8 9 10 Grade 3 4 5 6 7 8 9 10 ACT Readiness Benchmark: 421 National Average: 420 ACT Readiness Benchmark: 420 National Average: 421 WRITING 450 In Need of Support 18 440 Exceeding 430 Ready Close 420 410 In Need of Support 400 Grade STEM Below Readiness 400 446 419 Your STEM score represents your overall performance on the Science and Math tests. NATIONAL PERCENTILE RANK 345678910 ELA Below Readiness 419 ACT Readiness Benchmark: 428 National Average: 426 403 444 Your English Language Arts (ELA) score represents your overall performance on the English, Reading, and Writing tests. PROGRESS WITH TEXT COMPLEXITY Sufficient Progress Yes No Students must read and understand increasingly complex texts to prepare for the reading demands of college and career. Examples of factors that contribute to text complexity are vocabulary level and sentence structure. The reading test measures progress with text complexity by checking for understanding of texts from a range of complexity levels. ACT Readiness Benchmark for Subjects: Students who score at or above these benchmarks are on target to meet ACT's College and Career Readiness Benchmarks when they leave high school. ACT Readiness Benchmark for ELA and STEM Predicted Path: A projection of where scores will fall based upon expected growth rates. National Average: The mean score of all students in the norm group. about the ACT Aspire assessment and results: DiscoverACTAspire.org Understand the ACT Readiness Level and subject skill performance: DiscoverACTAspire.org/performance-level-descriptors English 45th Reading 29th Writing 13th Science 42nd Math 30th Percantile 1st 25th 50th 75th 100th Your ranks show the percentage of grade 6 students in the nation who received a score that is the same as or lower than yours. For example, a rank of 45 for your English score means 45% of students earned that score or below. PROGRESS TOWARD CAREER READINESS English, Reading, Science, and Math must be tested in the same grade level (grade 8 and above only) to calculate a score. What does the section "Progress With Text Complexity" mean? How can you convey this information to parents? SCALE SCORE RANGE Subject Composite Range English 420-426 Reading 412-418 Writing 413-423 ELA 417-421 Science 418-422 Math STEM 414-420 417-421 All measurements, including test scores, contain uncertainty. Your test score indicates how well you performed on the actual test day. However, this range shows scores you would likely obiain if you took the test again without additional coursework. G2017 by ACT, bc. All rights reserved. ACT, Inc. Condensed www.DiscoverACTAspire.org 548 Crested 6/27/2017 { Aspire Hidromelancy Skill with fewer quasons may be less representative ACT Aspire Summative Assessed Apr 04, 2017-Apr 12, 2017 ENGLISH Production of Writing Birth Date Student ID Each subject is broken down into testing areas. What information can you gather here to convey to parents about Joe's strengths and weaknesses? 4 of 10 40% S Knowledge of Languaga 4 of 5 80% Conventions of Standard English 9 of 20 45% READING Key Ideas and Details 5 of 14 36% Craft and Structure 6 of 11 65% Integration of Knowledge and Ideas 2 of 4 50% WRITING Ideas and Analysis 2 of 6 33% Development and Support 2 of 8 33% Organization 2 of 6 33% Language Use and Conventions 3016 50% Interpretation of Data 8 of 14 57% Scientific Investigation 5 of 12 42% Evaluation of Models, Inferences, and Experimental Results 8 of 14 57% NATH Grade Level Progress 7 of 28 25% The Number System 1 of 4 25% Expressions & Equations Ratios and Proportional Relationships 1 of 4 25% 0 of 4 0% Georsetry 2 of 4 50% Statistics and Probability 0 of 4 0% Integrating Essential Skills 6 of 18 33% Justification and Explanation 5 of 16 31% Modeling 5 of 25 31% ACT Readiness Range: Shows where a student who has met the ACT Readiness Benchmark on this assessment would typically perform. IMPROVEMENT IDEAS TRO Production of Writing: Practice writing for a variety of purposes. Continue working on organizing ideas in logical, cohesive ways and on expressing ideas in a preciso, concise, and stylistically consistent manner. Knowledge of Language: In your writing, work on choosing language that is clear and precise, especially avoiding unnecessary wordiness and redundancy. Also focus on maintaining consistency in style and tone. Conventions of Standard English: Challenge yourself to write more complex sentences, avoiding errors such as misplaced modifiers. Work on using parts of speech and punctuation (including punctuating essential elements) correctly. WEAL Key Ideas and Details: Read as many grade-level texts as you can, focusing on informational texts. Work on reading closely, determining main ideas/thomes, and identifying sequences and relationships (comparative, cause/effect). Craft and Structure: As you read, consider the purpose of texts and parts of texts, how texts are structured, how authors use point of view, how context helps determine word meanings, and how authors use words and phrases. Integration of Knowledge and Ideas: As you read, consider how authors present their arguments. Also read multiple texts with similar topics or similar themes and look for connections between and among these texts. Ideas and Analysis: Practice prewriting strategies such as questioning and brainstorming to generate ideas for a story; when reading a story, try to identify the moral of the story or the lessons it teaches; identify and discuss reasons for selecting one topic for a story over others to fit your writing purpose. Development and Support Review model stories to identify and discuss what types of supporting details and events authors include in order to communicate their ideas; review your writing to identify areas where you can use more details to describe the experience and can explain your ideas with more precision. Organization: Use clustering, concept mapping, or another visual organizer to identify the relationships among the events or characters in a story. Practice arranging the details within a story so the story logically builds and progresses. Review your story to recognize when it wanders away from its main ideas. Language Use and Conventions: Read and discuss the works of skilled writers to become more familiar with correct language use; practice proofreading to identify obvious errors and missing words; revise your writing with a focus on clearly communicating your intended meaning while avoiding vague or imprecise word choices. X Interpretation of Data: Generate and interpret a greater number and variety of diata presentations (scientific tables, line graphs, diagrams). Use trends to extend data in data presentations (interpolation, extrapolation). Scientific investigation: Generate questions that can be investigated and then design and perform controlled experiments to validly test the questions. Examine complex scientific experiments involving multiple variables. Evaluation of Models, Inferences, and Experimental Results: Compare and evaluate the results of scientific experiments and compare and evaluate competing scientific explanations. Examine ways to improve on scientific experiments and explanations. Grade Level Progress: Complete your homework when assigned. Meet with a friend and quiz each other on the concepts learned each day. The Number System: Work on dividing fractions by other fractions. Can you explain what "absolute value" means in more than one way? Expressions & Equations: Work on solving one-variable equations and inequalities and evaluate numerical expressions with whole-number exponents. Can you write an equation that represents the cost of an item in terms of the quantity purchased? Ratios and Proportional Relationships: Work on connecting rate relationships to multiplication, division, and equivalent fractions. For a product at the store, determine the unit rate. .Geometry: Draw a variety of polygons in the standard coordinate plane. Explain how you use the coordinates of their vertices to find the area of those polygons, Statistics and Probability: Work on displaying data in plots on the number sine and summarizing data in relation to context. Integrating Essential Skills: Before you solve a math problem, predict how the solution will go and what method(s) will work. Justification and Explanation: Explain how to solve a problem ca a calculator and why it makes sense to do all the steps. Modeling: Ask someone to describe a mathematical situation and write a numerical statement describing it. That's creating a model. 0 62017 by ACT, Inc. All rights reserved. ACT, Inc. Condenal Resided www.DiscoverACTAspire.org 548 Created B27/2017 ACT spire ACT Aspire Summative Assessed Apr 21, 2016-Apr 25, 2016 Birth Date audent ID Current Progress. Hov potential assapo Howardanlocking his enaarde career? Page 1 of 2. Range Improvement Ideas Work on graphing ordered pairs of corresponding terms from two different pattems and use that to compare the patterns. Can you interpret the numerical expressions to predict something about values without actually finding values? MATH College and Career Readiness: Current and Predicted Path Percentage of Points Achieved in Subject Skills ACT Readiness Close 460 412 450 409-415 440 Score Range 430 Exceeding 420 Ready Geometry 33% Measurement and Data 33% Number and Operations in Base 10 33% 1 of 3 1 of 3 1 of 3 Justification and Explanation 25% 4 of 16 410 Close Grade Level Progress 22% 5 of 23 In Need of Support 400- Modeling 17% Grade 345 6 78910 _ACT Readiness Benchmark 418: National Average 4 of 24 Foundation 14% 2 of 14 Number and Operations-Fractions 0% Operations and Algebraic Thinking 0% 0 of 3 0 of 3 READING In Need of Support 450 409 440 407-411 430 Score Range Exceading 420 Rendy Close 410 In Need of Support 400- Grade 3 4 5 ACT Readiness Benchmark A score was not earned on the following subject tests: Science: Invalid Please contact your school if you have questions. 6 7 8 9 10 418: National Average Craft and Structure 65% Integration of Knowledge and Ideas 50% Key Ideas and Details 21% 5 of 11 2 of 4 3 of 14 ACT Readiness Range Read as many grade-level texts as you can. Work on identifying Important details, drawing reasonable conclusions, recognizing main ideas and themes, and understanding how parts of a text relate. ACT Readiness Benchmark: Students scoring at or above these benchmarks are on laget to meel ACT's College and Career Readiness Benchmarks. A student on target for College and Career Readiness is perferining at an academic achievement level that Indicates they are likely to be successful in college or job training after high school. Score Range: All measurements, including test scores, contain uncertainty. Your test score indicates how well you performed on the actual test day, however the Score Range shows the scores you would likely obtain if you took the test again without additional coursework. These scores are elinates of oldal knowledge and adiment. The student's actual element could be slightly higher or lower the scores shown. 2016 by ACT, Inc. Fight ACT Readiness Range: Where a student who has met the ACT Readiness Benchmark woukl typically perform. Predicted Path: Projection of where scores wil fall based upon expected growth rates. National Average: Mean score of all students in the norm group for the grade and subject. ACT, Inc-Conde Restled wwww.discoveractaspre.org/perl-overvielunderlanding-results! 548 Created 7/22/201 AC spire ACT Aspire Summative Assessed Apr 21 2016 Apr 25, 2016 NATIONAL PERCENTILE RANK Mathematics WW2 12th Reading 9th English Not tested Science Invalid Percentile Writing Not tested 25 50 75 100 Supplemental Scores How can additional performance measures inform decisions? ege 2 of 2 Your ranks show the percentage of other grade 5 students in the nation who received a score that is the same as or lower than yours. For example, a rank of 12 for your Mathematics score means 12% of students earned that score or below. ENGLISH LANGUAGE ARTS English, Reading and Writing Combined Score English, Reading, and Writing must be tested in the same grade level to calculate a score, PROGHEGO WMN TEXT GOMA CITY Students must read and understand increasingly complex texts to prepare for the reading demands of college and career. Examples of factors that contribute to text complexity are vocabulary level and sentence structure. The reading test measures progress with text complexity by checking for understanding of texts from a range of complexity levels. Sufficient Progress No Build reading experiences with texts about a variety of subjects. Make sure to check your understanding as you read, and practice using reading strategies to make sense of challenging texts. STEW Science and Mathematics Combined Score PROGRESS TOWARD CAREER READMESS Science and Mathematics must be tested in the same grade level to calculate a score. English, Reading, Science, and Mathematics must be tested in the same grade level (grade 8 and above only) to calculate a score.
Expert Answer:

Posted Date:
Students also viewed these mathematics questions
-
The HaberBosch process for the production of ammonia is one of the key industrial processes in developed countries. N 2 (g) + 3 H 2 (g) 2 NH 3 (g) (a) Calculate r G for the reaction at 298 K, 800...
-
Oki Company pays $ 264,000 for equipment expected to last four years and have a $ 29,000 salvage value . Prepare journal entries to record the following costs related to the equipment. 1. During the...
-
A 2-m-high, 4-m-wide rectangular advertisement panel is attached to a 4-m-wide, 0.15-m-high rectangular concrete block (density 5 2300 kg/m3) by two 5-cm-diameter, 4-m-high (exposed part) poles, as...
-
Operating results for department B of Delta Company during 2016 are as follows: If department B could maintain the same physical volume of product sold while raising selling prices an average of 15%...
-
The following narrative describes the processing of customer mail orders at Eye- Dee- A- Pet, Inc.: Eye- Dee- A- Pet, Inc. is a small manufacturing operation engaged in the selling of digital...
-
An ICMP (ping) request consists of which two components ? We can tell which is which from the type Echo Request and Echo Reply [Select] Echo Request and Echo Reply ping type 1 and Ping type 2
-
The organizer of a conference is selecting workshops to include. She will select from 5 workshops about anthropology and 8 workshops about psychology. In how many ways can she select 6 workshops if...
-
PharmaOne Inc. is a private company that operates a chain of 3 0 drug stores in Western Canada. PharmaOne is considering upgrading the software in its pharmacies to allow doctors offices to transmit...
-
Simon Company's year-end balance sheets follow. At December 31 Assets Cash Accounts receivable, net Merchandise inventory Prepaid expenses Plant assets, net Total assets Liabilities and Equity...
-
Apply topological sorting algorithm 7 5 6 4 2 3 1 0
-
Robert Lim is the administrator of his fathers estate who passed away on 1 5 November 2 0 1 8 . His father owned a bungalow house with land in the vicinity of Bangsar which he bought on 7 December 2...
-
This discussion assignment requires reading the Zenith case in the HBS Coursepack. In the case, Zenith's decisionmakers must decide what, if any, marketing research should be conducted as it prepares...
-
Identify two specific changes you would make to the Frank-Dodd Act based on the current accounting environment.
-
Use Stokes' Theorem to evaluate f(y+sin x) dx+(z+cos y) dy+rdz, where C is the rve r(t) = (sint, cost, sin 2t), t = [0, 2].

Study smarter with the SolutionInn App