

Question: Can you please get me the descriptive answer for the below question: After taking 8 samples (each sample contains 5 parts) youwant to calculate the
Can you please get me the descriptive answer for the below question:
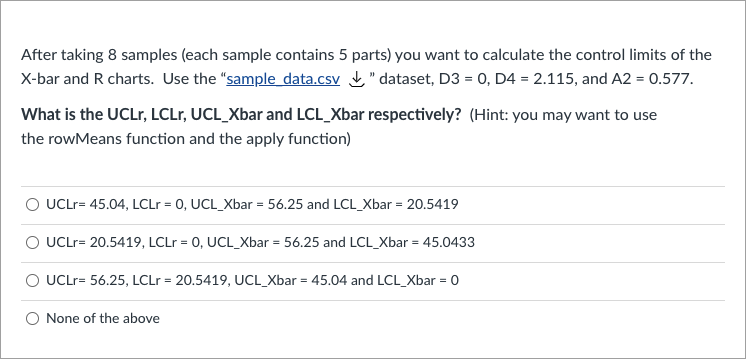
After taking 8 samples (each sample contains 5 parts) youwant to calculate the control limits of the X-bar and R charts.Use the "sample_data.csv
download
"dataset,D3 = 0, D4 = 2.115, and A2 = 0.577.
What is theUCLr,LCLr,UCL_XbarandLCL_Xbarrespectively?(Hint: you may want to use therowMeansfunction and the apply function)
Group of answer choices
UCLr= 45.04, LCLr = 0, UCL_Xbar = 56.25 and LCL_Xbar = 20.5419
UCLr= 20.5419, LCLr = 0, UCL_Xbar = 56.25 and LCL_Xbar = 45.0433
UCLr= 56.25, LCLr = 20.5419, UCL_Xbar = 45.04 and LCL_Xbar = 0
None of the above
After taking 8 samples (each sample contains 5 parts) you want to calculate the control limits of the X-bar and R charts. Use the "sample data.csv & " dataset, D3 = 0, D4 = 2.115, and A2 = 0.577. What is the UCLr, LCLr, UCL_Xbar and LCL_Xbar respectively? (Hint: you may want to use the rowMeans function and the apply function) O UCLr= 45.04, LCLr = 0, UCL_Xbar = 56.25 and LCL_Xbar = 20.5419 O UCLr= 20.5419, LCLr = 0, UCL_Xbar = 56.25 and LCL_Xbar = 45.0433 O UCLr= 56.25, LCLr = 20.5419, UCL_Xbar = 45.04 and LCL_Xbar = 0 O None of the above
Step by Step Solution
There are 3 Steps involved in it

Get step-by-step solutions from verified subject matter experts