

The accompanying table shows the maximum weights (in kilograms) for which one repetition of a half...
Fantastic news! We've Found the answer you've been seeking!
Question:

Transcribed Image Text:
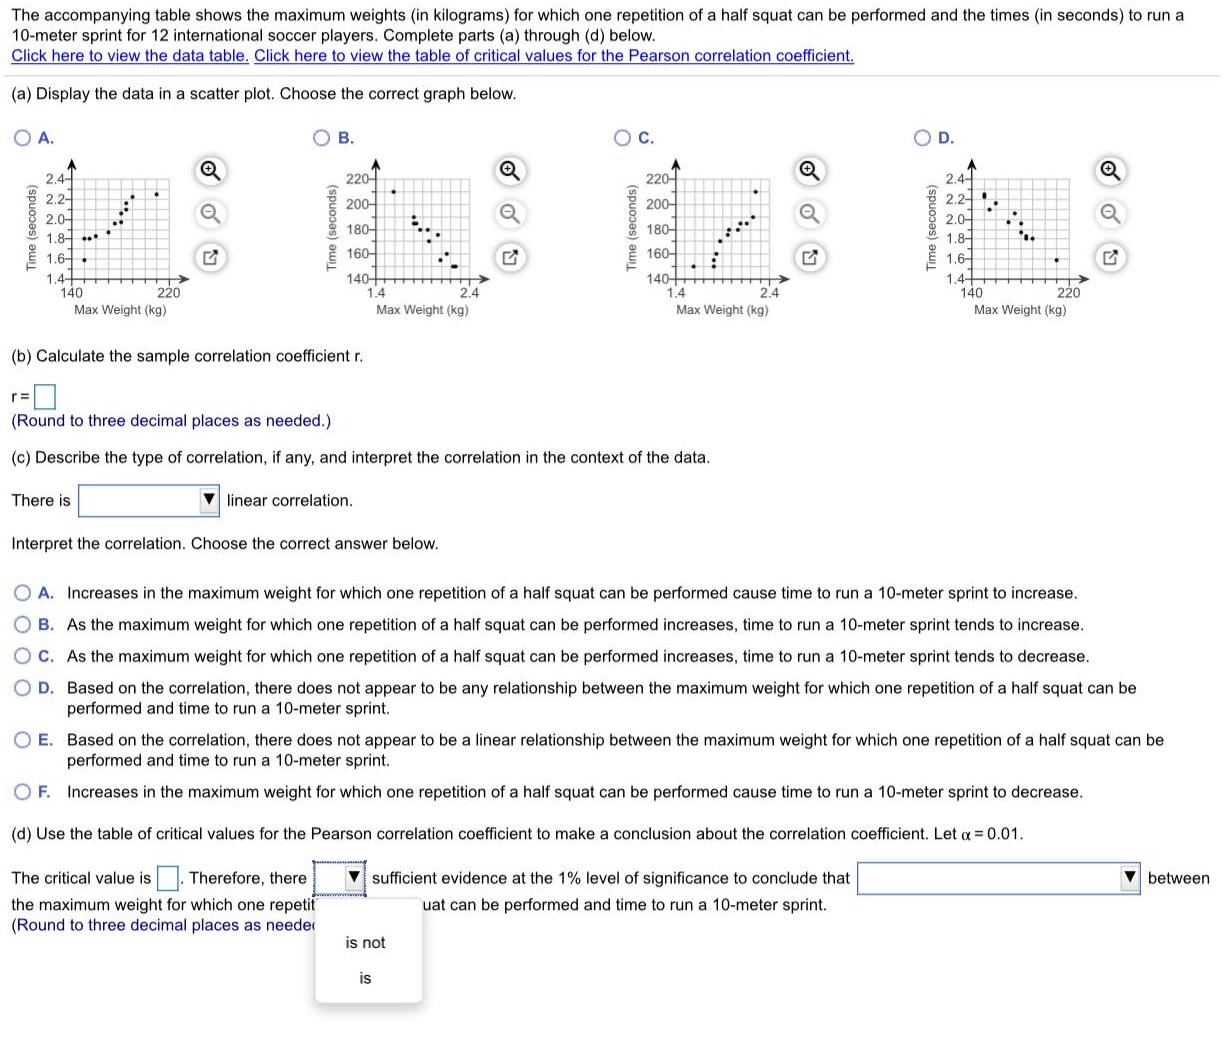
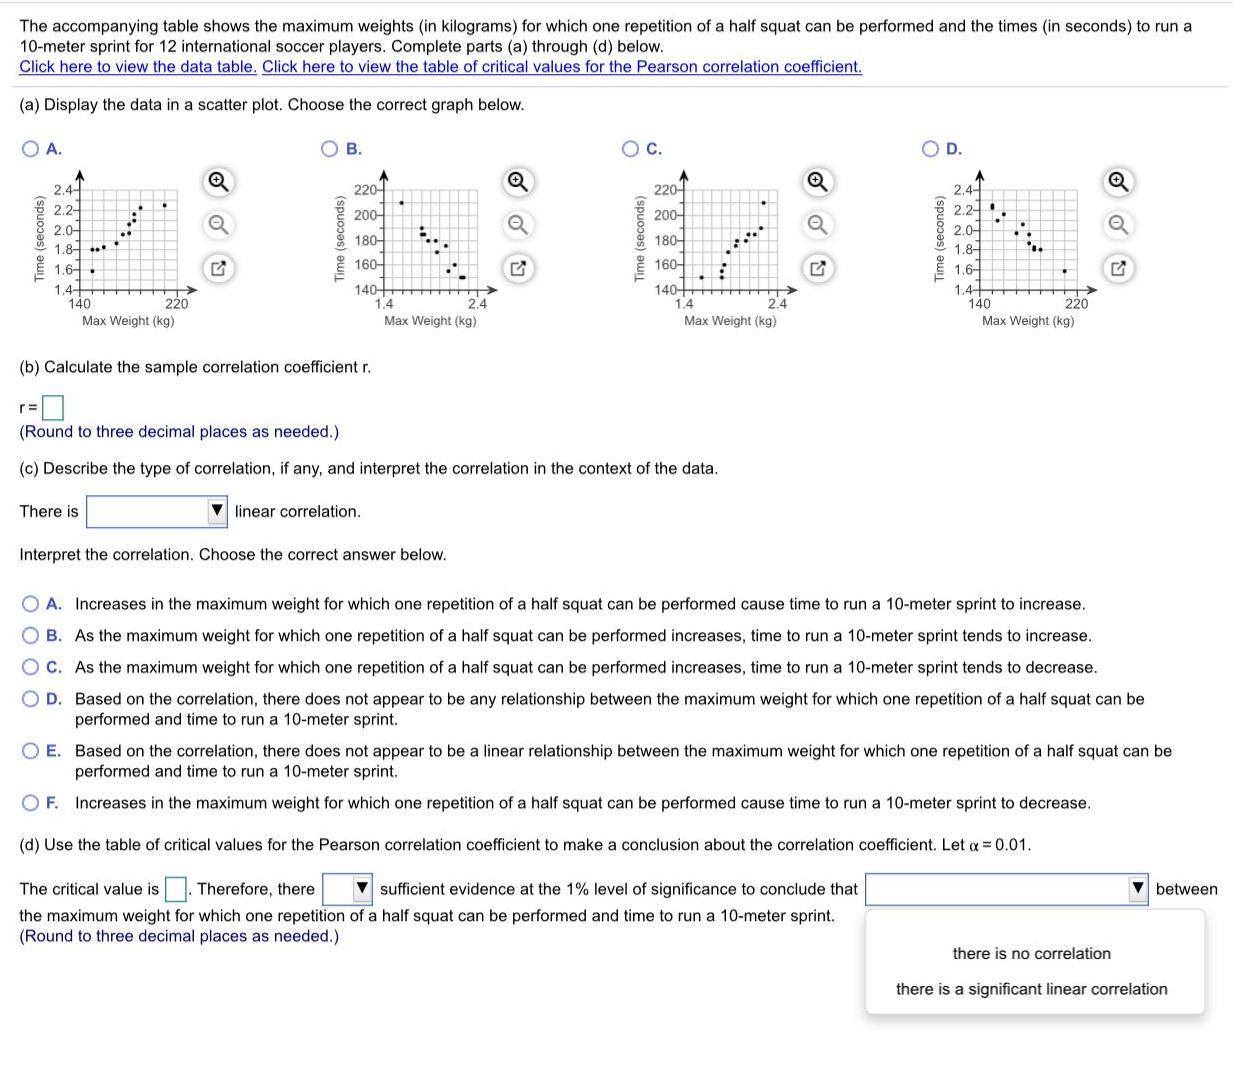
The accompanying table shows the maximum weights (in kilograms) for which one repetition of a half squat can be performed and the times (in seconds) to run a 10-meter sprint for 12 international soccer players. Complete parts (a) through (d) below. Click here to view the data table. Click here to view the table of critical values for the Pearson correlation coefficient. (a) Display the data in a scatter plot. Choose the correct graph below. O A. В. С. D. 2.4- 2.2- 2.0- 1.8- 2.4- 220- 220 2.2- 200- 200- 2.0- 180- 180- 1.8- .* 160- 160- 1.6- 1.4 140 Max Weight (kg) 1.6- 1.4 140 Max Weight (kg) 140- 1.4 140+ 1.4 220 2.4 Max Weight (kg) 2.4 220 Max Weight (kg) (b) Calculate the sample correlation coefficient r. (Round to three decimal places as needed.) (c) Describe the type of correlation, if any, and interpret the correlation in the context of the data. There is V linear correlation. Interprett correct answer below, a perfect positive O A. In eight for which one repetition of a half squat can be performed cause time to run a 10-meter sprint to increase. no О В. А vhich one repetition of a half squat can be performed increases, time to run a 10-meter sprint tends to increase. a strong negative ОС. А vhich one repetition of a half squat can be performed increases, time to run a 10-meter sprint tends to decrease. a weak positive O D. B re does not appear to be any relationship between the maximum weight for which one repetition of a half squat can be 10-meter sprint. pe a weak negative ОЕ. В re does not appear to be a linear relationship between the maximum weight for which one repetition of a half squat can be 10-meter sprint. a perfect negative pi a strong positive O F. In eight for which one repetition of a half squat can be performed cause time to run a 10-meter sprint to decrease. (d) Use the table of critical values for the Pearson correlation coefficient to make a conclusion about the correlation coefficient. Let a = 0.01. The critical value is. Therefore, there sufficient evidence at the 1% level of significance to conclude that V between the maximum weight for which one repetition of a half squat can be performed and time to run a 10-meter sprint. (Round to three decimal places as needed.) The accompanying table shows the maximum weights (in kilograms) for which one repetition of a half squat can be performed and the times (in seconds) to run a 10-meter sprint for 12 international soccer players. Complete parts (a) through (d) below. Click here to view the data table. Click here to view the table critical values for the Pearson correlation coefficient. (a) Display the data in a scatter plot. Choose the correct graph below. O A. В. OC. OD. 220 2.4- 2.2- 2.0- 220- 2.4- 2.2- 2.0- 1.8- 1.6- 1.4 140 Max Weight (kg) 200- 200- 180- 180- 1.8- .* 1.6-. 160- 160- 1.4+ 140 Max Weight (kg) 140- 1.4 140- 1.4 220 2.4 220 2.4 Max Weight (kg) Max Weight (kg) (b) Calculate the sample correlation coefficient r. (Round to three decimal places as needed.) (c) Describe the type of correlation, if any, and interpret the correlation in the context of the data. There is linear correlation. Interpret the correlation. Choose the correct answer below. O A. Increases in the maximum weight for which one repetition of a half squat can be performed cause time to run a 10-meter sprint to increase. O B. As the maximum weight for which one repetition of a half squat can be performed increases, time to run a 10-meter sprint tends to increase. O C. As the maximum weight for which one repetition of a half squat can be performed increases, time to run a 10-meter sprint tends to decrease. O D. Based on the correlation, there does not appear to be any relationship between the maximum weight for which one repetition of a half squat can be performed and time to run a 10-meter sprint. O E. Based on the correlation, there does not appear to be a linear relationship between the maximum weight for which one repetition of a half squat can be performed and time to run a 10-meter sprint. O F. Increases in the maximum weight for which one repetition of a half squat can be performed cause time to run a 10-meter sprint to decrease. (d) Use the table of critical values for the Pearson correlation coefficient to make a conclusion about the correlation coefficient. Let a = 0.01. The critical value is. Therefore, there the maximum weight for which one repetit (Round to three decimal places as needer sufficient evidence at the 1% level of significance to conclude that between uat can be performed and time to run a 10-meter sprint. is not is The accompanying table shows the maximum weights (in kilograms) for which one repetition of a half squat can be performed and the times (in seconds) to run a 10-meter sprint for 12 international soccer players. Complete parts (a) through (d) below. Click here to view the data table. Click here to view the table of critical values for the Pearson correlation coefficient. (a) Display the data in a scatter plot. Choose the correct graph below. OA. В. OC. OD. 2.4- 220- 220어 2.4- 2.2- 2.2- 2.0- 1.8- 1.6- 1.4 200어 200- 2.0어 1.8- ..* 1,6- 180- 180- 160- 160- 1.4+ 140 Max Weight (kg) 140- 1.4 Max Weight (kg) 140- 1.4 220 2.4 2.4 140 220 Max Weight (kg) Max Weight (kg) (b) Calculate the sample correlation coefficient r. (Round to three decimal places as needed.) (c) Describe the type of correlation, if any, and interpret the correlation in the context of the data. There is linear correlation. Interpret the correlation. Choose the correct answer below. O A. Increases in the maximum weight for which one repetition of a half squat can be performed cause time to run a 10-meter sprint to increase. O B. As the maximum weight for which one repetition of a half squat can be performed increases, time to run a 10-meter sprint tends to increase. O C. As the maximum weight for which one repetition of a half squat can be performed increases, time to run a 10-meter sprint tends to decrease. O D. Based on the correlation, there does not appear to be any relationship between the maximum weight for which one repetition of a half squat can be performed and time to run a 10-meter sprint. O E. Based on the correlation, there does not appear to be a linear relationship between the maximum weight for which one repetition of a half squat can be performed and time to run a 10-meter sprint. O F. Increases in the maximum weight for which one repetition of a half squat can be performed cause time to run a 10-meter sprint to decrease. (d) Use the table of critical values for the Pearson correlation coefficient to make a conclusion about the correlation coefficient. Let a = 0.01. The critical value is Therefore, there V sufficient evidence at the 1% level of significance to conclude that between the maximum weight for which one repetition of a half squat can be performed and time to run a 10-meter sprint. (Round to three decimal places as needed.) there is no correlation there is a significant linear correlation Time (seconds) Time (seconds) Time (seconds) Time (seconds) The accompanying table shows the maximum weights (in kilograms) for which one repetition of a half squat can be performed and the times (in seconds) to run a 10-meter sprint for 12 international soccer players. Complete parts (a) through (d) below. Click here to view the data table. Click here to view the table of critical values for the Pearson correlation coefficient. (a) Display the data in a scatter plot. Choose the correct graph below. O A. В. С. D. 2.4- 2.2- 2.0- 1.8- 2.4- 220- 220 2.2- 200- 200- 2.0- 180- 180- 1.8- .* 160- 160- 1.6- 1.4 140 Max Weight (kg) 1.6- 1.4 140 Max Weight (kg) 140- 1.4 140+ 1.4 220 2.4 Max Weight (kg) 2.4 220 Max Weight (kg) (b) Calculate the sample correlation coefficient r. (Round to three decimal places as needed.) (c) Describe the type of correlation, if any, and interpret the correlation in the context of the data. There is V linear correlation. Interprett correct answer below, a perfect positive O A. In eight for which one repetition of a half squat can be performed cause time to run a 10-meter sprint to increase. no О В. А vhich one repetition of a half squat can be performed increases, time to run a 10-meter sprint tends to increase. a strong negative ОС. А vhich one repetition of a half squat can be performed increases, time to run a 10-meter sprint tends to decrease. a weak positive O D. B re does not appear to be any relationship between the maximum weight for which one repetition of a half squat can be 10-meter sprint. pe a weak negative ОЕ. В re does not appear to be a linear relationship between the maximum weight for which one repetition of a half squat can be 10-meter sprint. a perfect negative pi a strong positive O F. In eight for which one repetition of a half squat can be performed cause time to run a 10-meter sprint to decrease. (d) Use the table of critical values for the Pearson correlation coefficient to make a conclusion about the correlation coefficient. Let a = 0.01. The critical value is. Therefore, there sufficient evidence at the 1% level of significance to conclude that V between the maximum weight for which one repetition of a half squat can be performed and time to run a 10-meter sprint. (Round to three decimal places as needed.) The accompanying table shows the maximum weights (in kilograms) for which one repetition of a half squat can be performed and the times (in seconds) to run a 10-meter sprint for 12 international soccer players. Complete parts (a) through (d) below. Click here to view the data table. Click here to view the table critical values for the Pearson correlation coefficient. (a) Display the data in a scatter plot. Choose the correct graph below. O A. В. OC. OD. 220 2.4- 2.2- 2.0- 220- 2.4- 2.2- 2.0- 1.8- 1.6- 1.4 140 Max Weight (kg) 200- 200- 180- 180- 1.8- .* 1.6-. 160- 160- 1.4+ 140 Max Weight (kg) 140- 1.4 140- 1.4 220 2.4 220 2.4 Max Weight (kg) Max Weight (kg) (b) Calculate the sample correlation coefficient r. (Round to three decimal places as needed.) (c) Describe the type of correlation, if any, and interpret the correlation in the context of the data. There is linear correlation. Interpret the correlation. Choose the correct answer below. O A. Increases in the maximum weight for which one repetition of a half squat can be performed cause time to run a 10-meter sprint to increase. O B. As the maximum weight for which one repetition of a half squat can be performed increases, time to run a 10-meter sprint tends to increase. O C. As the maximum weight for which one repetition of a half squat can be performed increases, time to run a 10-meter sprint tends to decrease. O D. Based on the correlation, there does not appear to be any relationship between the maximum weight for which one repetition of a half squat can be performed and time to run a 10-meter sprint. O E. Based on the correlation, there does not appear to be a linear relationship between the maximum weight for which one repetition of a half squat can be performed and time to run a 10-meter sprint. O F. Increases in the maximum weight for which one repetition of a half squat can be performed cause time to run a 10-meter sprint to decrease. (d) Use the table of critical values for the Pearson correlation coefficient to make a conclusion about the correlation coefficient. Let a = 0.01. The critical value is. Therefore, there the maximum weight for which one repetit (Round to three decimal places as needer sufficient evidence at the 1% level of significance to conclude that between uat can be performed and time to run a 10-meter sprint. is not is The accompanying table shows the maximum weights (in kilograms) for which one repetition of a half squat can be performed and the times (in seconds) to run a 10-meter sprint for 12 international soccer players. Complete parts (a) through (d) below. Click here to view the data table. Click here to view the table of critical values for the Pearson correlation coefficient. (a) Display the data in a scatter plot. Choose the correct graph below. OA. В. OC. OD. 2.4- 220- 220어 2.4- 2.2- 2.2- 2.0- 1.8- 1.6- 1.4 200어 200- 2.0어 1.8- ..* 1,6- 180- 180- 160- 160- 1.4+ 140 Max Weight (kg) 140- 1.4 Max Weight (kg) 140- 1.4 220 2.4 2.4 140 220 Max Weight (kg) Max Weight (kg) (b) Calculate the sample correlation coefficient r. (Round to three decimal places as needed.) (c) Describe the type of correlation, if any, and interpret the correlation in the context of the data. There is linear correlation. Interpret the correlation. Choose the correct answer below. O A. Increases in the maximum weight for which one repetition of a half squat can be performed cause time to run a 10-meter sprint to increase. O B. As the maximum weight for which one repetition of a half squat can be performed increases, time to run a 10-meter sprint tends to increase. O C. As the maximum weight for which one repetition of a half squat can be performed increases, time to run a 10-meter sprint tends to decrease. O D. Based on the correlation, there does not appear to be any relationship between the maximum weight for which one repetition of a half squat can be performed and time to run a 10-meter sprint. O E. Based on the correlation, there does not appear to be a linear relationship between the maximum weight for which one repetition of a half squat can be performed and time to run a 10-meter sprint. O F. Increases in the maximum weight for which one repetition of a half squat can be performed cause time to run a 10-meter sprint to decrease. (d) Use the table of critical values for the Pearson correlation coefficient to make a conclusion about the correlation coefficient. Let a = 0.01. The critical value is Therefore, there V sufficient evidence at the 1% level of significance to conclude that between the maximum weight for which one repetition of a half squat can be performed and time to run a 10-meter sprint. (Round to three decimal places as needed.) there is no correlation there is a significant linear correlation Time (seconds) Time (seconds) Time (seconds) Time (seconds)
Expert Answer:

Related Book For 

Posted Date:
Students also viewed these mathematics questions
-
The maximum weights (in kilograms) for which one repetition of a half squat can be performed and the times (in seconds) to run a 10-meter sprint for 12 international soccer players (a) Display the...
-
The maximum weights (in kilograms) for which one repetition of a half squat can be performed and the jump heights (in centimeters) for 12 international soccer players (a) Display the data in a...
-
The accompanying table shows Tanisha's and Ari's individual marginal benefit of different amounts of street cleanings per month. Suppose that the marginal cost of street cleanings is constant at $9...
-
In Exercises use the differential equation and the specified initial condition to find y. dy dx || 1 4 - x y(0) = -
-
Which is not a characteristic of using a log scale to display time series data? Explain. a. A log scale helps if we are comparing changes in two time series of dissimilar magnitude. b. General...
-
Consider Exercise 9.1 and S 2 , the estimator of 2 . Analysts often use S 2 rather than dividing N i=1 (X i X) 2 by n 1, the degrees of freedom in the sample. (a) What is the bias of S 2 ? (b)...
-
Redesign and implementation of accounting and reporting systems to incorporate environmental and ecological considerations faces a number of practical considerations. List and rank four of these...
-
(Fill in the blanks) 1. The FASB publishes its Accounting Standards Codification (ASC) as the source of accounting and reporting guidance for _______ hospitals. 2. FASB standards _______ (lways,...
-
Implement the database in Oracle SQLPlus on arion.murdoch.edu.au (20 marks) All tables should be created as per your ERD; the marker will check your ERD against your tables. All integrity constraints...
-
What is a balanced scorecard? What is its primary objective?
-
If Starbucks has $15.4 million of common equity, $5.6 million of preferred stock, and $10.7 million of debt, what is their weight of debt?
-
How does regulation shape the strategic choices which companies and organisations face in regulated industries or regulated fields of work? To support your argument, compare cases of companies or...
-
What types of people are not able to provide consent for an organization to collect their personal information? Which personality trait do the lecture notes suggest is a predictor for effective pair...
-
what ways does the multifaceted nature of resilience, encompassing psychological, social, and ecological dimensions, intersect with complex adaptive systems theory, and how can this understanding...
-
Sterling purchased a 2 0 year annuity. Sterling paid $ 7 5 0 0 0 in 1 year, and each year for the next 2 0 years sterling will recieve $ 1 0 0 0 0 . How much of of each annuity payment does sterling...
-
What are the challenges and risks associated with ethical leadership in politically charged environments, and how can leaders navigate these complexities while maintaining a clear commitment to...
-
1. Managers at Splish, Inc. were cautiously optimistic about receiving their bonuses at year-end. Periodic communications from the top noted that the sales team had been exceeding targets throughout...
-
What do you think?
-
Assume that the marginal cost of production is increasing. Can you determine whether the average variable cost is increasing or decreasing? Explain.
-
What is meant by deadweight loss? Why does a price ceiling usually result in a deadweight loss?
-
A vegetable fiber is traded in a competitive world market, and the world price is $9 per pound. Unlimited quantities are available for import into the United States at this price. The U.S. domestic...
-
Your medical terminology instructor listed the following grades for the class out of a 75-point test: 34, 36, 41 , 43, 44,49,50, 55,57, 60,64, 66, 67,67, 67,68,68,69, 70, 73 a. Find the 90th...
-
From the following list of number of discharges each day in September, compute the mean, median, mode, and range. Round the mean and median to one decimal point. University Hospital Number of...
-
Use the following information to compute the ALOS and median LOS and range for Community Nursing Center. The discharge date is June 2, 20XX (a non-leap year). Round the ALOS to one decimal place....

Study smarter with the SolutionInn App