

Chaz Corporation has taxable income in 2021 of $316,000 for purposes of computing the 179 expense...
Fantastic news! We've Found the answer you've been seeking!
Question:
Transcribed Image Text:
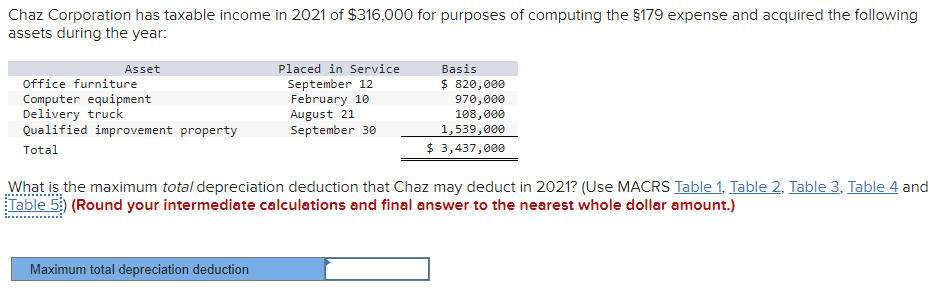
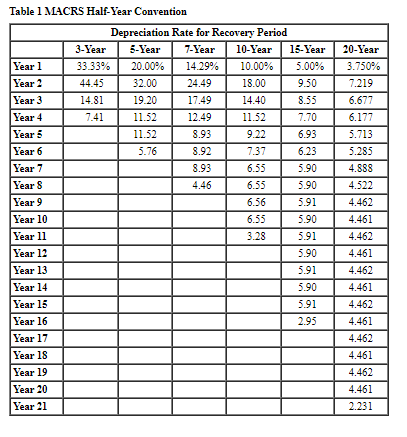
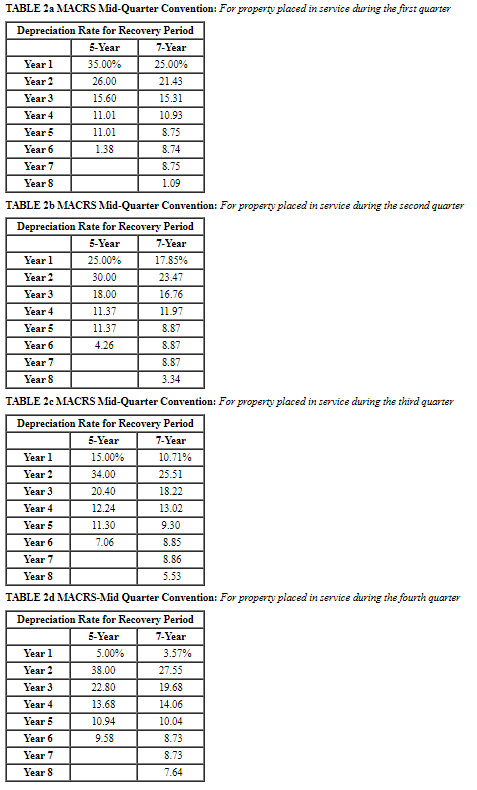
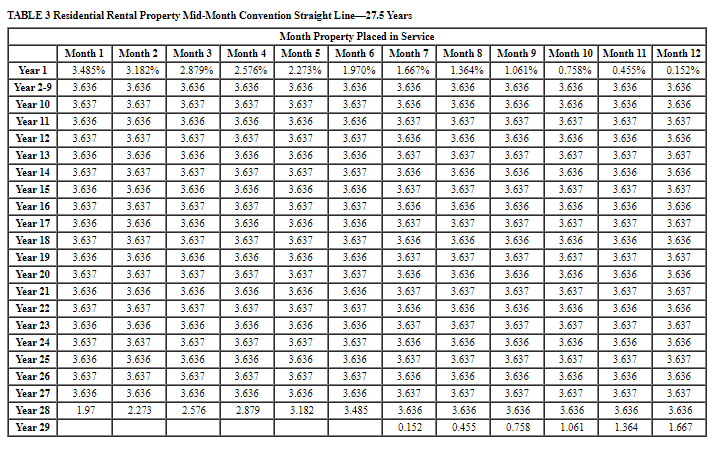
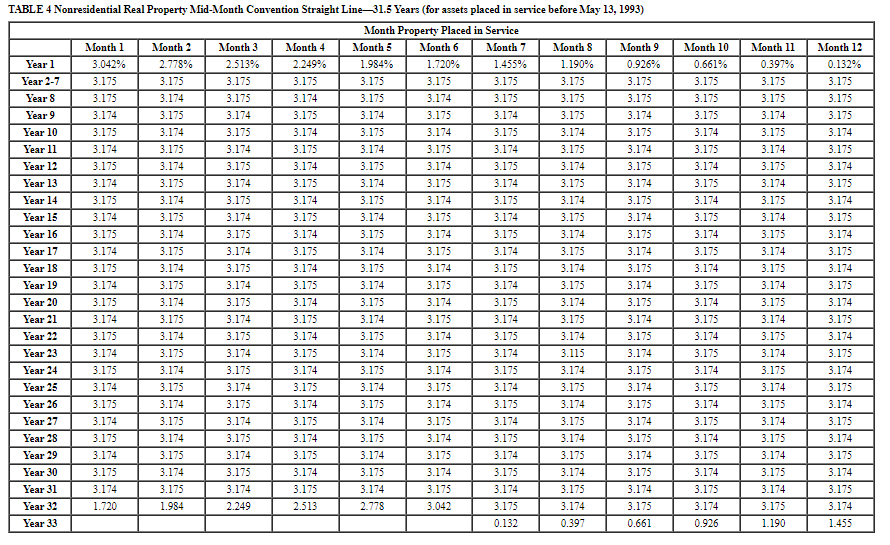
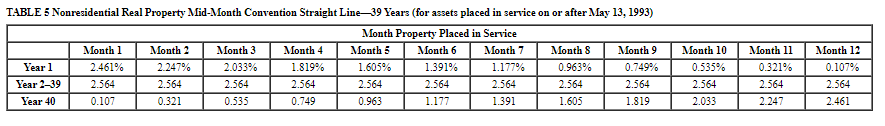
Chaz Corporation has taxable income in 2021 of $316,000 for purposes of computing the §179 expense and acquired the following assets during the year: Asset Office furniture Computer equipment Delivery truck Qualified improvement property Total Placed in Service September 12 February 10 August 21 September 30 Maximum total depreciation deduction Basis $ 820,000 970,000 108,000 1,539,000 $ 3,437,000 What is the maximum total depreciation deduction that Chaz may deduct in 2021? (Use MACRS Table 1, Table 2, Table 3. Table 4 and Table 5) (Round your intermediate calculations and final answer to the nearest whole dollar amount.) Table 1 MACRS Half-Year Convention Year 1 Year 2 Year 3 Year 4 Year 5 Year 6 Year 7 Year 8 Year 9 Year 10 Year 11 Year 12 Year 13 Year 14 Year 15 Year 16 Year 17 Year 18 Year 19 Year 20 Year 21 Depreciation Rate for Recovery Period 3-Year 5-Year 7-Year 10-Year 15-Year 33.33% 20.00% 14.29% 10.00% 5.00% 32.00 24.49 18.00 9.50 19.20 17.49 14.40 8.55 11.52 12.49 11.52 7.70 11.52 8.93 9.22 6.93 5.76 8.92 7.37 6.23 8.93 6.55 5.90 4.46 6.55 5.90 6.56 5.91 6.55 3.28 44.45 14.81 7.41 5.90 5.91 5.90 5.91 5.90 5.91 2.95 20-Year 3.750% 7.219 6.677 6.177 5.713 5.285 4.888 4.522 4.462 4.461 4.462 4.461 4.462 4.461 4.462 4.461 4.462 4.461 4.462 4.461 2.231 TABLE 2a MACRS Mid-Quarter Convention: For property placed in service during the first quarter Depreciation Rate for Recovery Period 5-Year 7-Year 25.00% 21.43 15.31 10.93 8.75 8.74 8.75 1.09 Year 1 Year 2 Year 3 Year 4 Year 5 Year 6 Year 7 Year 8 TABLE 26 MACRS Mid-Quarter Convention: For property placed in service during the second quarter Depreciation Rate for Recovery Period 5-Year 7-Year 25.00% 17.85% 30.00 23.47 18.00 16.76 11.37 11.97 11.37 8.87 4.26 8.87 8.87 3.34 Year 1 Year 2 Year 3 Year 4 Year 5 Year 6 Year 7 Year 8 TABLE 2c MACRS Mid-Quarter Convention: For property placed in service during the third quarter Depreciation Rate for Recovery Period 5-Year 7-Year 15.00% 10.71% 34.00 25.51 20.40 18.22 12.24 13.02 9.30 8.85 8.86 5.53 Year 1 Year 2 Year 3 Year 4 Year 5 Year 6 Year 7 Year 8 35.00% 26.00 15.60 11.01 11.01 1.38 Year 1 Year 2 TABLE 2d MACRS-Mid Quarter Convention: For property placed in service during the fourth quarter Depreciation Rate for Recovery Period 5-Year 7-Year Year 3 Year 4 Year 5 Year 6 Year 7 Year 8 11.30 7.06 5.00% 38.00 22.80 13.68 10.94 9.58 3.57% 27.55 19.68 14.06 10.04 8.73 8.73 7.64 TABLE 3 Residential Rental Property Mid-Month Convention Straight Line-27.5 Years Month Property Placed in Service Month 5 Month 6 Month 7 Month 8 1.667% 1.364% 2.273% 1.970% 3.636 3.636 3.636 3.637 3.637 3.636 3.636 3.636 3.637 3.637 3.636 3.637 3.636 3.637 3.637 3.636 3.636 3.636 3.637 3.637 3.637 3.636 3.636 3.637 3.636 3.637 3.637 3.636 3.636 3.637 3.637 3.636 Year 1 Year 2-9 Year 10 Year 11 Year 12 Year 13 Year 14 Year 15 Year 16 Year 17 Year 18 Year 19 Year 20 Year 21 Year 22 Year 23 Year 24 Year 25 Year 26 Year 27 Year 28 Year 29 Month 1 Month 2 Month 3 3.485% 3.182% 3.636 3.636 3.637 3.637 3.636 3.636 3.637 3.637 3.636 3.636 3.637 3.637 3.636 3.636 3.637 3.637 3.636 3.636 3.637 3.637 3.636 3.636 3.637 3.636 3.637 3.636 3.637 3.636 3.637 3.636 3.637 3.636 3.637 3.636 1.97 3.637 3.636 3.637 3.636 2.273 2.879% 3.636 3.637 3.636 3.637 3.636 3.637 3.636 3.637 3.636 3.637 3.636 3.637 3.636 Month 4 2.576% 3.636 3.637 3.636 3.637 3.636 3.637 3.636 3.637 3.636 2.576 3.637 3.636 3.637 3.636 3.636 3.637 3.637 3.636 3.636 3.637 3.636 3.637 3.636 3.637 3.636 3.182 3.637 3.637 3.636 3.636 3.637 3.637 3.636 3.636 3.637 3.636 2.879 3.637 3.636 3.637 3.636 3.637 3.637 3.636 3.485 3.636 3.637 3.636 3.637 3.636 3.636 3.637 3.636 3.637 3.636 0.152 Month 9 Month 10 Month 11 Month 12 1.061% 0.455% 3.636 3.636 3.636 3.636 3.636 3.636 3.637 3.637 3.636 3.636 3.637 3.637 3.636 3.636 3.637 3.636 3.637 3.637 3.636 3.636 3.636 3.637 3.637 3.637 3.636 3.636 3.636 3.637 3.637 3.637 3.636 3.636 3.636 3.637 3.637 3.637 3.636 3.636 3.636 3.637 3.637 3.637 3.636 3.636 3.636 3.637 3.637 3.637 3.636 3.636 3.636 3.637 3.637 3.637 3.636 3.636 0.455 1.061 0.758% 3.636 3.636 3.637 3.636 3.637 3.636 0.758 3.637 3.636 3.637 3.636 3.637 3.636 3.637 3.636 3.637 3.636 3.637 3.636 3.637 3.636 3.637 3.636 3.637 3.636 1.364 0.152% 3.636 3.636 3.637 3.636 3.637 3.636 3.637 3.636 3.637 3.636 3.637 3.636 3.637 3.636 3.637 3.636 3.637 3.636 3.637 3.636 1.667 TABLE 4 Nonresidential Real Property Mid-Month Convention Straight Line-31.5 Years (for assets placed in service before May 13, 1993) Month Property Placed in Service Month 5 Month 6 Month 7 1.984% 3.175 3.175 3.174 3.175 3.174 Year 1 Year 2-7 Year 8 Year 9 Year 10 Year 11 Year 12 Year 13 Year 14 Year 15 Year 16 Year 17 Year 18 Year 19 Year 20 Year 21 Year 22 Year 23 Year 24 Year 25 Year 26 Year 27 Year 28 Year 29 Year 30 Year 31 Year 32 Year 33 Month 1 3.042% 3.175 3.175 3.174 3.175 3.174 3.175 3.174 3.175 3.174 3.175 3.174 3.175 3.174 3.175 3.174 3.175 3.174 3.175 3.174 3.175 3.174 3.175 3.174 3.175 3.174 1.720 Month 2 2.778% 3.175 3.174 3.175 3.174 3.175 3.174 3.175 3.174 3.175 3.174 3.175 3.174 3.175 3.174 3.175 3.174 3.175 3.174 3.175 3.174 3.175 3.174 3.175 3.174 3.175 1.984 Month 3 2.513% 3.175 3.175 3.174 3.175 3.174 3.175 3.174 3.175 3.174 3.175 3.174 3.175 3.174 3.175 3.174 3.175 3.174 3.175 3.174 3.175 3.174 3.175 3.174 3.175 3.174 2.249 Month 4 2.249% 3.175 3.174 3.175 3.174 3.175 3.174 3.175 3.174 3.175 3.174 3.175 3.174 3.175 3.174 3.175 3.174 3.175 3.174 3.175 3.174 3.175 3.174 3.175 3.174 3.175 2.513 3.175 3.174 3.175 3.174 3.175 3.174 3.175 3.174 3.175 3.174 3.175 3.174 3.175 3.174 3.175 3.174 3.175 3.174 3.175 3.174 2.778 1.720% 3.175 3.174 3.175 3.174 3.175 3.174 3.175 3.174 3.175 3.174 3.175 3.174 3.175 3.174 3.175 3.174 3.175 3.174 3.175 3.174 3.175 3.174 3.175 3.174 3.175 3.042 1.455% 3.175 3.175 3.174 3.175 3.174 3.175 3.174 3.175 3.174 3.175 3.174 3.175 3.174 3.175 3.174 3.175 3.174 3.175 3.174 3.175 3.174 3.175 3.174 3.175 3.174 3.175 0.132 Month 8 1.190% 3.175 3.175 3.175 3.174 3.175 3.174 3.175 3.174 3.175 3.174 3.175 3.174 3.175 3.174 3.175 3.174 3.115 3.174 3.175 3.174 3.175 3.174 3.175 3.174 3.175 3.174 0.397 Month 9 0.926% 3.175 3.175 3.174 3.175 3.174 3.175 3.174 3.175 3.174 3.175 3.174 3.175 3.174 3.175 3.174 3.175 3.174 3.175 3.174 3.175 3.174 3.175 3.174 3.175 3.174 3.175 0.661 Month 10 0.661% 3.175 3.175 3.175 3.174 3.175 3.174 3.175 3.174 3.175 3.174 3.175 3.174 3.175 3.174 3.175 3.174 3.175 3.174 3.175 3.174 3.175 3.174 3.175 3.174 3.175 3.174 0.926 Month 11 0.397% 3.175 3.175 3.174 3.175 3.174 3.175 3.174 3.175 3.174 3.175 3.174 3.175 3.174 3.175 3.174 3.175 3.174 3.175 3.174 3.175 3.174 3.175 3.174 3.175 3.174 3.175 1.190 Month 12 0.132% 3.175 3.175 3.175 3.174 3.175 3.174 3.175 3.174 3.175 3.174 3.175 3.174 3.175 3.174 3.175 3.174 3.175 3.174 3.175 3.174 3.175 3.174 3.175 3.174 3.175 3.174 1.455 TABLE 5 Nonresidential Real Property Mid-Month Convention Straight Line 39 Years (for assets placed in service on or after May 13, 1993) Month Property Placed in Service Month 6 Month 7 Month 5 1.605% 2.564 0.963 Year 1 Year 2-39 Year 40 Month 1 2.461% 2.564 0.107 Month 2 2.247% 2.564 0.321 Month 3 2.033% 2.564 0.535 Month 4 1.819% 2.564 0.749 1.391% 2.564 1.177 1.177% 2.564 1.391 Month 8 0.963% 2.564 1.605 Month 9 0.749% 2.564 1.819 Month 10 0.535% 2.564 2.033 Month 11 0.321% 2.564 2.247 Month 12 0.107% 2.564 2.461 Chaz Corporation has taxable income in 2021 of $316,000 for purposes of computing the §179 expense and acquired the following assets during the year: Asset Office furniture Computer equipment Delivery truck Qualified improvement property Total Placed in Service September 12 February 10 August 21 September 30 Maximum total depreciation deduction Basis $ 820,000 970,000 108,000 1,539,000 $ 3,437,000 What is the maximum total depreciation deduction that Chaz may deduct in 2021? (Use MACRS Table 1, Table 2, Table 3. Table 4 and Table 5) (Round your intermediate calculations and final answer to the nearest whole dollar amount.) Table 1 MACRS Half-Year Convention Year 1 Year 2 Year 3 Year 4 Year 5 Year 6 Year 7 Year 8 Year 9 Year 10 Year 11 Year 12 Year 13 Year 14 Year 15 Year 16 Year 17 Year 18 Year 19 Year 20 Year 21 Depreciation Rate for Recovery Period 3-Year 5-Year 7-Year 10-Year 15-Year 33.33% 20.00% 14.29% 10.00% 5.00% 32.00 24.49 18.00 9.50 19.20 17.49 14.40 8.55 11.52 12.49 11.52 7.70 11.52 8.93 9.22 6.93 5.76 8.92 7.37 6.23 8.93 6.55 5.90 4.46 6.55 5.90 6.56 5.91 6.55 3.28 44.45 14.81 7.41 5.90 5.91 5.90 5.91 5.90 5.91 2.95 20-Year 3.750% 7.219 6.677 6.177 5.713 5.285 4.888 4.522 4.462 4.461 4.462 4.461 4.462 4.461 4.462 4.461 4.462 4.461 4.462 4.461 2.231 TABLE 2a MACRS Mid-Quarter Convention: For property placed in service during the first quarter Depreciation Rate for Recovery Period 5-Year 7-Year 25.00% 21.43 15.31 10.93 8.75 8.74 8.75 1.09 Year 1 Year 2 Year 3 Year 4 Year 5 Year 6 Year 7 Year 8 TABLE 26 MACRS Mid-Quarter Convention: For property placed in service during the second quarter Depreciation Rate for Recovery Period 5-Year 7-Year 25.00% 17.85% 30.00 23.47 18.00 16.76 11.37 11.97 11.37 8.87 4.26 8.87 8.87 3.34 Year 1 Year 2 Year 3 Year 4 Year 5 Year 6 Year 7 Year 8 TABLE 2c MACRS Mid-Quarter Convention: For property placed in service during the third quarter Depreciation Rate for Recovery Period 5-Year 7-Year 15.00% 10.71% 34.00 25.51 20.40 18.22 12.24 13.02 9.30 8.85 8.86 5.53 Year 1 Year 2 Year 3 Year 4 Year 5 Year 6 Year 7 Year 8 35.00% 26.00 15.60 11.01 11.01 1.38 Year 1 Year 2 TABLE 2d MACRS-Mid Quarter Convention: For property placed in service during the fourth quarter Depreciation Rate for Recovery Period 5-Year 7-Year Year 3 Year 4 Year 5 Year 6 Year 7 Year 8 11.30 7.06 5.00% 38.00 22.80 13.68 10.94 9.58 3.57% 27.55 19.68 14.06 10.04 8.73 8.73 7.64 TABLE 3 Residential Rental Property Mid-Month Convention Straight Line-27.5 Years Month Property Placed in Service Month 5 Month 6 Month 7 Month 8 1.667% 1.364% 2.273% 1.970% 3.636 3.636 3.636 3.637 3.637 3.636 3.636 3.636 3.637 3.637 3.636 3.637 3.636 3.637 3.637 3.636 3.636 3.636 3.637 3.637 3.637 3.636 3.636 3.637 3.636 3.637 3.637 3.636 3.636 3.637 3.637 3.636 Year 1 Year 2-9 Year 10 Year 11 Year 12 Year 13 Year 14 Year 15 Year 16 Year 17 Year 18 Year 19 Year 20 Year 21 Year 22 Year 23 Year 24 Year 25 Year 26 Year 27 Year 28 Year 29 Month 1 Month 2 Month 3 3.485% 3.182% 3.636 3.636 3.637 3.637 3.636 3.636 3.637 3.637 3.636 3.636 3.637 3.637 3.636 3.636 3.637 3.637 3.636 3.636 3.637 3.637 3.636 3.636 3.637 3.636 3.637 3.636 3.637 3.636 3.637 3.636 3.637 3.636 3.637 3.636 1.97 3.637 3.636 3.637 3.636 2.273 2.879% 3.636 3.637 3.636 3.637 3.636 3.637 3.636 3.637 3.636 3.637 3.636 3.637 3.636 Month 4 2.576% 3.636 3.637 3.636 3.637 3.636 3.637 3.636 3.637 3.636 2.576 3.637 3.636 3.637 3.636 3.636 3.637 3.637 3.636 3.636 3.637 3.636 3.637 3.636 3.637 3.636 3.182 3.637 3.637 3.636 3.636 3.637 3.637 3.636 3.636 3.637 3.636 2.879 3.637 3.636 3.637 3.636 3.637 3.637 3.636 3.485 3.636 3.637 3.636 3.637 3.636 3.636 3.637 3.636 3.637 3.636 0.152 Month 9 Month 10 Month 11 Month 12 1.061% 0.455% 3.636 3.636 3.636 3.636 3.636 3.636 3.637 3.637 3.636 3.636 3.637 3.637 3.636 3.636 3.637 3.636 3.637 3.637 3.636 3.636 3.636 3.637 3.637 3.637 3.636 3.636 3.636 3.637 3.637 3.637 3.636 3.636 3.636 3.637 3.637 3.637 3.636 3.636 3.636 3.637 3.637 3.637 3.636 3.636 3.636 3.637 3.637 3.637 3.636 3.636 3.636 3.637 3.637 3.637 3.636 3.636 0.455 1.061 0.758% 3.636 3.636 3.637 3.636 3.637 3.636 0.758 3.637 3.636 3.637 3.636 3.637 3.636 3.637 3.636 3.637 3.636 3.637 3.636 3.637 3.636 3.637 3.636 3.637 3.636 1.364 0.152% 3.636 3.636 3.637 3.636 3.637 3.636 3.637 3.636 3.637 3.636 3.637 3.636 3.637 3.636 3.637 3.636 3.637 3.636 3.637 3.636 1.667 TABLE 4 Nonresidential Real Property Mid-Month Convention Straight Line-31.5 Years (for assets placed in service before May 13, 1993) Month Property Placed in Service Month 5 Month 6 Month 7 1.984% 3.175 3.175 3.174 3.175 3.174 Year 1 Year 2-7 Year 8 Year 9 Year 10 Year 11 Year 12 Year 13 Year 14 Year 15 Year 16 Year 17 Year 18 Year 19 Year 20 Year 21 Year 22 Year 23 Year 24 Year 25 Year 26 Year 27 Year 28 Year 29 Year 30 Year 31 Year 32 Year 33 Month 1 3.042% 3.175 3.175 3.174 3.175 3.174 3.175 3.174 3.175 3.174 3.175 3.174 3.175 3.174 3.175 3.174 3.175 3.174 3.175 3.174 3.175 3.174 3.175 3.174 3.175 3.174 1.720 Month 2 2.778% 3.175 3.174 3.175 3.174 3.175 3.174 3.175 3.174 3.175 3.174 3.175 3.174 3.175 3.174 3.175 3.174 3.175 3.174 3.175 3.174 3.175 3.174 3.175 3.174 3.175 1.984 Month 3 2.513% 3.175 3.175 3.174 3.175 3.174 3.175 3.174 3.175 3.174 3.175 3.174 3.175 3.174 3.175 3.174 3.175 3.174 3.175 3.174 3.175 3.174 3.175 3.174 3.175 3.174 2.249 Month 4 2.249% 3.175 3.174 3.175 3.174 3.175 3.174 3.175 3.174 3.175 3.174 3.175 3.174 3.175 3.174 3.175 3.174 3.175 3.174 3.175 3.174 3.175 3.174 3.175 3.174 3.175 2.513 3.175 3.174 3.175 3.174 3.175 3.174 3.175 3.174 3.175 3.174 3.175 3.174 3.175 3.174 3.175 3.174 3.175 3.174 3.175 3.174 2.778 1.720% 3.175 3.174 3.175 3.174 3.175 3.174 3.175 3.174 3.175 3.174 3.175 3.174 3.175 3.174 3.175 3.174 3.175 3.174 3.175 3.174 3.175 3.174 3.175 3.174 3.175 3.042 1.455% 3.175 3.175 3.174 3.175 3.174 3.175 3.174 3.175 3.174 3.175 3.174 3.175 3.174 3.175 3.174 3.175 3.174 3.175 3.174 3.175 3.174 3.175 3.174 3.175 3.174 3.175 0.132 Month 8 1.190% 3.175 3.175 3.175 3.174 3.175 3.174 3.175 3.174 3.175 3.174 3.175 3.174 3.175 3.174 3.175 3.174 3.115 3.174 3.175 3.174 3.175 3.174 3.175 3.174 3.175 3.174 0.397 Month 9 0.926% 3.175 3.175 3.174 3.175 3.174 3.175 3.174 3.175 3.174 3.175 3.174 3.175 3.174 3.175 3.174 3.175 3.174 3.175 3.174 3.175 3.174 3.175 3.174 3.175 3.174 3.175 0.661 Month 10 0.661% 3.175 3.175 3.175 3.174 3.175 3.174 3.175 3.174 3.175 3.174 3.175 3.174 3.175 3.174 3.175 3.174 3.175 3.174 3.175 3.174 3.175 3.174 3.175 3.174 3.175 3.174 0.926 Month 11 0.397% 3.175 3.175 3.174 3.175 3.174 3.175 3.174 3.175 3.174 3.175 3.174 3.175 3.174 3.175 3.174 3.175 3.174 3.175 3.174 3.175 3.174 3.175 3.174 3.175 3.174 3.175 1.190 Month 12 0.132% 3.175 3.175 3.175 3.174 3.175 3.174 3.175 3.174 3.175 3.174 3.175 3.174 3.175 3.174 3.175 3.174 3.175 3.174 3.175 3.174 3.175 3.174 3.175 3.174 3.175 3.174 1.455 TABLE 5 Nonresidential Real Property Mid-Month Convention Straight Line 39 Years (for assets placed in service on or after May 13, 1993) Month Property Placed in Service Month 6 Month 7 Month 5 1.605% 2.564 0.963 Year 1 Year 2-39 Year 40 Month 1 2.461% 2.564 0.107 Month 2 2.247% 2.564 0.321 Month 3 2.033% 2.564 0.535 Month 4 1.819% 2.564 0.749 1.391% 2.564 1.177 1.177% 2.564 1.391 Month 8 0.963% 2.564 1.605 Month 9 0.749% 2.564 1.819 Month 10 0.535% 2.564 2.033 Month 11 0.321% 2.564 2.247 Month 12 0.107% 2.564 2.461
Expert Answer:
Answer rating: 100% (QA)
Solution Step 1 Determine the MACRS class and recovery period for each asset Asset MACRS class Recov... View the full answer

Related Book For 

Essentials Of Federal Taxation 2019
ISBN: 9781260190045
10th Edition
Authors: Brian Spilker, Benjamin Ayers, John Robinson, Edmund Outslay, Ronald Worsham, John Barrick, Connie Weaver
Posted Date:
Students also viewed these accounting questions
-
List the stages for carrying out survey.
-
Chaz Corporation has taxable income in 2015 of $312,000 before the §179 expense and acquired the following assets during the year: What is the maximum total depreciation expense that Chaz may...
-
Chaz Corporation has taxable income in 2022 of $312,000 for purposes of computing the 179 expense and acquired the following assets during the year: What is the maximum total depreciation deduction...
-
A partial statement of financial position of Century University is shown below. During the fiscal year ended June 30, 2011, the following transactions occurred: 1. A gift of $100,000 was received...
-
Waiting times, relevant revenues, and relevant costs (continuation of 19-31). SRG is still deciding whether it should introduce Y28. The following table provides information on selling prices,...
-
Writing in 2023, Olivier Blanchard of the Peterson Institute for International Economics noted that secular stagnation, a concept put forward by the economist Alvin Hansen in 1938, refers to...
-
Suppose you are starting a business, T-Shirts Plus, Inc., to imprint logos on T-shirts. In organizing the business and setting up its accounting records, you take your information to a CPA to prepare...
-
1. Does Clark have any sources of power and any contingencies of power? If so, list and discuss them. 2. To what degree were Clarks methods of influencing board members the most effective possible...
-
Question Five The net profit after tax for AB Limited for the year ended 31/12/2023 was K125 000 and the company and 1000 000 ordinary shares of K1 each. On 1/5/2023 the company issued 200 000...
-
Prepare a simple tax provision and the journal entries to calculate the current and the deferred tax provision (benefit) using the following data: a. ABC, Inc. reported pre-tax book income of...
-
Solve 2 (76 +8)
-
Have you ever participated in or witnessed a group presentation in which one or two members did not complete their portion of the work? What was that experience like? What steps may group members...
-
2.) Jack places an amount of $ 60 in an account at the end of each year for 12 consecutive years beginning one year from today. If the interest rate is 3 %, how much will Jack have at the end of the...
-
Carbon dioxide from the air dissolves in water, forming small amounts of carbonic acid, H 2 CO 3 , and causes the water to be slightly acidic. Would this tend to make the titration of NaOH and HCL...
-
A band signs a deal in which it receives $26,000/year in perpetuity. If the average inflation rate into the indefinite future is 4.3%, calculate the real total of this income stream. Round your...
-
Q3. Apply DeMorgan's theorems to the following expression: ABC + DE
-
Starbucks and Gillette have two different Marketing Campaigns. Using the table 9.1, describe each of the variables for the target market of either Gillette or Starbucks. How does the brand of your...
-
Determine the values of the given trigonometric functions directly on a calculator. The angles are approximate. tan 0.8035
-
Whether a business expense is reasonable in amount is often a difficult question. Explain why determining reasonableness is difficult, and describe a circumstance where reasonableness is likely to be...
-
In 2018, Carson is claimed as a dependent on his parents tax return. Carsons parents provided most of his support. What is Carsons tax liability for the year in each of the following alternative...
-
Felipe, a single taxpayer, is a technology consultant, who operates as a sole proprietorship. Felipes net business income is $600,000, he pays wages of $100,000 to his employees, and he has $200,000...
-
Consider observations \(\left(Y_{i t}, X_{i t} ight)\) from the linear panel data model \[ Y_{i t}=X_{i t} \beta_{1}+\alpha_{i}+\lambda_{i} t+u_{i t} \] where \(t=1, \ldots, T ; i=1, \ldots, n ;\)...
-
In a study of the effect on earnings of education using panel data on annual earnings for a large number of workers, a researcher regresses earnings in a given year on age, education, union status,...
-
Suppose a linear probability model yields a predicted value of \(Y\) that is equal to 1.3. Explain why this is nonsensical.

Study smarter with the SolutionInn App