

Consider the following four data sets in the table below. Complete parts (a) through (g) below....
Fantastic news! We've Found the answer you've been seeking!
Question:
Transcribed Image Text:
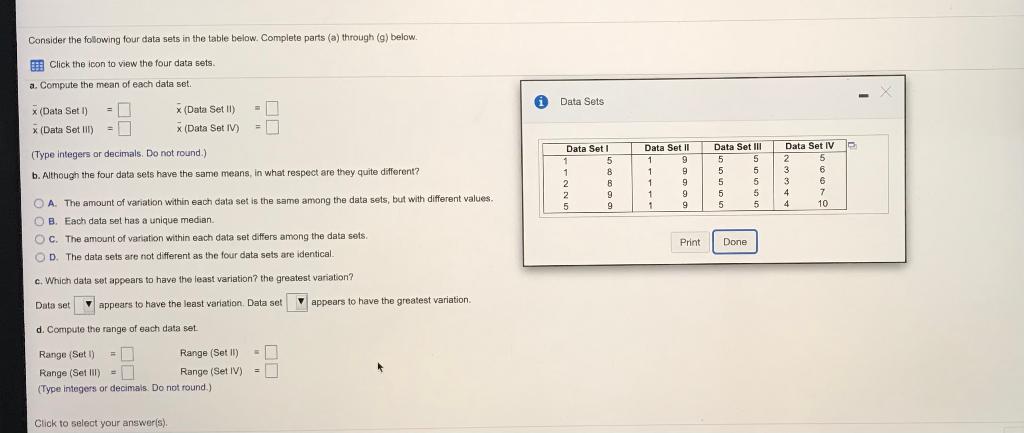
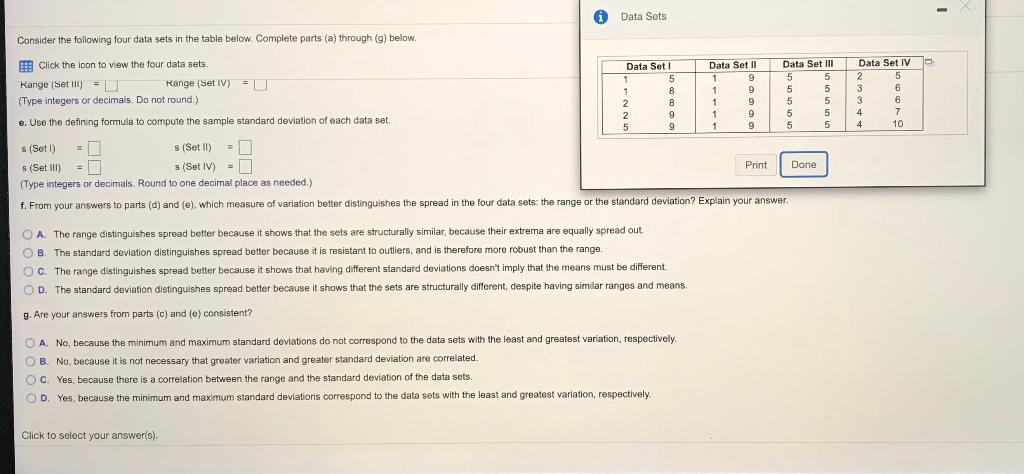
Consider the following four data sets in the table below. Complete parts (a) through (g) below. Click the icon to view the four data sets. a. Compute the mean of each data set. x (Data Set I) x (Data Set III) = Data set x (Data Set II) X (Data Set IV) x (Type integers or decimals. Do not round.) b. Although the four data sets have the same means, in what respect are they quite different? OA. The amount of variation within each data set is the same among the data sets, but with different values. OB. Each data set has a unique median. OC. The amount of variation within each data set differs among the data sets. OD. The data sets are not different as the four data sets are identical. c. Which data set appears to have the least variation? the greatest variation? = 1 = 0 appears to have the least variation. Data set d. Compute the range of each data set Range (Set I) = 7 Range (Set III) = (Type integers or decimals. Do not round.). Click to select your answer(s). Range (Set II) Range (Set IV) -1 = appears to have the greatest variation. Data Sets Data Set I 1 1 2 2 5 5 8 8 9 9 Data Set II 9 1 1 1 4 1 1 9 9 9 9 Print Data Set III 5 5 5 5 5 5 5 5 5 5 Done Data Set IV 5 6 6 7 10 2 3 3 4 4 Consider the following four data sets in the table below. Complete parts (a) through (g) below. Click the icon to view the four data sets. Kange (Set III) = (Type integers or decimals. Do not round.) e. Use the defining formula to compute the sample standard deviation of each data set. Range (Set IV) =П Data Sets Click to select your answer(s). Data Set I 5 8 1 1 2 2 5 8 9 9 A. The range distinguishes spread better because it shows that the sets are structurally similar, because their extrema are equally spread out. OB. The standard deviation distinguishes spread better because it is resistant to outliers, and is therefore more robust than the range. OC. The range distinguishes spread better because it shows that having different standard deviations doesn't imply that the means must be different. OD. The standard deviation distinguishes spread better because it shows that the sets are structurally different, despite having similar ranges and means. g. Are your answers from parts (c) and (e) consistent? A. No, because the minimum and maximum standard deviations do not correspond to the data sets with the least and greatest variation, respectively. OB. No, because it is not necessary that greater variation and greater standard deviation are correlated. OC. Yes, because there is a correlation between the range and the standard deviation of the data sets. OD, Yes, because the minimum and maximum standard deviations correspond to the data sets with the least and greatest variation, respectively. Data Set II 1 1 1 1 1 1 9 9 s (Set I) s (Set II) s (Set III) =7 s (Set IV) = (Type integers or decimals. Round to one decimal place as needed.) f. From your answers to parts (d) and (e), which measure of variation better distinguishes the spread in the four data sets: the range or the standard deviation? Explain your answer. 9 9 9 Data Set III 5 5 5 5 5 5 5 5 5 5 Print Done Data Set IV 2 5 3 6 3 6 4 7 4 10 Consider the following four data sets in the table below. Complete parts (a) through (g) below. Click the icon to view the four data sets. a. Compute the mean of each data set. x (Data Set I) x (Data Set III) = Data set x (Data Set II) X (Data Set IV) x (Type integers or decimals. Do not round.) b. Although the four data sets have the same means, in what respect are they quite different? OA. The amount of variation within each data set is the same among the data sets, but with different values. OB. Each data set has a unique median. OC. The amount of variation within each data set differs among the data sets. OD. The data sets are not different as the four data sets are identical. c. Which data set appears to have the least variation? the greatest variation? = 1 = 0 appears to have the least variation. Data set d. Compute the range of each data set Range (Set I) = 7 Range (Set III) = (Type integers or decimals. Do not round.). Click to select your answer(s). Range (Set II) Range (Set IV) -1 = appears to have the greatest variation. Data Sets Data Set I 1 1 2 2 5 5 8 8 9 9 Data Set II 9 1 1 1 4 1 1 9 9 9 9 Print Data Set III 5 5 5 5 5 5 5 5 5 5 Done Data Set IV 5 6 6 7 10 2 3 3 4 4 Consider the following four data sets in the table below. Complete parts (a) through (g) below. Click the icon to view the four data sets. Kange (Set III) = (Type integers or decimals. Do not round.) e. Use the defining formula to compute the sample standard deviation of each data set. Range (Set IV) =П Data Sets Click to select your answer(s). Data Set I 5 8 1 1 2 2 5 8 9 9 A. The range distinguishes spread better because it shows that the sets are structurally similar, because their extrema are equally spread out. OB. The standard deviation distinguishes spread better because it is resistant to outliers, and is therefore more robust than the range. OC. The range distinguishes spread better because it shows that having different standard deviations doesn't imply that the means must be different. OD. The standard deviation distinguishes spread better because it shows that the sets are structurally different, despite having similar ranges and means. g. Are your answers from parts (c) and (e) consistent? A. No, because the minimum and maximum standard deviations do not correspond to the data sets with the least and greatest variation, respectively. OB. No, because it is not necessary that greater variation and greater standard deviation are correlated. OC. Yes, because there is a correlation between the range and the standard deviation of the data sets. OD, Yes, because the minimum and maximum standard deviations correspond to the data sets with the least and greatest variation, respectively. Data Set II 1 1 1 1 1 1 9 9 s (Set I) s (Set II) s (Set III) =7 s (Set IV) = (Type integers or decimals. Round to one decimal place as needed.) f. From your answers to parts (d) and (e), which measure of variation better distinguishes the spread in the four data sets: the range or the standard deviation? Explain your answer. 9 9 9 Data Set III 5 5 5 5 5 5 5 5 5 5 Print Done Data Set IV 2 5 3 6 3 6 4 7 4 10
Expert Answer:

Related Book For 

Posted Date:
Students also viewed these accounting questions
-
Consider the following four data sets. a. Compute the mean of each data set. b. Although the four data sets have the same means, in what respect are they quite different? c. Which data set appears to...
-
Consider the following four force vectors: F150.0 new tons, due east F210.0 new tons, due east F340.0 new tons, due east F430.0 new tons, due east Which two vectors add together to give a resultant...
-
Consider the following four populations: 1, 2, 3, 4, 5, 6, 7, 8 1, 1, 1, 1, 8, 8, 8, 8 1, 1, 4, 4, 5, 5, 8, 8, -6, -3, 0, 3, 6, 9, 12, 15 All these populations have the same mean. Without doing...
-
A particle of mass m moves in a certain plane P due to a force F whose magnitude is constant and whose vector rotates in that plane with a constant angular velocity . Assuming the particle to be...
-
Restrictions on residential development make housing suppliers less responsive to changes in demand. As a result, the housing market is more prone to cycles of rising and falling prices. In a market...
-
Imagine that we have a transmitter of microwaves that radiates a linearly polarized wave whose vector E-field is known to be parallel to the dipole direction. We wish to reflect as much energy as...
-
Implementation plays a critical part in environmental management.Why might environmental management fail at the implementation stage? Can these reasons for failure be corrected or avoided?
-
1. What function or functions does Mei Lis attitude toward the advertisements that line the street where she lives play? 2. Using the psychoanalytic approach to motivation, how does Mei Li deal with...
-
Jack submitted his 2 0 2 1 / 2 2 tax return on 1 December 2 0 2 2 . He deliberately omitted to include a new source of income - rental income - of 1 5 , 0 0 0 as he did not think that HMRC would find...
-
Quack Concepts produces its patented drug Metafour (a duck extract used as an antioxidant) in both Hong Kong and the United States. The effective marginal tax rate is 35 percent in the United States...
-
vil219vinu 916 Page 2 of 21 # 192 ms Problem Set #1 neni to alsinsabu 00 DA Problem #1: GAAP Financial Statements (8 points) CED CIT qed ad v Presented below are eight items that describe information...
-
2. (10 points) Implement exercise 7-1 in Chapter 7 (To help you find it, a part of the exercise is shown below). You do not need to do the "like more practice?" part. Images used should be different...
-
Figure 2 shows a water trough which is uniform with length y cm and has a cross-section made up of a semi-circle of radius x cm. The trough has no top. The volume of the trough is 64000 cm. a) Find...
-
An inductor (L = 350 mH), a capacitor (C = 4.43 F), and a resistor (R = 560 2) are connected in series. A 50.0-Hz AC source produces a peak current of 250 mA in the circuit. (a) Calculate the...
-
lim z->0 of (cos(z))^(1/z^2) the answers say it is e^-1/2 but i cannot work out how to get there i am pretty sure you need to use l-hopitals rule
-
According to the table: Minutes Needed to Make 1 Hamburger Turkey Sandwich JP 6 8 Molly 3 5 Refer to Table. What is Molly's opportunity cost of 1 hamburger?
-
Thefuture value of a single deposit of $1,000 will be greater whenthis amount is compounded:(A) Annually(B) Semi-annually(C) Quarterly(D) MonthlySolve with excel 0 answers
-
Express these numbers in standard notation. a. 2.87 10-8 b. 1.78 1011 c. 1.381 10-23
-
Which of the following numbers could not possibly be probabilities? Justify your answer. a. 0.462 b. 0.201 c. 1 d. 56 e. 3.5 f. 0
-
Determine and sketch the area under the standard normal curve that lies a. To the left of 3.02 b. To the right of 0.61 c. Between 1.11 and 2.75 d. Between 2.06 and 5.02 e. Between 4.11 and 1.5. f....
-
The coefficient of determination of a set of data points is 0.716. a. Can you determine the linear correlation coefficient? If yes, obtain it. If no, why not? b. Can you determine whether the slope...
-
Consider the regression model with a single regressor: \(Y_{i}=\beta_{0}+\beta_{1} X_{i}+u_{i}\). Suppose the least squares assumptions in Key Concept 4.3 are satisfied. a. Show that \(X_{i}\) is a...
-
In their study of the effectiveness of cardiac catheterization, McClellan, McNeil, and Newhouse (1994) used as an instrument the difference in distances to cardiac catheterization and regular...
-
In his study of the effect of incarceration on crime rates, suppose Levitt had used the number of lawyers per capita as an instrument. Would this instrument be relevant? Would it be exogenous? Would...

Study smarter with the SolutionInn App