

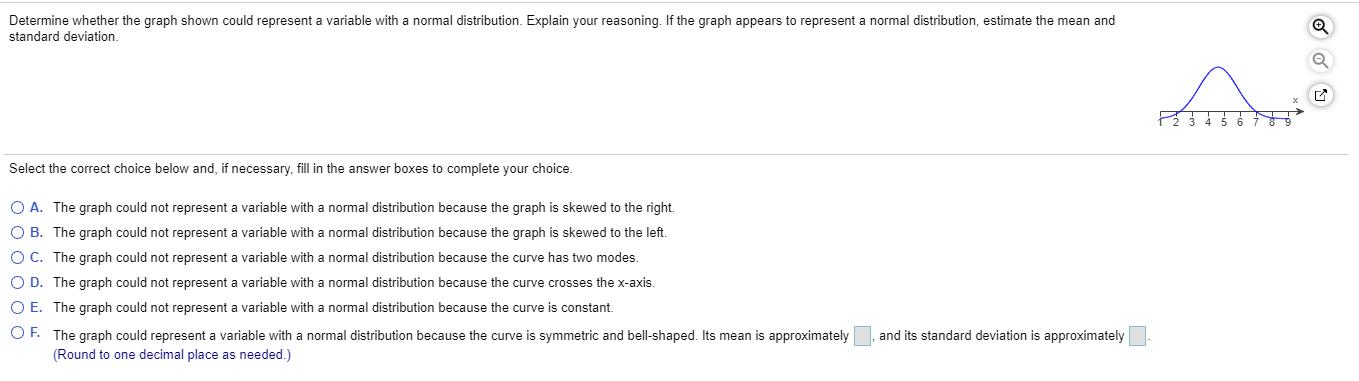
Determine whether the graph shown could represent a variable with a normal distribution. Explain your reasoning....
Fantastic news! We've Found the answer you've been seeking!
Question:
Expert Answer:

Related Book For 

Discrete Mathematics and Its Applications
ISBN: 978-0073383095
7th edition
Authors: Kenneth H. Rosen
Posted Date:
