

During the 1980s, oil prices were low; in fact, prices reached an all-time low of $12/barrel in
Question:
During the 1980s, oil prices were low; in fact, prices reached an all-time low of $12/barrel in 19981. Many companies in the industry focused on cost reduction efforts to achieve profits. This case reports efforts by Shell Gabon (SG), a wholly owned subsidiary of Royal Dutch Shell (RDS), a major Dutch oil company, to control its costs in order to obtain necessary funding for capital expenditures for new oil exploration.
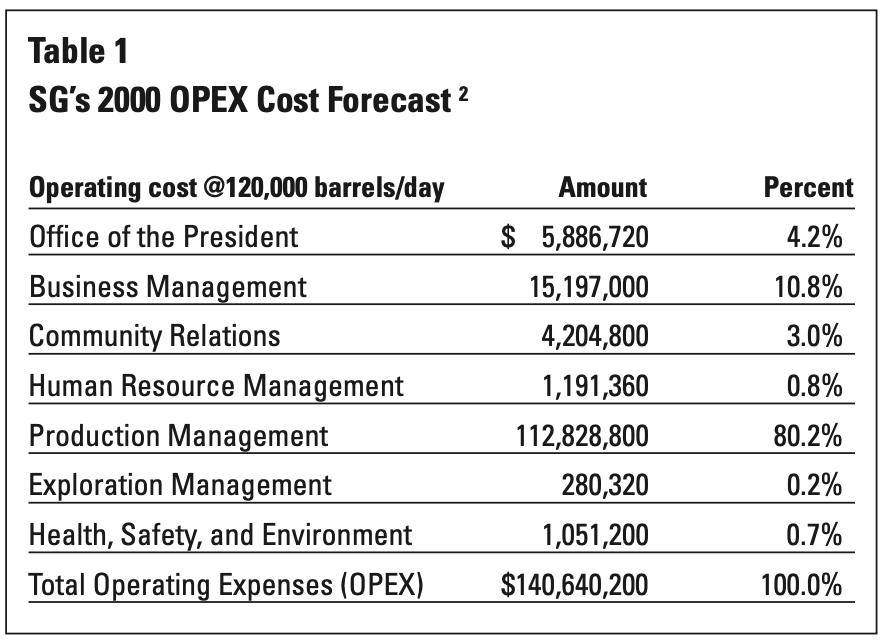
From 1965 until 1995, SG experienced high growth and profitability. By 1996, most of the oil on land in its region was depleted, and the number of barrels produced had decreased without a corresponding reduction in operating costs. Accordingly, the unit operating cost (UOC) increased. Table 1 provides SG’s budget by department for 2000 operating costs (OPEX) associated with the production of 120,000 barrels per day.
ShEll’S coST ManagEMEnT PrograM
Concerned by industry reports that warned that companies in the upstream segment of the crude oil industry should structure their business to be able to operate expecting the real3 price of oil to be below $16.71 per barrel at least half of the time, RDS decided to become world-class in managing its costs. RDS didn’t have prior experience with cost management. Prior attempts at cost reduction within RDS had been mostly “balloon squeezing” exercises where cost reductions by one department or business unit simply increased expenditures for another department or business unit or resulted in cost decreases one year followed by increases in subsequent years.
Accordingly, the first support department that CLT decided to study was Business Management, since its costs were 10.8% of total costs, and managers viewed this department’s costs as excessive. The team decided to apply activity-based management (ABM) to the Business Management Department.
Sg’S coST ProBlEM
RDS views its oil exploration and production units as
cost centers, responsible for the unit-operating cost per barrel (UOC). UOC is the total operating cost (OPEX), excluding exploration, depreciation and depletion,4 divided by the barrels produced. Since its units have a great deal
SG’s prior experience with cost reduction had trained managers to scrutinize every bill submitted prior to approving payment. Managers were taught to question the reason for each expenditure. Not only did this approach fail to reduce expenses substantially, it also created a situation where everyone in the organization tried to defend his or her department against cost reductions while attacking other departments’ expenses. This lead to distrust and unfounded inferences about the causes of SG’s cost problems. The current reporting system compounded the problem, because reports generated costs by departments rather than by the kind of work being performed or the value created (refer to Table 1.)
CLT decided that to manage costs, they needed to determine the work actually performed and the cost of
that work. They could then benchmark to find out if the costs were excessive. Because SG was an exploration and production subsidiary, managers questioned the value of amounts spent that were not directly for exploration or production management. Accordingly, the first support department that CLT decided to study was Business Management, since its costs were 10.8% of total costs, and managers viewed this department’s costs as excessive. The team decided to apply activity-based management (ABM) to the Business Management Department.
acTIvITy-BaSEd Management (aBM)
ABM is a cost-management tool that focuses on the specific work activities performed, how the work is done, what each activity costs, and whether the activity is “value-added” or “nonvalue-added.”5 There are ten specific steps that the CLT team undertook in their ABM study of the Business Management Department:
STEPS In acTIvITy-BaSEd analysis
1. Obtain the existing cost information and reports on the focal department.
2. Determine the major processes that occur within the department.
3. Identify the inputs that start each process and the outputs or results the process produces.
4. Determine the activities involved in the various processes. Document the current activity flow in detail and all tasks that are part of each activity.
5. Identify all resources used (people, machinery, supplies, space, and so on) by each activity.
6. Define an output measure for each major activity. This measure may be financial or non-financial.
7. Define a performance measure for each major activity. These measures may be financial or non-financial.
8. Record the actual performance on the selected performance measures. The measures may be quality, cost, or time.
9. Use the actual performance data in Step 8 to determine how well you are performing the activity.
10. Brainstorm improvement ideas.
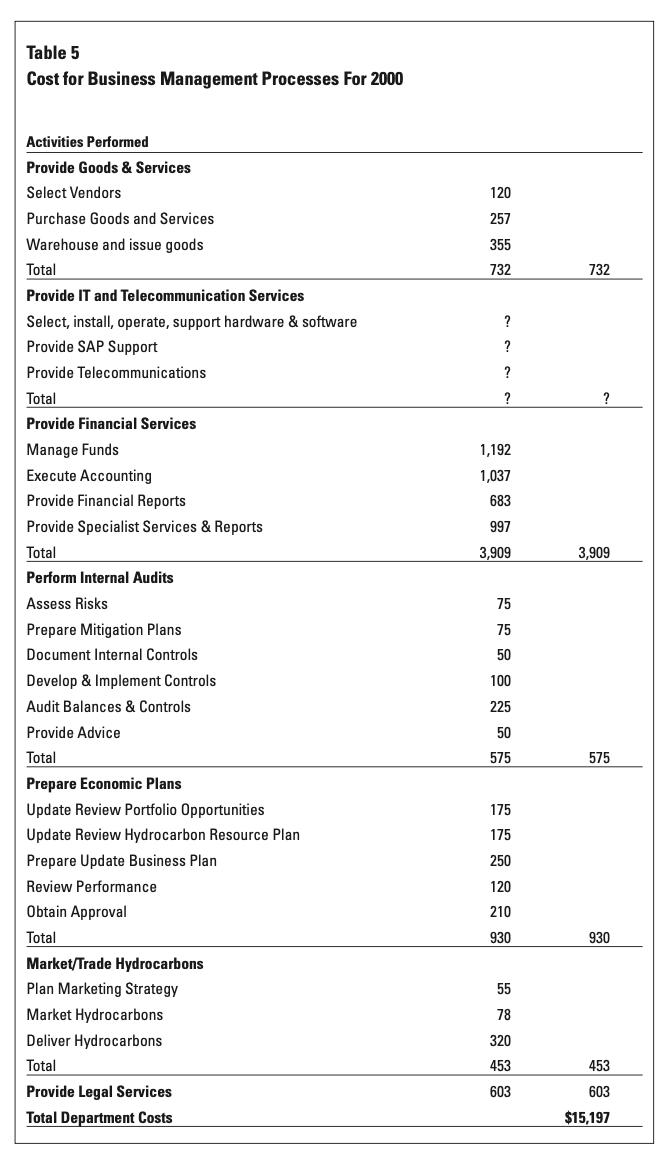
Table 1 contains the total of all costs currently charged to the department. Steps 2 through 4 require documentation of all processes and activities in the department. RDS had previously developed a “corporate process model” that contained standard definitions of processes and activities. Using the corporate process model, CLT discovered that
the Business Management Department actually housed
a number of diverse processes, each containing multiple activities. These included:
Provide Goods and Services.
This process included the activities of selecting vendors, purchasing goods and services (contracting, purchasing, and arranging delivery), and performing warehousing functions for all materials and supplies used.
Provide IT and Telecommunications Services.
This process included activities of selecting, installing, operating, maintaining, and supporting all hardware, software, and communications within SG, as well as supporting the local SAP interface. The SAP8 system’s installation and cost were borne by RDS, the parent, not SG.
Provide Financial Services. This process included activities such as managing funds (maintaining bank balances, including short-term financing and investing), executing the accounting for the SAP input, preparing financial reports, and providing special reports as needed to support managers.
Perform Internal Audits. This process contained the activities of assessing risks, preparing risk mitigation plans, documenting internal controls, developing and implementing new controls, auditing selected balances and controls, and providing advice to managers about accounting for new transactions to improve accuracy of financial reports.
Prepare Economic Plans. This process included activities such as updating portfolio opportunities, updating the hydrocarbon resource plan, updating the business plan, reviewing performance, and obtaining approval for changes.
Market/Trade Hydrocarbons. This process included activities such as developing a marketing strategy, marketing hydrocarbons, and arranging delivery and warehousing.
Provide Legal Services. This process included handling in-country legal problems, reviewing all contracts, and consulting with corporate on exposure.
The CLT team next developed the cost of performing each activity and process within the Business Management Department (Step 5) using the following approach:
a. Obtain a cost report that shows the resources consumed
by the Business Management Department.
b. Charge each sub-process or activity for any of those
resources that can be directly traced to it.
c. For each resource that is shared among activities or
processes, select a “resource driver.”
STEP 5a: IdEnTIFy rESourcES conSuMEd By ThE BuSInESS ManagEMEnT dEParTMEnT.
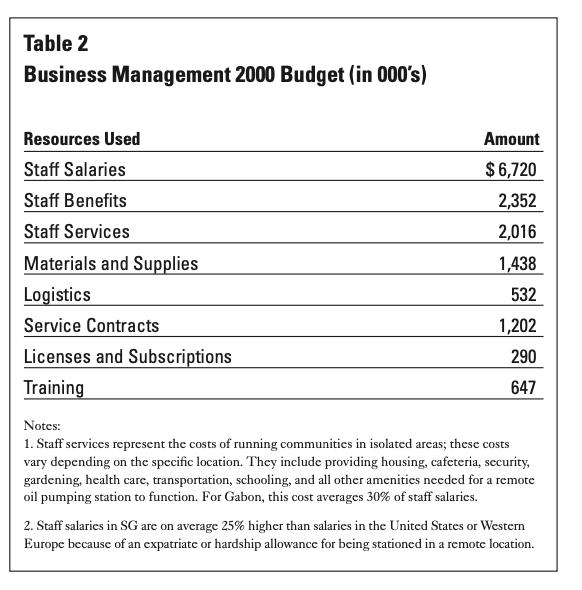
Shell Gabon uses an SAP system as part of its Enterprise Resource Planning (ERP) process. The system is also
used for “time writing,” since the company must maintain detailed records under its joint venture agreements. Consequently, information about resources consumed by Business Management in 1999 was readily available and was used to develop the 2000 budget data shown in Table 2.
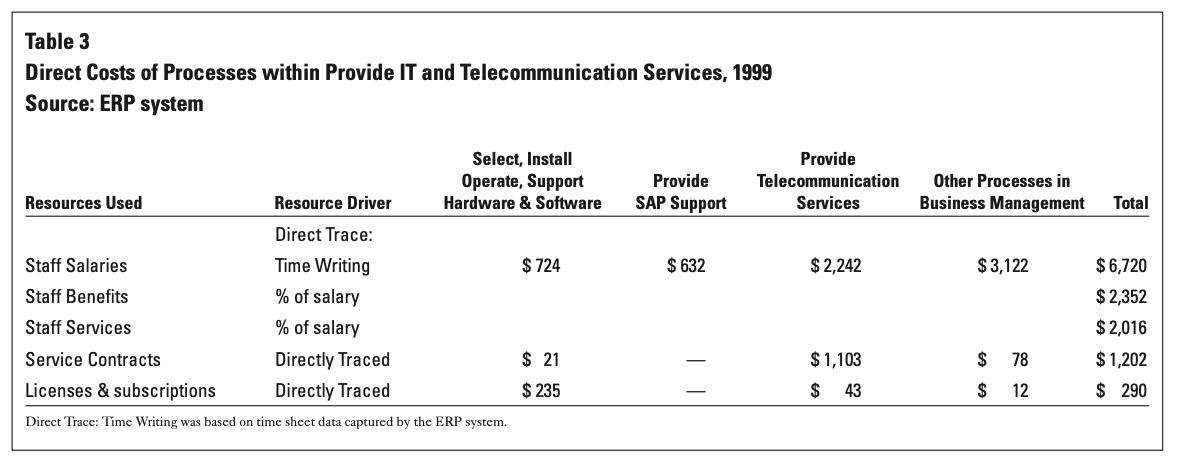
STEP 5B: chargE Each acTIvITy For ITS dIrEcT uSE oF rESourcES.
To charge activities for their use of resources, each cost item must be either charged directly to an activity or allocated to it. Costs directly traced to an activity do not require allocation. Using the ERP system, staff time is directly traced to activities within the department. Additionally, since staff benefits and staff services average 35% and 30% of staff salaries respectively, these items can be directly assigned to each activity. Service contracts and licenses and subscriptions are also directly traced to the activity by the ERP system. Table 3 provides the 1999 ERP analysis of directly traceable items in the process, Provide IT and Telecommunication Services. This usage data is assumed to be relevant for 2000 as well.
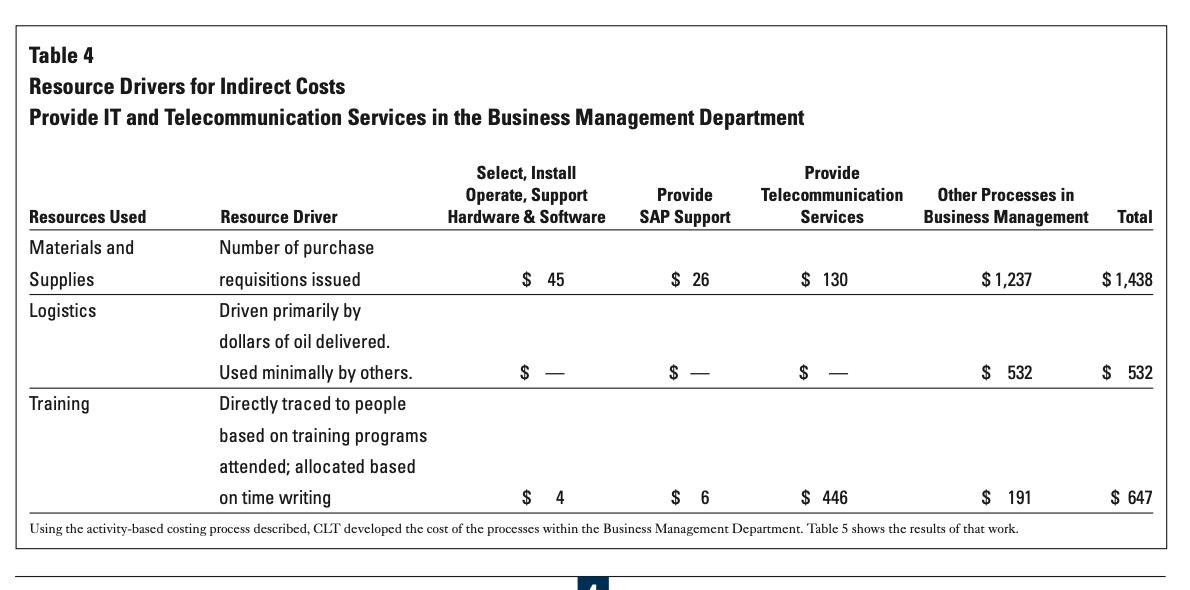
STEP 5c: For Each rESourcE ThaT IS SharEd aMong acTIvITIES or ProcESSES, SElEcT a “rESourcE drIvEr.”
To allocate shared resources, it is necessary to identify a resource driver. A resource driver is the factor that causes a resource to be consumed by activities. Resource drivers, like any allocation base, must be chosen carefully or they can cause great controversy in the organization. After careful deliberation the team identified resource drivers and performed the allocations as shown in Table 4.
Questions:
Calculate the UOC per barrel for SG. Is a barrel of oil the cost driver for all the activities that go on within RDS? Comment on why RDS chooses to monitor costs per barrel.
Discuss the concept of "cost driver", how do you think the consultants mentioned in case were able to use this concept in addressing the problem of Shell Gabon?
The current situation worldwide is that the price of oil is at all time highs whereas the case discusses the opposite scenario, however since oil prices are at high level this affects almost all types of businesses. One way for businesses to lessen their dependence on oil consumption is to shift to using renewable energy, however how would you justify such a strategy using cost concepts? Share details on how you would explain such concepts to management who may not be familiar with cost concepts.
Expert Answer:
Here are the detailed answers to the questions 1 Calculate the UOC per barrel for SG Is a barrel of oil the cost driver for all the activities that go on within RDS Comment on why RDS chooses to monit... View the full answer


Managing Business Ethics Making Ethical Decisions
ISBN: 9781506388595
1st Edition
Authors: Alfred A. Marcus, Timothy J. Hargrave
