

Dynamic AS-AD model. The current recession caused by the COVID-19 pandemic has reduced demand for Australian...
Fantastic news! We've Found the answer you've been seeking!
Question:
Transcribed Image Text:
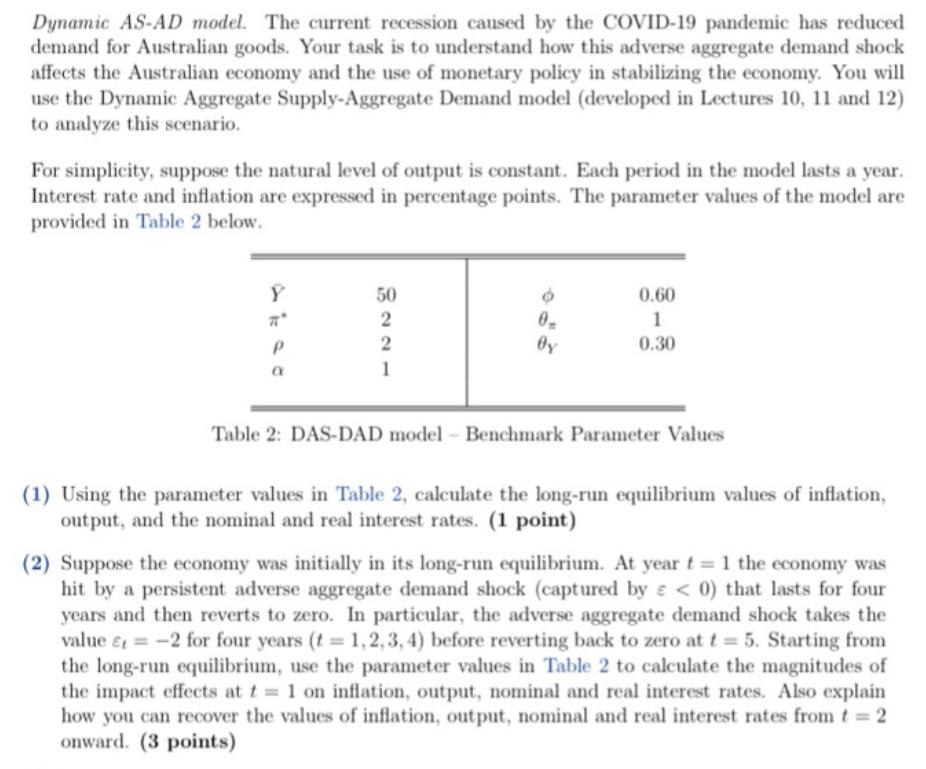
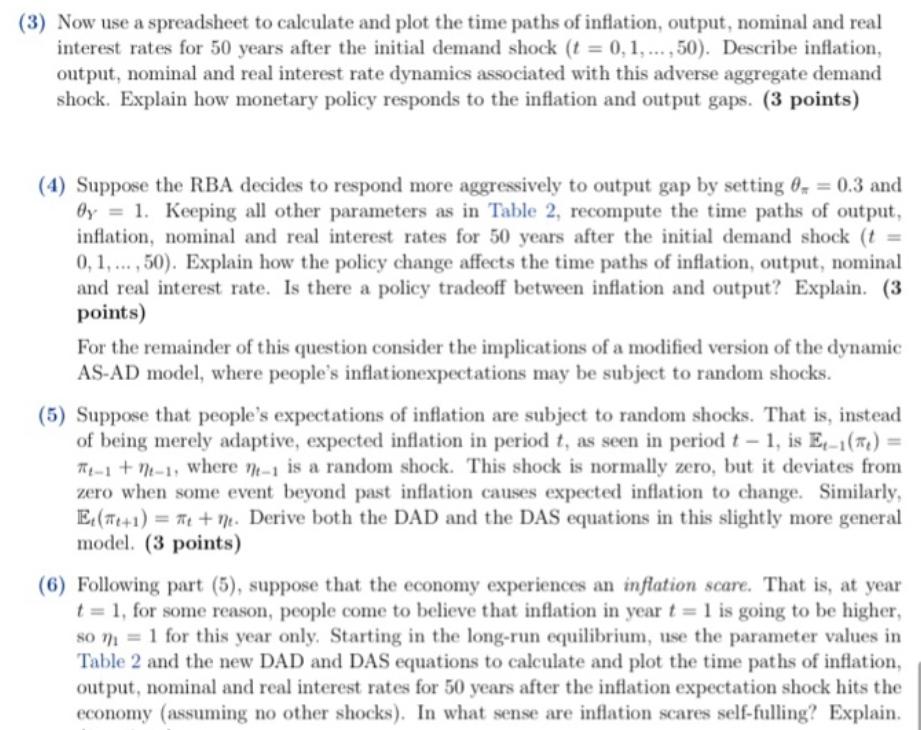
Dynamic AS-AD model. The current recession caused by the COVID-19 pandemic has reduced demand for Australian goods. Your task is to understand how this adverse aggregate demand shock affects the Australian economy and the use of monetary policy in stabilizing the economy. You will use the Dynamic Aggregate Supply-Aggregate Demand model (developed in Lectures 10, 11 and 12) to analyze this scenario. For simplicity, suppose the natural level of output is constant. Each period in the model lasts a year. Interest rate and inflation are expressed in percentage points. The parameter values of the model are provided in Table 2 below. 50 0.60 1 Oy 0.30 1 a Table 2: DAS-DAD model Benchmark Parameter Values (1) Using the parameter values in Table 2, calculate the long-run equilibrium values of inflation, output, and the nominal and real interest rates. (1 point) (2) Suppose the economy was initially in its long-run equilibrium. At year t 1 the economy was hit by a persistent adverse aggregate demand shock (captured by e < 0) that lasts for four years and then reverts to zero. In particular, the adverse aggregate demand shock takes the value e = -2 for four years (t= 1,2,3, 4) before reverting back to zero at t = 5. Starting from the long-run equilibrium, use the parameter values in Table 2 to calculate the magnitudes of the impact effects at t 1 on inflation, output, nominal and real interest rates. Also explain how you can recover the values of inflation, output, nominal and real interest rates from t = 2 onward. (3 points) (3) Now use a spreadsheet to calculate and plot the time paths of inflation, output, nominal and real interest rates for 50 years after the initial demand shock (t = 0, 1, ... , 50). Describe inflation, output, nominal and real interest rate dynamics associated with this adverse aggregate demand shock. Explain how monetary policy responds to the inflation and output gaps. (3 points) (4) Suppose the RBA decides to respond more aggressively to output gap by setting 0, 0.3 and Oy = 1. Keeping all other parameters as in Table 2, recompute the time paths of output, inflation, nominal and real interest rates for 50 years after the initial demand shock (t = 0, 1,.. , 50). Explain how the policy change affects the time paths of inflation, output, nominal and real interest rate. Is there a policy tradeoff between inflation and output? Explain. (3 points) For the remainder of this question consider the implications of a modified version of the dynamic AS-AD model, where people's inflationexpectations may be subject to random shocks. (5) Suppose that people's expectations of inflation are subject to random shocks. That is, instead of being merely adaptive, expected inflation in period t, as seen in period t- 1, is E,-1(7) = 7-1 + M-1, where m-1 is a random shock. This shock is normally zero, but it deviates from zero when some event beyond past inflation causes expected inflation to change. Similarly, E (Tt+1) = 7 + Nt. Derive both the DAD and the DAS equations in this slightly more general model. (3 points) (6) Following part (5), suppose that the economy experiences an inflation scare. That is, at year t = 1, for some reason, people come to believe that inflation in year t = 1 is going to be higher, so n 1 for this year only. Starting in the long-run equilibrium, use the parameter values in Table 2 and the new DAD and DAS equations to calculate and plot the time paths of inflation, output, nominal and real interest rates for 50 years after the inflation expectation shock hits the economy (assuming no other shocks). In what sense are inflation scares self-fulling? Explain. Dynamic AS-AD model. The current recession caused by the COVID-19 pandemic has reduced demand for Australian goods. Your task is to understand how this adverse aggregate demand shock affects the Australian economy and the use of monetary policy in stabilizing the economy. You will use the Dynamic Aggregate Supply-Aggregate Demand model (developed in Lectures 10, 11 and 12) to analyze this scenario. For simplicity, suppose the natural level of output is constant. Each period in the model lasts a year. Interest rate and inflation are expressed in percentage points. The parameter values of the model are provided in Table 2 below. 50 0.60 1 Oy 0.30 1 a Table 2: DAS-DAD model Benchmark Parameter Values (1) Using the parameter values in Table 2, calculate the long-run equilibrium values of inflation, output, and the nominal and real interest rates. (1 point) (2) Suppose the economy was initially in its long-run equilibrium. At year t 1 the economy was hit by a persistent adverse aggregate demand shock (captured by e < 0) that lasts for four years and then reverts to zero. In particular, the adverse aggregate demand shock takes the value e = -2 for four years (t= 1,2,3, 4) before reverting back to zero at t = 5. Starting from the long-run equilibrium, use the parameter values in Table 2 to calculate the magnitudes of the impact effects at t 1 on inflation, output, nominal and real interest rates. Also explain how you can recover the values of inflation, output, nominal and real interest rates from t = 2 onward. (3 points) (3) Now use a spreadsheet to calculate and plot the time paths of inflation, output, nominal and real interest rates for 50 years after the initial demand shock (t = 0, 1, ... , 50). Describe inflation, output, nominal and real interest rate dynamics associated with this adverse aggregate demand shock. Explain how monetary policy responds to the inflation and output gaps. (3 points) (4) Suppose the RBA decides to respond more aggressively to output gap by setting 0, 0.3 and Oy = 1. Keeping all other parameters as in Table 2, recompute the time paths of output, inflation, nominal and real interest rates for 50 years after the initial demand shock (t = 0, 1,.. , 50). Explain how the policy change affects the time paths of inflation, output, nominal and real interest rate. Is there a policy tradeoff between inflation and output? Explain. (3 points) For the remainder of this question consider the implications of a modified version of the dynamic AS-AD model, where people's inflationexpectations may be subject to random shocks. (5) Suppose that people's expectations of inflation are subject to random shocks. That is, instead of being merely adaptive, expected inflation in period t, as seen in period t- 1, is E,-1(7) = 7-1 + M-1, where m-1 is a random shock. This shock is normally zero, but it deviates from zero when some event beyond past inflation causes expected inflation to change. Similarly, E (Tt+1) = 7 + Nt. Derive both the DAD and the DAS equations in this slightly more general model. (3 points) (6) Following part (5), suppose that the economy experiences an inflation scare. That is, at year t = 1, for some reason, people come to believe that inflation in year t = 1 is going to be higher, so n 1 for this year only. Starting in the long-run equilibrium, use the parameter values in Table 2 and the new DAD and DAS equations to calculate and plot the time paths of inflation, output, nominal and real interest rates for 50 years after the inflation expectation shock hits the economy (assuming no other shocks). In what sense are inflation scares self-fulling? Explain.
Expert Answer:
Answer rating: 100% (QA)
1 Equilibrium mves u frm E t E 2 Infltin rte inreses frm 0 t 2 But utut level dereses frm Y 0 t Y 2 Thus inrese in exeted rte f infltin e r dverse suly shk uses higher infltin nd lwer utut level knwn ... View the full answer

Related Book For 

Social Statistics for a Diverse Society
ISBN: 978-1483333540
7th edition
Authors: Chava Frankfort-Nachmias, Anna Leon-Guerrero
Posted Date:
Students also viewed these economics questions
-
Your task is to calculate the annual deposits that your 25-year-old friend would need to make to achieve the following: She would like to draw 65% of his final years salary level at the beginning of...
-
From the following data, calculate National Income by Income method and Expenditure method: Item Rs. in crores 700 (i) Compensation of employees (ii) Government final consumption expenditure750 (iii)...
-
Your task is to prepare isopropyl methyl ether by one of the following reactions. Which reaction would give the better yield? Explain your answer. (1) Isopropyl methyl ether Or (2) Isopropyl methyl...
-
Determine the breakeven point for each plant. Hambry Enterprises produces a component for recycling uranium used as a nuclear fuel in power plant generators in France and the United States. Use the...
-
Water is flowing 2 m deep in a rectangular channel that is 2.5 m wide. The average velocity is 5.8 m/s and C = 100. What is the slope of the channel? (Use Chezy's formula.)
-
The following statement from a finance and accounting expert is true. The valuation criterion that best and most reliably reflects the value of the company's shares is the one based on the net worth...
-
What is the role of cooling towers in surface condenser ?
-
1. Data on the amount of the customers' shopping by using an account card and whether they decided to upgrade their account from silver status to platinum status after receiving the upgrade offer is...
-
Discuss the challenges and opportunities in simulating transient and dynamic behavior in process simulation, including the modeling of startup, shutdown, and transient disturbances. How do dynamic...
-
Consider a system of particles uniformly distributed in space, with a constant particle number density n 0 , and characterized by a velocity distribution function f(v) such that where K 0 is a...
-
15. A medieval prince trapped in a castle, in a valley, wraps a message around a rock and throws it from the top of the castle wall with an initial velocity of 40.0 m/s [30 above the horizontal]. The...
-
Using the information in this chapter, label each of the following statements true, false, or uncertain. Explain briefly. a. The saving rate is always equal to the investment rate. b. A higher...
-
Convergence between Japan and the United States since 1960 The Bureau of Labor Statistics has a user-friendly Web site of GDP per capita at...
-
RED and growth a. Why is the amount of R\&D spending important for growth? How do the appropriability and fertility of research affect the amount of R\&D spending? How do each of the policy proposals...
-
The following table shows data on asthma-related visits. Is there evidence that these visits vary by quarter? Can you detect a trend? A powerful test would be to run a multiple regression in Excel....
-
Using the information in this chapter, label each of the following statements true, false, or uncertain. Explain briefly. a. The present discounted value of a stream of returns can be calculated in...
-
With two other colleagues, carry out a TQM exercise on the process of revising for your examinations. Consider all the options, how the quality of the revision could be improved and how it could be...
-
Find the APR in each of the following cases: NUMBER OF TIMES COMPOUNDED Semiannually Monthly Weekly Infinite EAR APR 10.4% 8.9 11.6 15.4
-
SAT scores are normed so that, in any year, the mean of the verbal or math test should be 500 and the standard deviation 100. Assuming this is true (it is only approximately true, both because of...
-
Construct potential hypotheses or research questions to relate the variables in each of the following examples. Also, write a brief statement explaining why you believe there is a relationship...
-
Nan Sook Park and her colleagues (2012) investigated racial/ethnic differences in predictors of self-rating health and the use of sociocultural resources. Their data is based on the Survey of Older...
-
What are the different methods of conducting marketing research?
-
What is the main difference between a full-service and a limited-service supplier?
-
What are some of the issues that should be considered when conducting marketing research?

Study smarter with the SolutionInn App