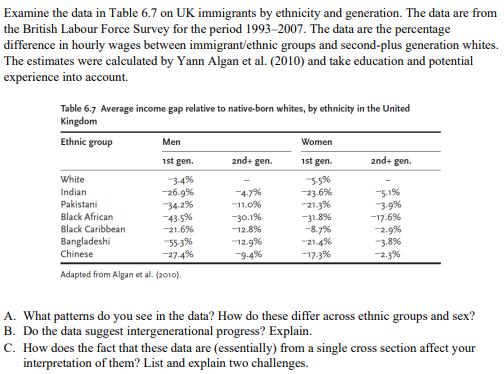
Examine the data in Table 6.7 on UK immigrants by ethnicity and generation. The data are...
Fantastic news! We've Found the answer you've been seeking!
Question:
Transcribed Image Text:
Examine the data in Table 6.7 on UK immigrants by ethnicity and generation. The data are from the British Labour Force Survey for the period 1993-2007. The data are the percentage difference in hourly wages between immigrant/ethnic groups and second-plus generation whites. The estimates were calculated by Yann Algan et al. (2010) and take education and potential experience into account. Table 6.7 Average income gap relative to native-born whites, by ethnicity in the United Kingdom Ethnic group Men Women 1st gen. and+ gen. 1st gen. and+ gen. White "34% 26.9% 55% 23.6% "21.3% 31.8% -8.7% -21.4% -17.3% Indian 4-7% 11.0% 30.1% "12.8% "12.9% 9-4% S1% 3-9% -17.6% 2.9% 3.8% -2.3% Pakistani Black African 34-2% 43-5% 21.6% Black Caribbean Bangladeshi Chinese 55-3% -274% Adapted from Algan et al. (2010). A. What patterns do you see in the data? How do these differ across ethnic groups and sex? B. Do the data suggest intergenerational progress? Explain. C. How does the fact that these data are (essentially) from a single cross section affect your interpretation of them? List and explain two challenges. Examine the data in Table 6.7 on UK immigrants by ethnicity and generation. The data are from the British Labour Force Survey for the period 1993-2007. The data are the percentage difference in hourly wages between immigrant/ethnic groups and second-plus generation whites. The estimates were calculated by Yann Algan et al. (2010) and take education and potential experience into account. Table 6.7 Average income gap relative to native-born whites, by ethnicity in the United Kingdom Ethnic group Men Women 1st gen. and+ gen. 1st gen. and+ gen. White "34% 26.9% 55% 23.6% "21.3% 31.8% -8.7% -21.4% -17.3% Indian 4-7% 11.0% 30.1% "12.8% "12.9% 9-4% S1% 3-9% -17.6% 2.9% 3.8% -2.3% Pakistani Black African 34-2% 43-5% 21.6% Black Caribbean Bangladeshi Chinese 55-3% -274% Adapted from Algan et al. (2010). A. What patterns do you see in the data? How do these differ across ethnic groups and sex? B. Do the data suggest intergenerational progress? Explain. C. How does the fact that these data are (essentially) from a single cross section affect your interpretation of them? List and explain two challenges.
Expert Answer:
Answer rating: 100% (QA)
Step 1 Step 1 Given information In the given table income gap or inequality of income received among whites and ethnicity is given It is also measured ... View the full answer
Related Book For
Introduction to Statistical Quality Control
ISBN: 978-1118146811
7th edition
Authors: Douglas C Montgomery
Posted Date:
Students also viewed these accounting questions
-
The data in Table 1.4.9 give death rates (per 100,000 population) for 10 leading causes in 1998 (source: National Center for Health Statistics, US Department of Health and Human Services). (a)...
-
Take a look at the data in Table 32-1. Would Indian residents gain from trade of Indian apps for U.S. tablets if the rate of exchange of tablet devices for digital apps happened to be 0.75 tablets...
-
The data in Table SE6 (page 649) consist of yield measurements from many runs of a chemical reaction. The quantities varied were the temperature in ?C (x 1 ), the concentration of the primary...
-
Mansfield Congregational Church (MCC) is a small organization in Connecticut with only seventeen employees. Though its funds are dwindling, the MCC wants to hire a full-time maintenance employee to...
-
Who can develop reorganization plans in a Chapter 11 bankruptcy?
-
Demetria Davis, the bookkeeper for Home Interiors and Designs Company, has just finished posting the closing entries for the year to the ledger. She is concerned about the following balances: Capital...
-
Partner A contracted with a vendor to buy a computer for the partnership. Partner A did not discuss the transac- tion with Partner B or get Partner B's approval. Partner B refused to approve payment...
-
Chieftain International, Inc., is an oil and natural gas exploration and production company. A recent balance sheet reported $208 million in assets with only $4.6 million in liabilities, all of which...
-
Now that you've gathered information and analyzed the legal and ethical consequences of Manning's actions as outlined in the Global Shippers, Inc., you're expected to discuss your conclusions and...
-
DeBauge Realtors, Inc., is a realty firm owned by Jeff and Kristi DeBauge. The DeBauge family owns 100% of the corporations stock. The following summarized data (in thousands) are taken from the...
-
Waterway Industries has a product with a selling price per unit of $200, the unit variable cost is $50, and the total monthly fixed costs are $300000. How much is Waterway's contribution margin ratio?
-
What is the total current flowing through the series circuit pictured below? 3 A 4+ RI ww 10 V WWW. R3 6 V WwW.
-
Galaxy Sports Inc. manufactures and sells two styles of All Terrain Vehicles (ATVs), the Conquistador and Hurricane, from a single manufacturing facility. The manufacturing facility operates at 100%...
-
On January 1, a company issued 5%, 15-year bonds with a face amount of $80 million for $59,249,660 to yield 8%. Interest is paid semiannually. What was the interest expense at the effective interest...
-
Tyrone has already typed 100 words for an essay and can type 35 words per minute. Vanessa has already typed 120 words and can type 30 words per minute. In how many minutes will Tyrone and Vanessa...
-
The following information is provided for the first month of operations for Legal Services Inc.: Prepare a T-accounts to reflect the following business transaction: The Company provided legal...
-
Consider a thin film of soap illuminated by visible light with A=0.55 m in vacuum. If the film is treated as a planar dielectric slab with e, = 1.75, surrounded on both sides by air, (a) What film...
-
r = 0.18 Find the coefficients of determination and non-determination and explain the meaning of each.
-
A production line assembles electric clocks. The average number of nonconformities per clock is estimated to be 0.75. The quality engineer wishes to establish a c chart for this operation, using an...
-
A sample of ten items from a normal population had a mean of 300 and standard deviation of 10. Using these data, estimate a value for the random variable such that the probability is 0.95 that 90% of...
-
Ferric chloride is used as a flux in some types of extraction metallurgy processes. This material is shipped in containers, and the container weight varies. It is important to obtain an accurate...
-
Which of the following is inconsistent with monopoly? a. a single seller b. economies of scale c. free entry and exit d. selling in the elastic portion of the demand curve to maximize profits
-
Which of the following is potentially a barrier to entry into a product market? a. patent protection on the design of the product b. economies of scale in the product market c. government licensing...
-
How do we know whether the monopolist is making a profit?
Study smarter with the SolutionInn App