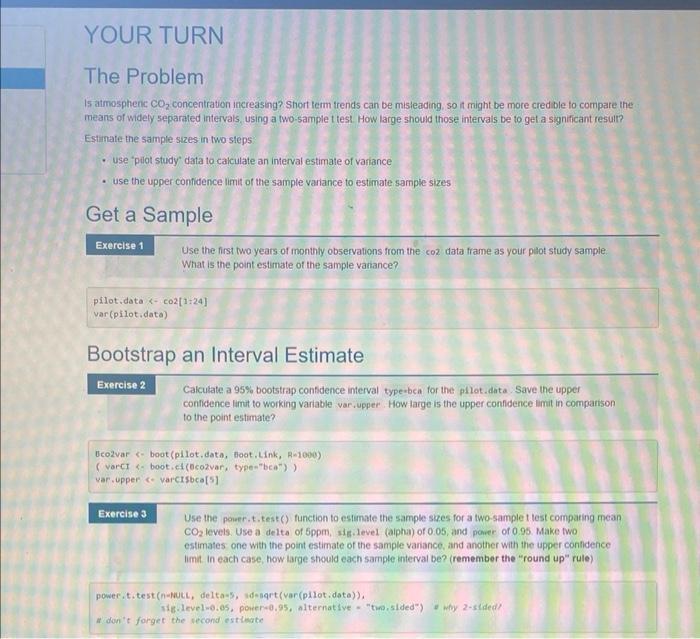
Exercise 3 Use the power.t.test() function to estimate the sample sizes for a two-sample t test...
Fantastic news! We've Found the answer you've been seeking!
Question:
Transcribed Image Text:
Exercise 3 Use the power.t.test() function to estimate the sample sizes for a two-sample t test comparing mean CO₂ levels. Use a delta of 5ppm, sig. level (alpha) of 0.05, and power of 0.95. Make two estimates one with the point estimate of the sample variance, and another with the upper confidence limit. In each case, how large should each sample interval be? (remember the "round up" rule) power. t.test(n-NULL, delta-5, sd-sqrt(var (pilot.data)), sig.level-0.05, power-0.95, alternative "two.sided") #why 2-sided? #don't forget the second estimate Write tho Roport YOUR TURN The Problem Is atmosphenc CO₂ concentration increasing? Short term trends can be misleading, so it might be more credible to compare the means of widely separated intervals, using a two-sample t test. How large should those intervals be to get a significant result? Estimate the sample sizes in two steps • use "pilot study data to calculate an interval estimate of variance • use the upper confidence limit of the sample variance to estimate sample sizes Get a Sample Exercise 1 Use the first two years of monthly observations from the coz data frame as your pilot study sample. What is the point estimate of the sample variance? pilot.data <- co2[1:24] var (pilot.data) Bootstrap an Interval Estimate Exercise 2 Exercise 3 Calculate a 95% bootstrap confidence interval type-bca for the pilot.data. Save the upper confidence limit to working variable var.upper. How large is the upper confidence limit in comparison to the point estimate? Bco2var <boot (pilot.data, Boot.Link, R-1000) (varci <boot.ci(Bcozvar, type="bca")); var.upper <varCISbca[5] Use the power.t.test() function to estimate the sample sizes for a two-sample t test comparing mean CO₂ levels. Use a delta of 5ppm, sig.level (alpha) of 0.05, and power of 0.95. Make two estimates one with the point estimate of the sample variance, and another with the upper confidence limit. In each case, how large should each sample interval be? (remember the "round up" rule) power.t.test(n-NULL, delta-5, sd-sqrt(var (pilot.data)), sig.level-0.05, power-0.95, alternative "two-sided") # why 2-sided/ # don't forget the second estimate Exercise 3 Use the power.t.test() function to estimate the sample sizes for a two-sample t test comparing mean CO₂ levels. Use a delta of 5ppm, sig. level (alpha) of 0.05, and power of 0.95. Make two estimates one with the point estimate of the sample variance, and another with the upper confidence limit. In each case, how large should each sample interval be? (remember the "round up" rule) power. t.test(n-NULL, delta-5, sd-sqrt(var (pilot.data)), sig.level-0.05, power-0.95, alternative "two.sided") #why 2-sided? #don't forget the second estimate Write tho Roport YOUR TURN The Problem Is atmosphenc CO₂ concentration increasing? Short term trends can be misleading, so it might be more credible to compare the means of widely separated intervals, using a two-sample t test. How large should those intervals be to get a significant result? Estimate the sample sizes in two steps • use "pilot study data to calculate an interval estimate of variance • use the upper confidence limit of the sample variance to estimate sample sizes Get a Sample Exercise 1 Use the first two years of monthly observations from the coz data frame as your pilot study sample. What is the point estimate of the sample variance? pilot.data <- co2[1:24] var (pilot.data) Bootstrap an Interval Estimate Exercise 2 Exercise 3 Calculate a 95% bootstrap confidence interval type-bca for the pilot.data. Save the upper confidence limit to working variable var.upper. How large is the upper confidence limit in comparison to the point estimate? Bco2var <boot (pilot.data, Boot.Link, R-1000) (varci <boot.ci(Bcozvar, type="bca")); var.upper <varCISbca[5] Use the power.t.test() function to estimate the sample sizes for a two-sample t test comparing mean CO₂ levels. Use a delta of 5ppm, sig.level (alpha) of 0.05, and power of 0.95. Make two estimates one with the point estimate of the sample variance, and another with the upper confidence limit. In each case, how large should each sample interval be? (remember the "round up" rule) power.t.test(n-NULL, delta-5, sd-sqrt(var (pilot.data)), sig.level-0.05, power-0.95, alternative "two-sided") # why 2-sided/ # don't forget the second estimate
Expert Answer:
Answer rating: 100% (QA)
Given that the delta5 the level of significance is5005 the power is095 the alternative is ... View the full answer
Related Book For
Applied Statistics From Bivariate Through Multivariate Techniques
ISBN: 978-1412991346
2nd edition
Authors: Rebecca M. Warner
Posted Date:
Students also viewed these accounting questions
-
Describe in each case how you would separate the cations or anions in an aqueous solution of: (a) NaNO3 and Ba(NO3)2, (b) Mg(NO3)2 and KNO3 , (c) KBr and KNO3, (d) K3PO4 and KNO3, (e) Na2CO3 and...
-
Comparing two means with confidence intervals and tests of hypotheses; sample size is small. Based on the descriptions of two populations, determine if it would be appropriate to apply the...
-
Confidence Interval for Sample of Size n 1 Based on the article An Effective Confidence Interval for the Mean with Samples of Size One and Two, by Wall, Boen, and Tweedie (American Statistician,...
-
Scandinavo Ltd. is a CCPC that began operations on January 1, 2020 when it was first incorporated and a calendar fiscal period was chosen. Scandinavo Ltd. Is not associated with any other...
-
Glass, Inc., began 2012 with $83,000 in cash. During 2012, Glass earned net income of $430,000, and adjustments to reconcile net income to net cash provided by operations totaled $75,000, a positive...
-
Jack Dorsey, the executive chairman of Twitter, and the CEO of Square, is quite soft spoken yet still very persuasive. How can that be?
-
Compute the missing amount for Jones Corporation. You will need to work through total stockholders equity. Requirements 1. Did Jones earn a net income or suffer a net loss for the year ? Compute the...
-
Evaluating an Ethical Dilemma: Earnings, Inventory Purchases, and Management Bonuses Micro Warehouse was a computer software and hardware online and catalog sales company. * A Wall Street Journal...
-
2. Evaluate a. dx xx-1 b. d. dx 2x+3+x e. S r Ar + 1 dx 1+ 3x dx dx C. x-3x dx f. x4x+1
-
When buying or leasing a new car, one of the factors that customers consider is the type of fuel it uses. Some people prefer vehicles that use diesel fuel, while others favor vehicles that use...
-
All done in Java : 1. Create a class Contractor . 2. Create the following instance variables that will be accessible only within this class: String name; int number; int...
-
List describe, and give an example of each of the four e-procurement methods and argue when each might be used.
-
es Tasty Subs acquired a food-service truck on October 1, 2024, for $15,900. The company estimates a residual value of $2,100 and a six- year service life. Required: Calculate depreciation expense...
-
Create a class that describes a circle and have the following: 1. Variable Length 2. Variable Wigth 3. Members: a. SetRadius b. GetRadius c. SetCenterX (you set the circle center coordinate xo). d....
-
Lengthy Issue Resolution Delays and Inadequate Notices Burden Taxpayers Who Are Victims of Identity Theft or Whose Returns the IRS Has Flagged for Possible Identity Theft? WHY THIS IS A SERIOUS...
-
Within the intricate tapestry of advanced organizational ecosystems, characterized by their complex network of interrelated stakeholders and intricate decision-making processes, what systemic factors...
-
Take air to have a mass density approximately one one thousandth that of water, or rho air = 1 . 0 kg / m 3 Consider a cube shaped volume of air with this density. What is the length of one side of...
-
A bar of a steel alloy that exhibits the stress-strain behavior shown in Figure 6.22 is subjected to a tensile load; the specimen is 375 mm (14.8 in.) long and has a square cross section 5.5 mm (0.22...
-
The data in the table below were collected in a famous social psychological field experiment. The researchers examined a common source of frustration for drivers: a car stopped at a traffic light...
-
In your own words, what does an SS tell us about a set of data? Under what circumstances will the value of SS equal 0? Can SS ever be negative?
-
If there is an overall significant F in a one way ANOVA, can we conclude that the group membership or treatment variable caused the observed differences in the group means? Why or why not?
-
Flynn Cycles uses the moving-weighted-average-cost method. Flynn started June with five bicycles that cost \(\$ 190\) each. On June 16, Flynn bought 20 bicycles at \(\$ 200\) each. On June 30, Flynn...
-
Garda's Equipment has the following items in its inventory on August 1: The company uses the specific-unit-cost method for costing inventory. During August, it sold units \(6 \mathrm{X} 6 \mathrm{~A}...
-
Use the Flynn Cycles data in S6-5 , except assume that Flynn uses the movingweighted-average-cost method, and journalize the following transactions: a. The June 16 purchase of inventory on account b....
Study smarter with the SolutionInn App