

The Home Depot, Inc., financial statements appear in Appendix A at the end of this textbook....
Fantastic news! We've Found the answer you've been seeking!
Question:
Transcribed Image Text:
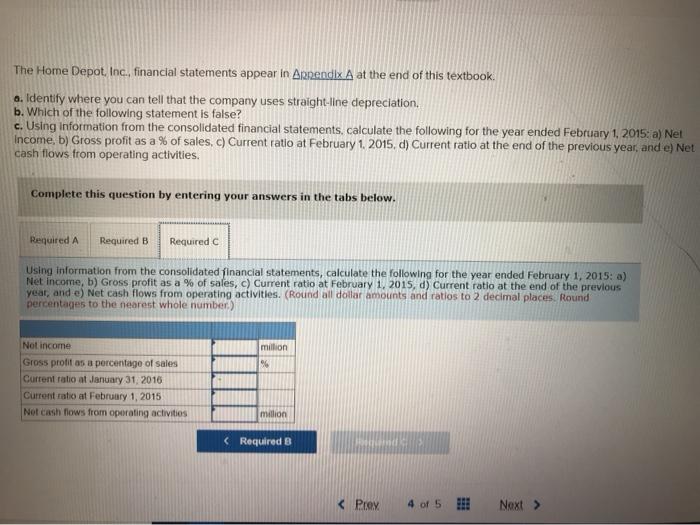
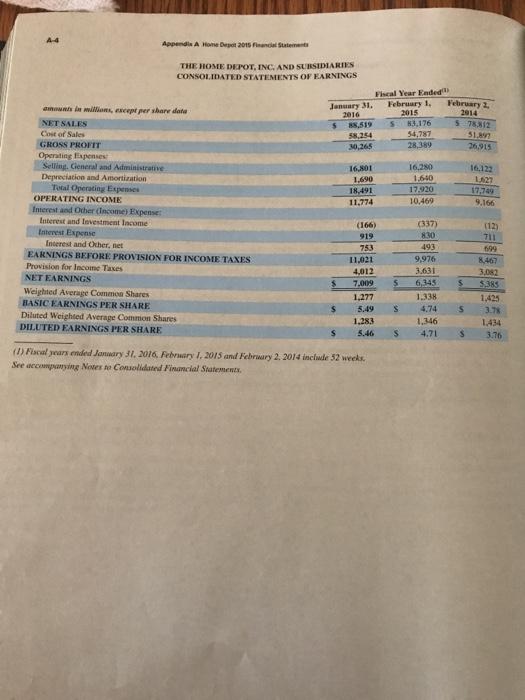
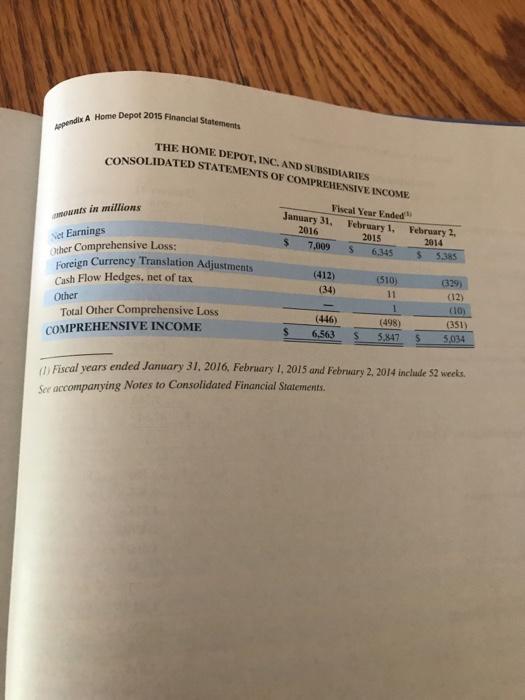
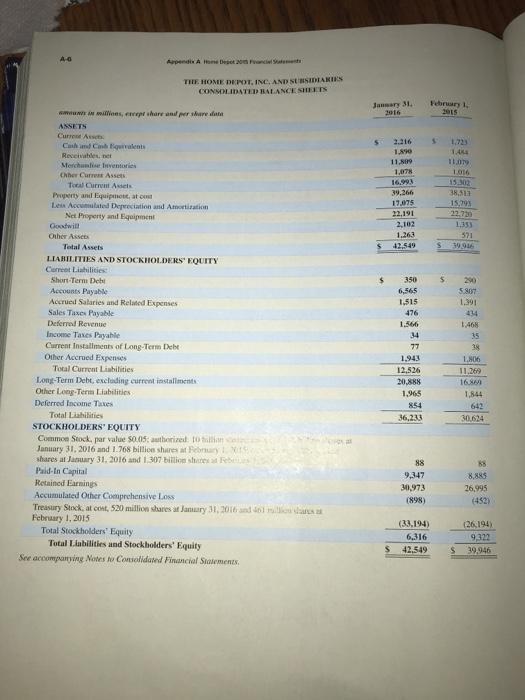
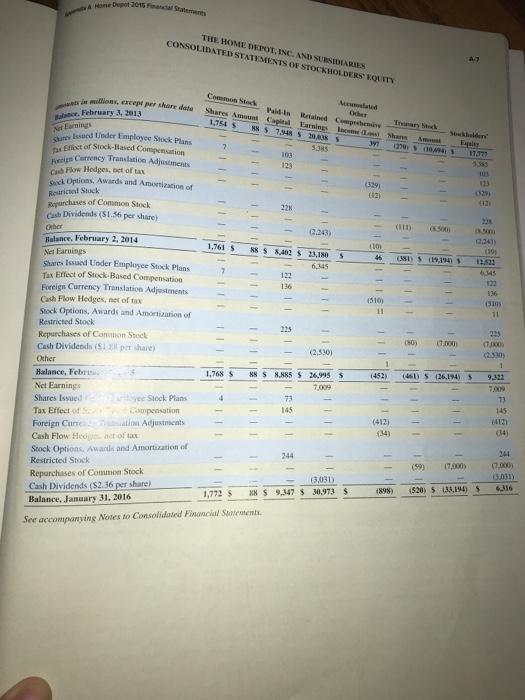
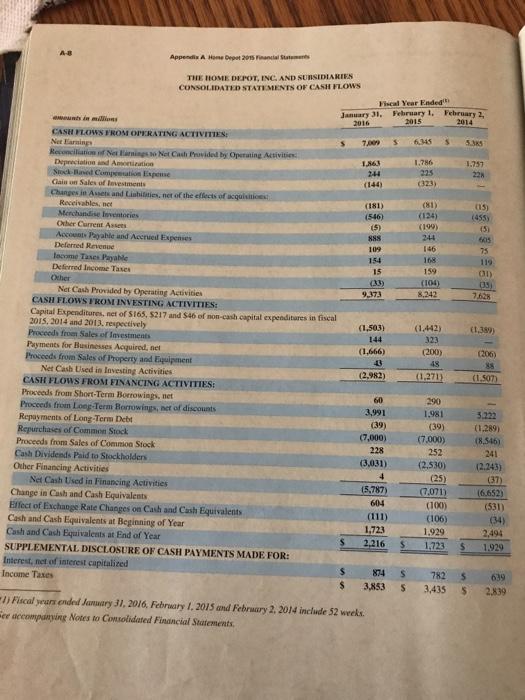
The Home Depot, Inc., financial statements appear in Appendix A at the end of this textbook. a. Identify where you can tell that the company uses straight-line depreciation. b. Which of the following statement is false? c. Using information from the consolidated financial statements, calculate the following for the year ended February 1, 2015: a) Net Income, b) Gross profit as a % of sales, c) Current ratio at February 1, 2015, d) Current ratio at the end of the previous year, and e) Net cash flows from operating activities. Complete this question by entering your answers in the tabs below. Required A Required B Required C Using information from the consolidated financial statements, calculate the following for the year ended February 1, 2015: a) Net income, b) Gross profit as a % of sales, c) Current ratio at February 1, 2015, d) Current ratio at the end of the previous year, and e) Net cash flows from operating activities. (Round all dollar amounts and ratios to 2 decimal places. Round percentages to the nearest whole number.) Not income Gross profit as a percentage of sales Current ratio at January 31, 2016 Current ratio at February 1, 2015 Not cash flows from operating activities million % million < Required B BAGNO CES < Prev 4 of 5 Next > A-4 Appendix A Home Depot 2015 Financial Statements THE HOME DEPOT, INC. AND SUBSIDIARIES CONSOLIDATED STATEMENTS OF EARNINGS amounts in millions, except per share data NET SALES Cost of Sales GROSS PROFIT Operating Expenses Selling, Cieneral and Administrative Depreciation and Amortization Total Operating Expenses OPERATING INCOME Interest and Other (Income) Expense: Interest and Investment Income Interest Expense Interest and Other, net EARNINGS BEFORE PROVISION FOR INCOME TAXES Provision for Income Taxes NET EARNINGS Weighted Average Common Shares BASIC EARNINGS PER SHARE Diluted Weighted Average Common Shares DILUTED EARNINGS PER SHARE January 31, 2016 $ S 88,519 58,254 30,265 16,801 1,690 18,491 11,774 (166) 919 753 11,021 4,012 7.009 1,277 5.49 1,283 Fiscal Year Ended February 1, 2015 83,176 54,787 28,389 5.46 (1) Fiscal years ended January 31, 2016 February 1, 2015 and February 2, 2014 include 52 weeks. See accompanying Notes to Consolidated Financial Statements. S S S S 16,280 1.640 17,920 10,469 (337) 830 493 9,976 3.631 6,345 February 1, 2014 5 78312 51.897 26,915 S 1,338 4,74 1,346 4.71 S S 16,122 1827 17,749 9,166 (12) 711 699 8,467 3,082 5,385 1,425 3.78 1,434 3.76 Appendix A Home Depot 2015 Financial Statements THE HOME DEPOT, INC. AND SUBSIDIARIES CONSOLIDATED STATEMENTS OF COMPREHENSIVE INCOME amounts in millions Net Earnings Other Comprehensive Loss: Foreign Currency Translation Adjustments Cash Flow Hedges, net of tax Other Total Other Comprehensive Loss COMPREHENSIVE INCOME Fiscal Year Ended February 1, 2015 S 6,345 January 31, 2016 $ 7,009 (412) (34) (446) 6,563 $ (510) 11 1 (498) 5,847 February 2, 2014 $ 5,385 (329) (12) (10) (351) 5,034 (1) Fiscal years ended January 31, 2016, February 1, 2015 and February 2, 2014 include 52 weeks. See accompanying Notes to Consolidated Financial Statements. A-G Appendix A Home Depot 2015 Fanciel THE HOME DEPOT, INC. AND SUBSIDIARIES CONSOLIDATED BALANCE SHEETS aments in millions, except share and per share data ASSETS Current Assets Cash and Cash Equivalents Receivables, net Merchandise Inventories Other Current Assets Total Current Assets Property and Equipment, at cost Less Accumulated Depreciation and Amortization Net Property and Equipment Goodwill Other Assets Total Assets LIABILITIES AND STOCKHOLDERS' EQUITY Corrent Liabilities: Short-Term Debi Accounts Payable Accrued Salaries and Related Expenses Sales Taxes Payable Deferred Revenue Income Taxes Payable Current Installments of Long-Term Debt Other Accrued Expenses Total Current Liabilities. Long-Term Debt, excluding current installments Other Long-Term Liabilities Deferred Income Taxes Total Liabilities STOCKHOLDERS' EQUITY Common Stock, par value $0.05: authorized to alliances January 31, 2016 and 1.768 billion shares at February 1 2015 shares at January 31, 2016 and 1.307 billion shares at Febes Paid-In Capital Retained Earnings Accumulated Other Comprehensive Loss Treasury Stock, at cost, 520 million shares at January 31, 2016 and 461 million shares February 1, 2015 Total Stockholders' Equity Total Liabilities and Stockholders' Equity See accompanying Notes to Consolidated Financial Statements. January 31, 2016 5 $ 2.216 1,890 11,809 1,078 16.993 39,266 17,075 22,191 2,102 1.263 42,549 350 6,565 1,515 476 1.566 34 77 1,943 12,526 20,888 1,965 854 36,233 88 9,347 30,973 (898) (33,194) 6,316 42,549 February 1, 2015 $ 1,723 1.444 11.079 1.016 15.302 38,513 15,79% 22.739 1,353 571 39,916 S 290 5.807 1.391 434 1468 35 38 1.806 11,269 16.860 1,844 642 30,624 88 8,885 26,995 (452) (26,194) 9,322 39,946 Home Depot 2015 Financial Statement THE HOME DEPOT, INC. AND SUBSIDIARIES CONSOLIDATED STATEMENTS OF STOCKHOLDERS' EQUITY in millions, except per share date Balance. February 3, 2013 Net Earnings Shares Issued Under Employee Stock Plans Tax Effect of Stock-Based Compensation Foreign Currency Translation Adjustments Cash Flow Hedges, net of tax Sack Options, Awards and Amortization of Restricted Stock Repurchases of Common Stock Cash Dividends ($1.36 per share) Other Balance, February 2, 2014 Net Earnings Shares Issued Under Employee Stock Plans Tax Effect of Stock-Based Compensation Foreign Currency Translation Adjustments Cash Flow Hedges, net of tax Stock Options, Awards and Amortization of Restricted Stock Repurchases of Common Stock Cash Dividends (81 per share) Other Balance, Febru Mormulated Oder Common Stock Shares Amount Capital Earnings Income (Lo Paid In Retained Comprehensive 1,754 7,348 5 20,838 S 397 111 1,761 S 1111 1,768 1111 |||||||IIII (2243) 88 5 8,402 $ 23,180 6,345 |||||| 103 123 Net Earnings Shares Issued yee Stock Plans Tax Effect of Compensation Foreign Curre 7 ation Adjustments Cash Flow Hedge net of tax Stock Options, Awards and Amortization of Restricted Stock Repurchases of Common Stock Cash Dividends ($2.36 per share) 1,772 S Balance, January 31, 2016 See accompanying Notes to Consolidated Financial Statements. III 122 136 1 225 88 $ 8,885 $ 26,995 S 7,009 (2,530) 244 S 1132 (3,031) 88 S 9,347 $ 30,973 $ (329) (10) (510) 11 Trewary Mock Shares M (370) (18/ (412) (34) (898) (452) (461) (111) (K5001 (80) (381) 5 (19,396) 1211111 (59) Soukholders S (7,000) A-7 111 17.377 (26.194) S 101 123 (329) (12) 228 185000 (2243) (30) 12,823 (7,000) (520) 5 (33,194) S 6,345 122 136 (530) 11 225 (73000) (2.530) 1 9,322 7.009 73 145 (412) (34) 244 (7,000) (3,031) Appendix A Home Depot 2015 Financial Statements THE HOME DEPOT, INC. AND SUBSIDIARIES CONSOLIDATED STATEMENTS OF CASH FLOWS wounts in millions CASH FLOWS FROM OPERATING ACTIVITIES: Net Earnings Reconciliation of Net Earnings to Net Cash Provided by Operating Activities Depreciation and Amortization Stock-Based Compensation Expense Gain on Sales of lovestments Changes in Assets and Liabilities, net of the effects of acquisitions Receivables, net Merchandise Inventories Other Current Assets Accounts Payable and Accrued Expenses Deferred Revenue Income Taxes Payable Deferred Income Taxes Other Net Cash Provided by Operating Activities CASH FLOWS FROM INVESTING ACTIVITIES: Capital Expenditures, net of $165, $217 and $46 of non-cash capital expenditures in fiscal 2015, 2014 and 2013, respectively Proceeds from Sales of Investments Payments for Businesses Acquired, net Proceeds from Sales of Property and Equipment Net Cash Used in Investing Activities CASH FLOWS FROM FINANCING ACTIVITIES: Proceeds from Short-Term Borrowings, net Proceeds from Long-Term Borrowings, net of discounts Repayments of Long-Term Debt Repurchases of Common Stock Proceeds from Sales of Common Stock Cash Dividends Paid to Stockholders Other Financing Activities Net Cash Used in Financing Activities Change in Cash and Cash Equivalents Effect of Exchange Rate Changes on Cash and Cash Equivalents Cash and Cash Equivalents at Beginning of Year Cash and Cash Equivalents at End of Year SUPPLEMENTAL DISCLOSURE OF CASH PAYMENTS MADE FOR: Interest, net of interest capitalized Income Taxes Fiscal Year Ended January 31, February 1, February 2, 2016 2015 2014 $ 7,009 1,863 244 (144) (181) (546) (5) 888 109 154 15 (33) 9,373 (1,503) 144 (1,666) 43 (2,982) 60 3,991 (39) (7,000) 228 (3,031) 4 (5,787) 604 (111) 1,723 2,216 $ 874 $ 3,853 1) Fiscal years ended January 31, 2016, February 1, 2015 and February 2, 2014 include 52 weeks. ee accompanying Notes to Consolidated Financial Statements. S ss. S 6,345 S 1.786 225 (323) (124) (199) 244 146 168 159 (104) 8,242 (1,442) 323 (200) 48 (1,271) S 290 1,981 (39) (7,000) 252 (2,530) (25) (7,071) (100) (106) 1,929 S 1.723 $ 5.385 782 3,435 1.757 228 S $ (15) (455) (5) 605 75 119 (31) (35) 7,628 (1,389) (206) 88 (1.507) 3.222 (1.289) (8,546) 241 (2.243) (37) (6.652) (531) (34) 2,494 1.929 639 2,839 The Home Depot, Inc., financial statements appear in Appendix A at the end of this textbook. a. Identify where you can tell that the company uses straight-line depreciation. b. Which of the following statement is false? c. Using information from the consolidated financial statements, calculate the following for the year ended February 1, 2015: a) Net Income, b) Gross profit as a % of sales, c) Current ratio at February 1, 2015, d) Current ratio at the end of the previous year, and e) Net cash flows from operating activities. Complete this question by entering your answers in the tabs below. Required A Required B Required C Using information from the consolidated financial statements, calculate the following for the year ended February 1, 2015: a) Net income, b) Gross profit as a % of sales, c) Current ratio at February 1, 2015, d) Current ratio at the end of the previous year, and e) Net cash flows from operating activities. (Round all dollar amounts and ratios to 2 decimal places. Round percentages to the nearest whole number.) Not income Gross profit as a percentage of sales Current ratio at January 31, 2016 Current ratio at February 1, 2015 Not cash flows from operating activities million % million < Required B BAGNO CES < Prev 4 of 5 Next > A-4 Appendix A Home Depot 2015 Financial Statements THE HOME DEPOT, INC. AND SUBSIDIARIES CONSOLIDATED STATEMENTS OF EARNINGS amounts in millions, except per share data NET SALES Cost of Sales GROSS PROFIT Operating Expenses Selling, Cieneral and Administrative Depreciation and Amortization Total Operating Expenses OPERATING INCOME Interest and Other (Income) Expense: Interest and Investment Income Interest Expense Interest and Other, net EARNINGS BEFORE PROVISION FOR INCOME TAXES Provision for Income Taxes NET EARNINGS Weighted Average Common Shares BASIC EARNINGS PER SHARE Diluted Weighted Average Common Shares DILUTED EARNINGS PER SHARE January 31, 2016 $ S 88,519 58,254 30,265 16,801 1,690 18,491 11,774 (166) 919 753 11,021 4,012 7.009 1,277 5.49 1,283 Fiscal Year Ended February 1, 2015 83,176 54,787 28,389 5.46 (1) Fiscal years ended January 31, 2016 February 1, 2015 and February 2, 2014 include 52 weeks. See accompanying Notes to Consolidated Financial Statements. S S S S 16,280 1.640 17,920 10,469 (337) 830 493 9,976 3.631 6,345 February 1, 2014 5 78312 51.897 26,915 S 1,338 4,74 1,346 4.71 S S 16,122 1827 17,749 9,166 (12) 711 699 8,467 3,082 5,385 1,425 3.78 1,434 3.76 Appendix A Home Depot 2015 Financial Statements THE HOME DEPOT, INC. AND SUBSIDIARIES CONSOLIDATED STATEMENTS OF COMPREHENSIVE INCOME amounts in millions Net Earnings Other Comprehensive Loss: Foreign Currency Translation Adjustments Cash Flow Hedges, net of tax Other Total Other Comprehensive Loss COMPREHENSIVE INCOME Fiscal Year Ended February 1, 2015 S 6,345 January 31, 2016 $ 7,009 (412) (34) (446) 6,563 $ (510) 11 1 (498) 5,847 February 2, 2014 $ 5,385 (329) (12) (10) (351) 5,034 (1) Fiscal years ended January 31, 2016, February 1, 2015 and February 2, 2014 include 52 weeks. See accompanying Notes to Consolidated Financial Statements. A-G Appendix A Home Depot 2015 Fanciel THE HOME DEPOT, INC. AND SUBSIDIARIES CONSOLIDATED BALANCE SHEETS aments in millions, except share and per share data ASSETS Current Assets Cash and Cash Equivalents Receivables, net Merchandise Inventories Other Current Assets Total Current Assets Property and Equipment, at cost Less Accumulated Depreciation and Amortization Net Property and Equipment Goodwill Other Assets Total Assets LIABILITIES AND STOCKHOLDERS' EQUITY Corrent Liabilities: Short-Term Debi Accounts Payable Accrued Salaries and Related Expenses Sales Taxes Payable Deferred Revenue Income Taxes Payable Current Installments of Long-Term Debt Other Accrued Expenses Total Current Liabilities. Long-Term Debt, excluding current installments Other Long-Term Liabilities Deferred Income Taxes Total Liabilities STOCKHOLDERS' EQUITY Common Stock, par value $0.05: authorized to alliances January 31, 2016 and 1.768 billion shares at February 1 2015 shares at January 31, 2016 and 1.307 billion shares at Febes Paid-In Capital Retained Earnings Accumulated Other Comprehensive Loss Treasury Stock, at cost, 520 million shares at January 31, 2016 and 461 million shares February 1, 2015 Total Stockholders' Equity Total Liabilities and Stockholders' Equity See accompanying Notes to Consolidated Financial Statements. January 31, 2016 5 $ 2.216 1,890 11,809 1,078 16.993 39,266 17,075 22,191 2,102 1.263 42,549 350 6,565 1,515 476 1.566 34 77 1,943 12,526 20,888 1,965 854 36,233 88 9,347 30,973 (898) (33,194) 6,316 42,549 February 1, 2015 $ 1,723 1.444 11.079 1.016 15.302 38,513 15,79% 22.739 1,353 571 39,916 S 290 5.807 1.391 434 1468 35 38 1.806 11,269 16.860 1,844 642 30,624 88 8,885 26,995 (452) (26,194) 9,322 39,946 Home Depot 2015 Financial Statement THE HOME DEPOT, INC. AND SUBSIDIARIES CONSOLIDATED STATEMENTS OF STOCKHOLDERS' EQUITY in millions, except per share date Balance. February 3, 2013 Net Earnings Shares Issued Under Employee Stock Plans Tax Effect of Stock-Based Compensation Foreign Currency Translation Adjustments Cash Flow Hedges, net of tax Sack Options, Awards and Amortization of Restricted Stock Repurchases of Common Stock Cash Dividends ($1.36 per share) Other Balance, February 2, 2014 Net Earnings Shares Issued Under Employee Stock Plans Tax Effect of Stock-Based Compensation Foreign Currency Translation Adjustments Cash Flow Hedges, net of tax Stock Options, Awards and Amortization of Restricted Stock Repurchases of Common Stock Cash Dividends (81 per share) Other Balance, Febru Mormulated Oder Common Stock Shares Amount Capital Earnings Income (Lo Paid In Retained Comprehensive 1,754 7,348 5 20,838 S 397 111 1,761 S 1111 1,768 1111 |||||||IIII (2243) 88 5 8,402 $ 23,180 6,345 |||||| 103 123 Net Earnings Shares Issued yee Stock Plans Tax Effect of Compensation Foreign Curre 7 ation Adjustments Cash Flow Hedge net of tax Stock Options, Awards and Amortization of Restricted Stock Repurchases of Common Stock Cash Dividends ($2.36 per share) 1,772 S Balance, January 31, 2016 See accompanying Notes to Consolidated Financial Statements. III 122 136 1 225 88 $ 8,885 $ 26,995 S 7,009 (2,530) 244 S 1132 (3,031) 88 S 9,347 $ 30,973 $ (329) (10) (510) 11 Trewary Mock Shares M (370) (18/ (412) (34) (898) (452) (461) (111) (K5001 (80) (381) 5 (19,396) 1211111 (59) Soukholders S (7,000) A-7 111 17.377 (26.194) S 101 123 (329) (12) 228 185000 (2243) (30) 12,823 (7,000) (520) 5 (33,194) S 6,345 122 136 (530) 11 225 (73000) (2.530) 1 9,322 7.009 73 145 (412) (34) 244 (7,000) (3,031) Appendix A Home Depot 2015 Financial Statements THE HOME DEPOT, INC. AND SUBSIDIARIES CONSOLIDATED STATEMENTS OF CASH FLOWS wounts in millions CASH FLOWS FROM OPERATING ACTIVITIES: Net Earnings Reconciliation of Net Earnings to Net Cash Provided by Operating Activities Depreciation and Amortization Stock-Based Compensation Expense Gain on Sales of lovestments Changes in Assets and Liabilities, net of the effects of acquisitions Receivables, net Merchandise Inventories Other Current Assets Accounts Payable and Accrued Expenses Deferred Revenue Income Taxes Payable Deferred Income Taxes Other Net Cash Provided by Operating Activities CASH FLOWS FROM INVESTING ACTIVITIES: Capital Expenditures, net of $165, $217 and $46 of non-cash capital expenditures in fiscal 2015, 2014 and 2013, respectively Proceeds from Sales of Investments Payments for Businesses Acquired, net Proceeds from Sales of Property and Equipment Net Cash Used in Investing Activities CASH FLOWS FROM FINANCING ACTIVITIES: Proceeds from Short-Term Borrowings, net Proceeds from Long-Term Borrowings, net of discounts Repayments of Long-Term Debt Repurchases of Common Stock Proceeds from Sales of Common Stock Cash Dividends Paid to Stockholders Other Financing Activities Net Cash Used in Financing Activities Change in Cash and Cash Equivalents Effect of Exchange Rate Changes on Cash and Cash Equivalents Cash and Cash Equivalents at Beginning of Year Cash and Cash Equivalents at End of Year SUPPLEMENTAL DISCLOSURE OF CASH PAYMENTS MADE FOR: Interest, net of interest capitalized Income Taxes Fiscal Year Ended January 31, February 1, February 2, 2016 2015 2014 $ 7,009 1,863 244 (144) (181) (546) (5) 888 109 154 15 (33) 9,373 (1,503) 144 (1,666) 43 (2,982) 60 3,991 (39) (7,000) 228 (3,031) 4 (5,787) 604 (111) 1,723 2,216 $ 874 $ 3,853 1) Fiscal years ended January 31, 2016, February 1, 2015 and February 2, 2014 include 52 weeks. ee accompanying Notes to Consolidated Financial Statements. S ss. S 6,345 S 1.786 225 (323) (124) (199) 244 146 168 159 (104) 8,242 (1,442) 323 (200) 48 (1,271) S 290 1,981 (39) (7,000) 252 (2,530) (25) (7,071) (100) (106) 1,929 S 1.723 $ 5.385 782 3,435 1.757 228 S $ (15) (455) (5) 605 75 119 (31) (35) 7,628 (1,389) (206) 88 (1.507) 3.222 (1.289) (8,546) 241 (2.243) (37) (6.652) (531) (34) 2,494 1.929 639 2,839
Expert Answer:

Related Book For 

Financial And Managerial Accounting The Basis For Business Decisions
ISBN: 9781260247930
19th Edition
Authors: Jan Williams, Susan Haka, Mark Bettner, Joseph Carcello
Posted Date:
Students also viewed these accounting questions
-
Celebrities often contract to endorse a product. Should they use the product regularly, or even like the product before they are allowed to claim that they "endorse" the product? If you were assigned...
-
how???? please explain Consider the following code snippet: what will be printed in line 11 ? 1. int c=0; 2. void Func_A (int n) 3. ( 4. if(n== 0) 5. return; 6. C++; 7. Func_A (n/10); 8.) 9. int...
-
Arthur bought 100 units in the ABC Segregated Fund in 2011, which has a 100% maturity guarantee, at a price of $16.00 per unit. At maturity in 2021, he reset the net asset value (NAV) per unit at...
-
Division S of ABC Company makes a part that it sells to other companies. Data on that part appear below: Selling price on the intermediate market $30 per unit Variable costs per unit $22 per unit...
-
How close to 2 do we have to take so that 5x + 3 is within a distance of (a) 0.1 and (b) 0.01 from 13?
-
Evaluate ANZ banks sustainability agenda and the implications for the business given the current macroeconomic environment that addresses both local and global challenges.
-
Table B. 11 presents data on the quality of Pinot Noir wine. a. Build an appropriate regression model for quality \(y\) using the all-possibleregressions approach. Use \(C_{p}\) as the model...
-
BrandCo currently has 50 million shares outstanding. If BrandCos shares are trading at $19.16 per share, what is the companys market capitalization (value of equity)? Assuming the market value of...
-
3. Prepare Income Statement, Statement of Owner's Equity and the Balance Sheet for the year 2023 from the following Trial Balance: Canadian Sounds Trial Balance Dec 31, 2023 Accounts Dr Cr Cash...
-
In auditing Train Company, you obtain directly from the bank Trains bank statement, canceled checks, and other memoranda which relate to the companys bank account for December 2016. In reconciling...
-
12 Find an equation for the tangent line to the graph of y = (x - 16x) 2 at the point (4,0). The equation of the tangent line is y= (Simplify your answer.) ...
-
Draw a short-run marginal cost curve, short-run average cost curve, and long-run average total cost curve for an efficient firm producing where there are diseconomies of scale.
-
Is an oligopolist more or less likely to engage in strategic decision making compared to a monopolistic competitor?
-
Why could diseconomies of scale never occur if production relationships were only technical relationships?
-
A student has just written on an exam that, in the long run, fixed cost will make the average total cost curve slope downward. Why will the professor mark it incorrect?
-
Your average total cost is $30; the price you receive for the good is $15. Should you keep on producing the good? Why?
-
Which of the following is a digital transducer? O a. LVDT O b. Strain gauge O c. Thermistor O d. Encoder The 4 bit equivalent value of analog number 11" is. O a. 1001 O b. 1101 O c. 1100 O d. 1011
-
Sportique Boutique reported the following financial data for 2012 and 2011. Instructions(a) Calculate the current ratio for Sportique Boutique for 2012 and 2011.(b) Suppose that at the end of 2012,...
-
Rouse Incorporated reported sales, cost of sales, and inventory figures for last year and the current year as follows (all dollars in thousands). What is the amount of inventory turnover for each...
-
Fick Psychological Services, Inc., closes its temporary accounts once each year on December 31. The company recently issued the following income statement as part of its annual report. Ficks...
-
You are the controller for 21st Century Technologies. Your staff has prepared an income statement for the current year and has developed the following additional information by analyzing changes in...
-
We had mentioned that from the partition function \(Z\), all possible thermodynamical quantities can be determined. In this problem, we will use the harmonic oscillator's partition function of Eq....
-
Let's consider the harmonic oscillator immersed in a heat bath of temperature \(T\). For any Hermitian operator \(\hat{A}\), we can define its thermal average denoted as...
-
We had established an intriguing relationship between the path integral of the previous chapter and the partition function here through "complexification" of the time coordinate. In this problem, we...

Study smarter with the SolutionInn App