

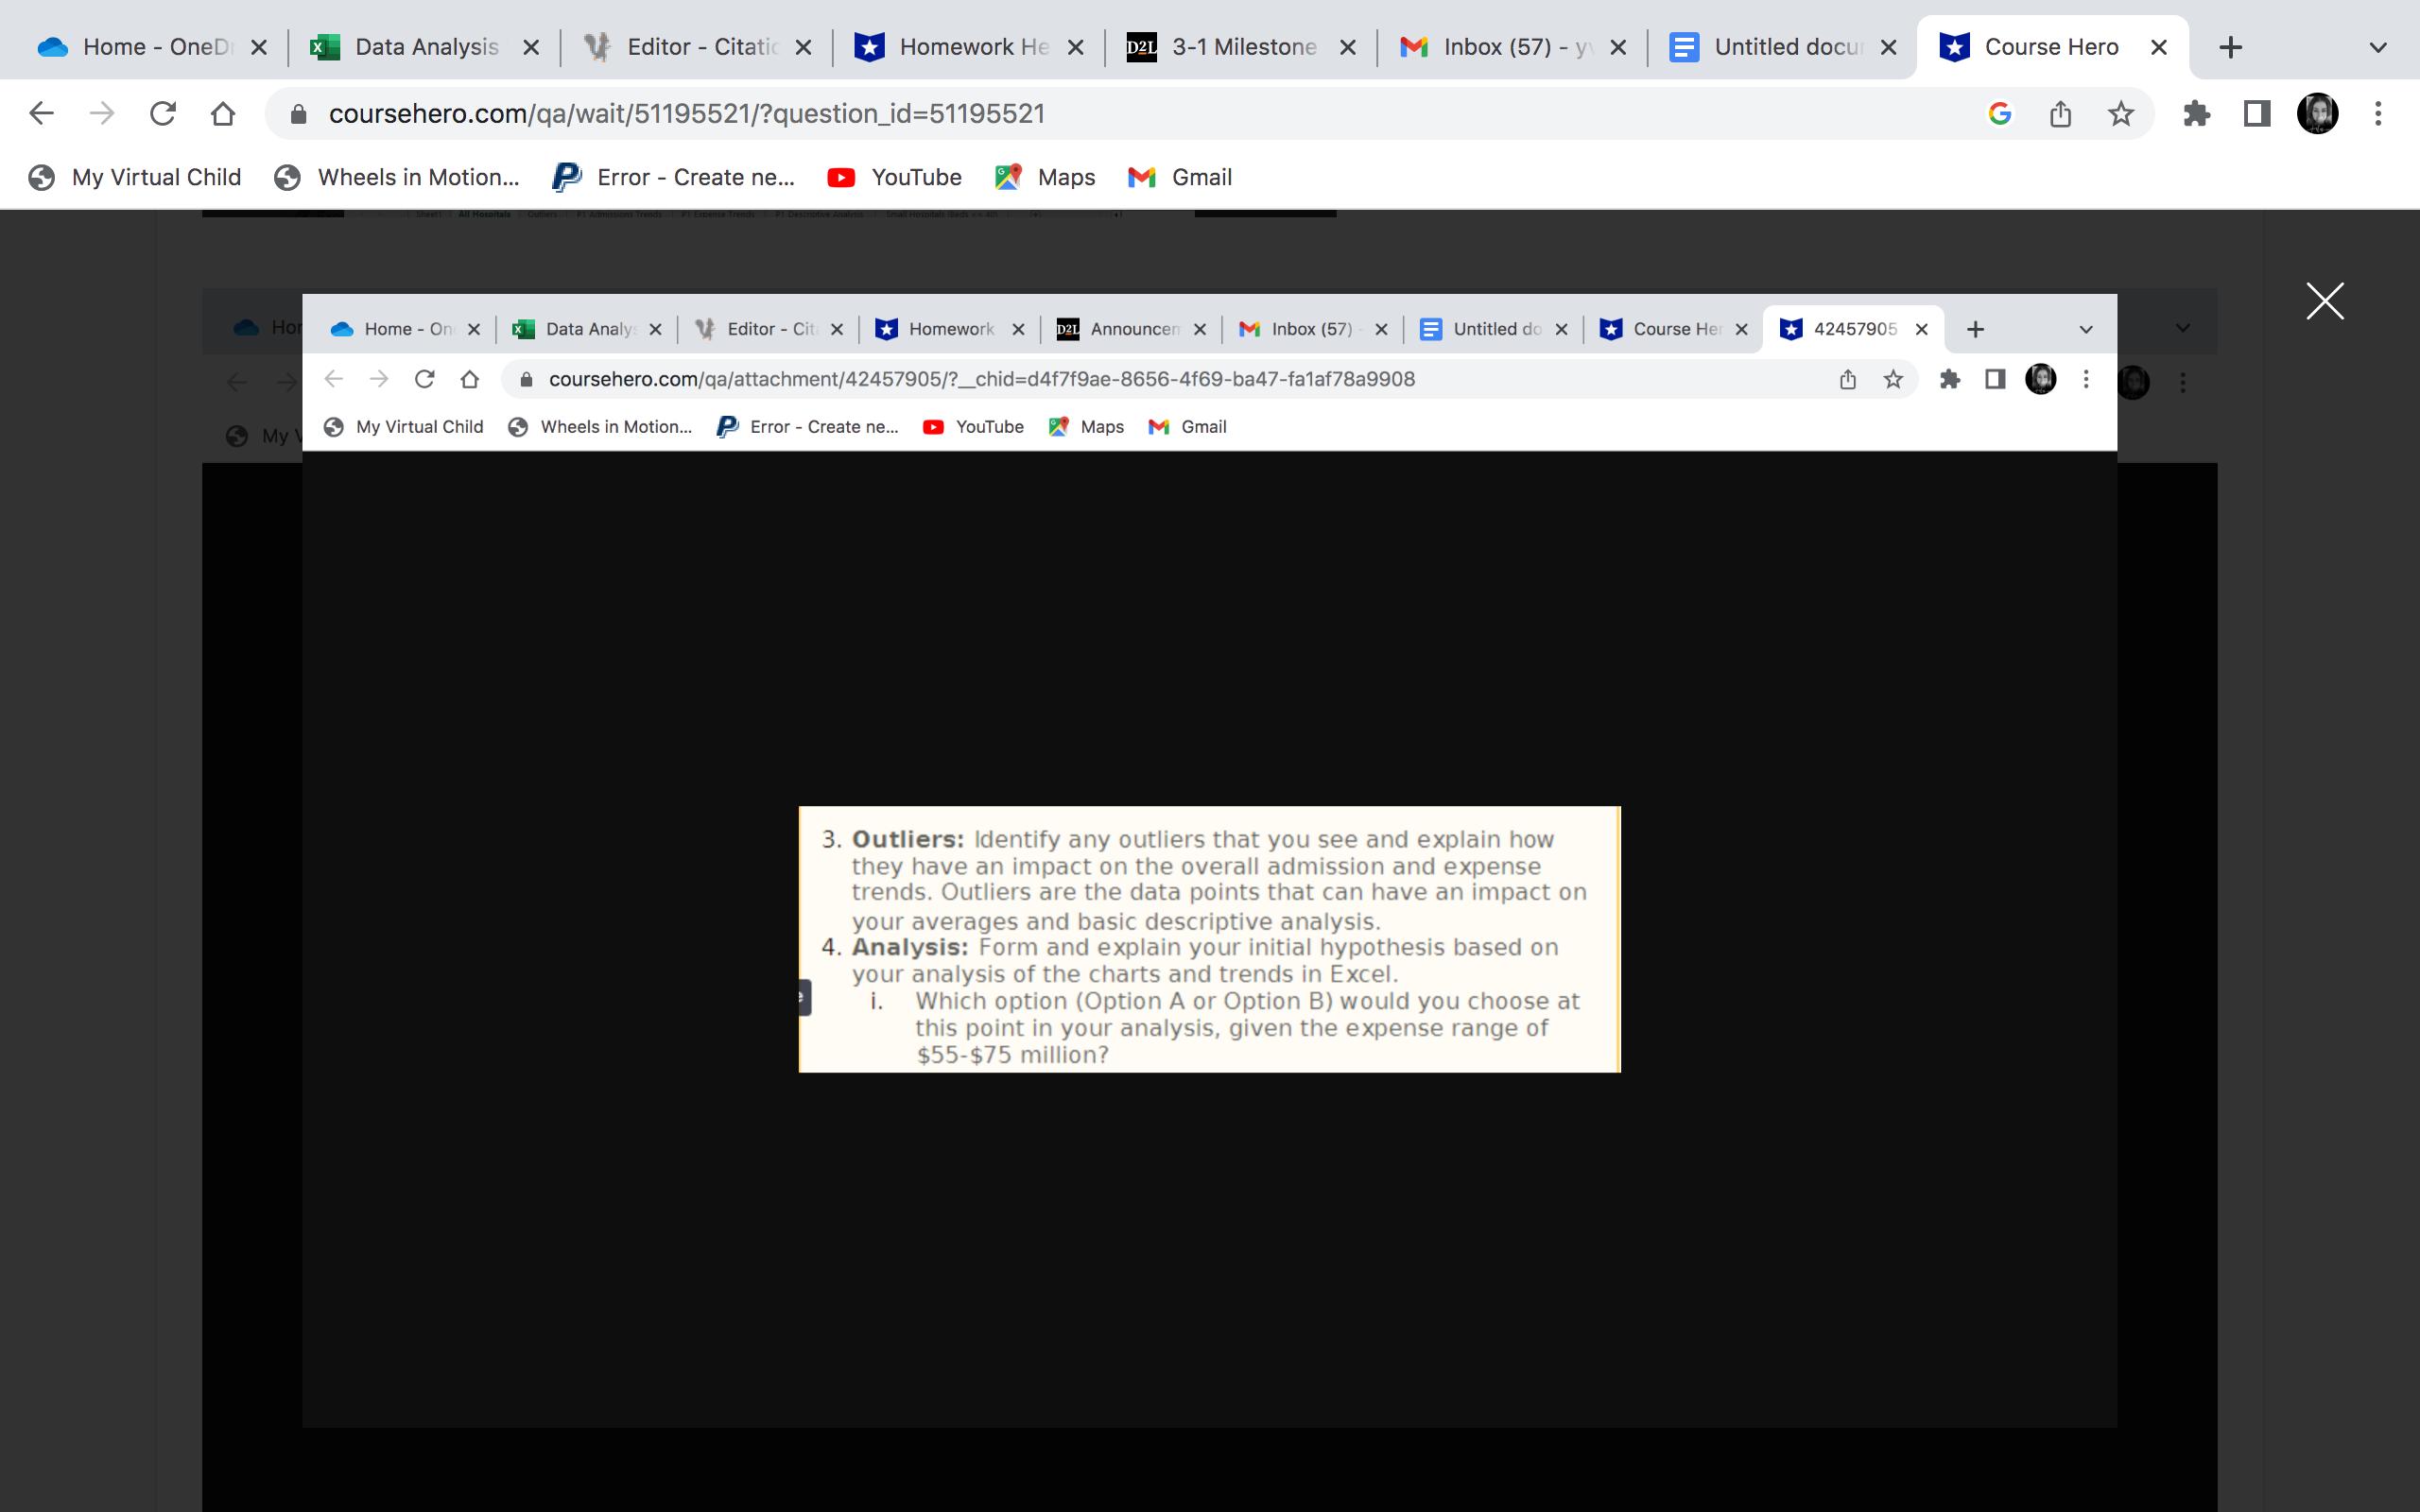
explain initial hypothesis based on the analysis based on the charts and trends on Excel. Then select
Fantastic news! We've Found the answer you've been seeking!
Question:
explain initial hypothesis based on the analysis based on the charts and trends on Excel. Then select from either: Small Facility= 90-100
Med Facility= 300-400
Which option is better at this point of the analysis, given the expense range of $55-75 million?
Descriptive Analysis
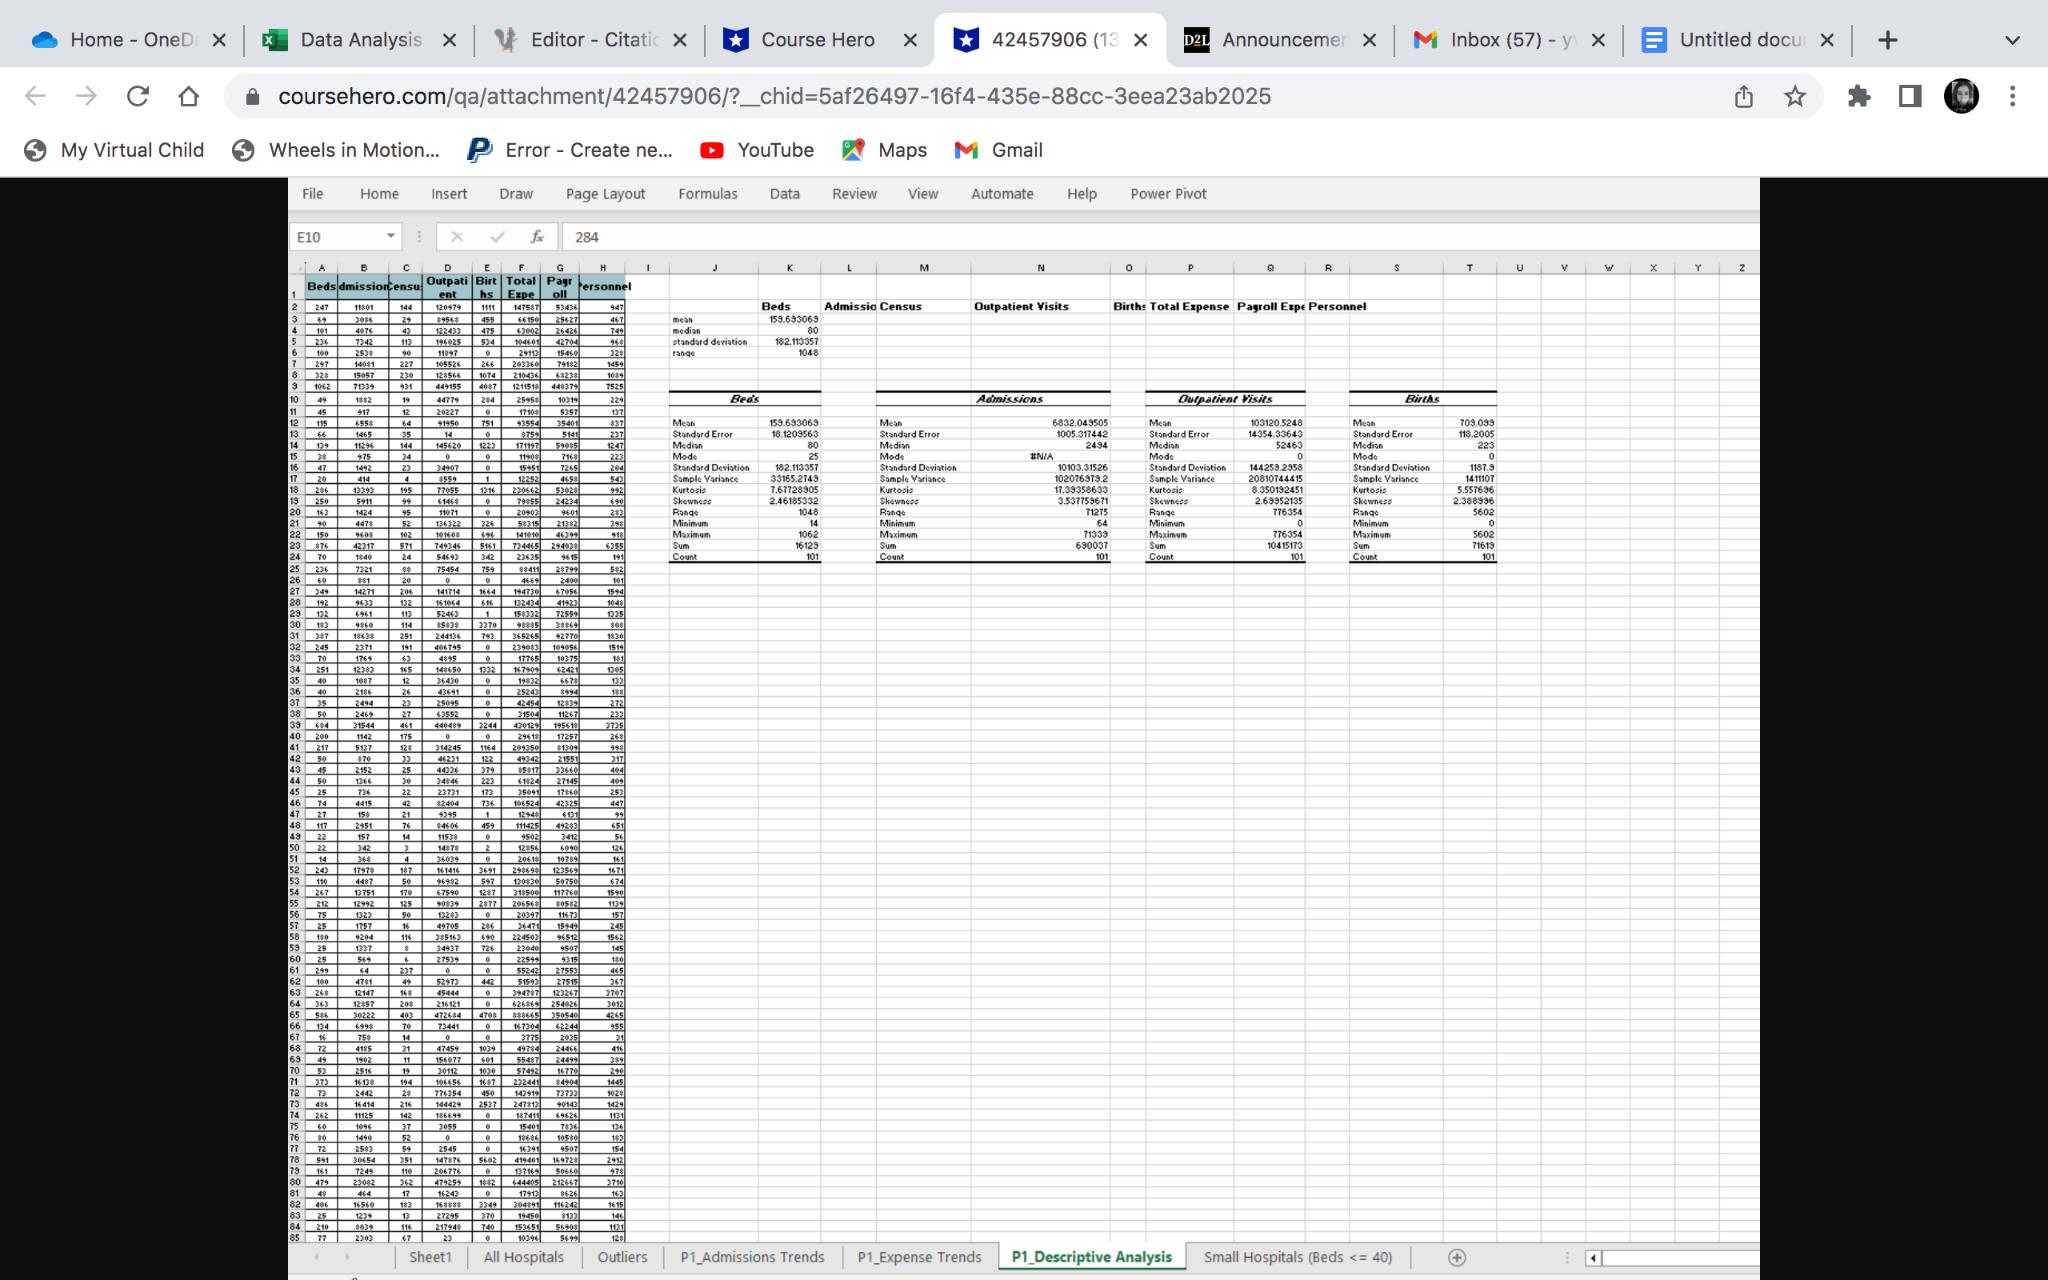
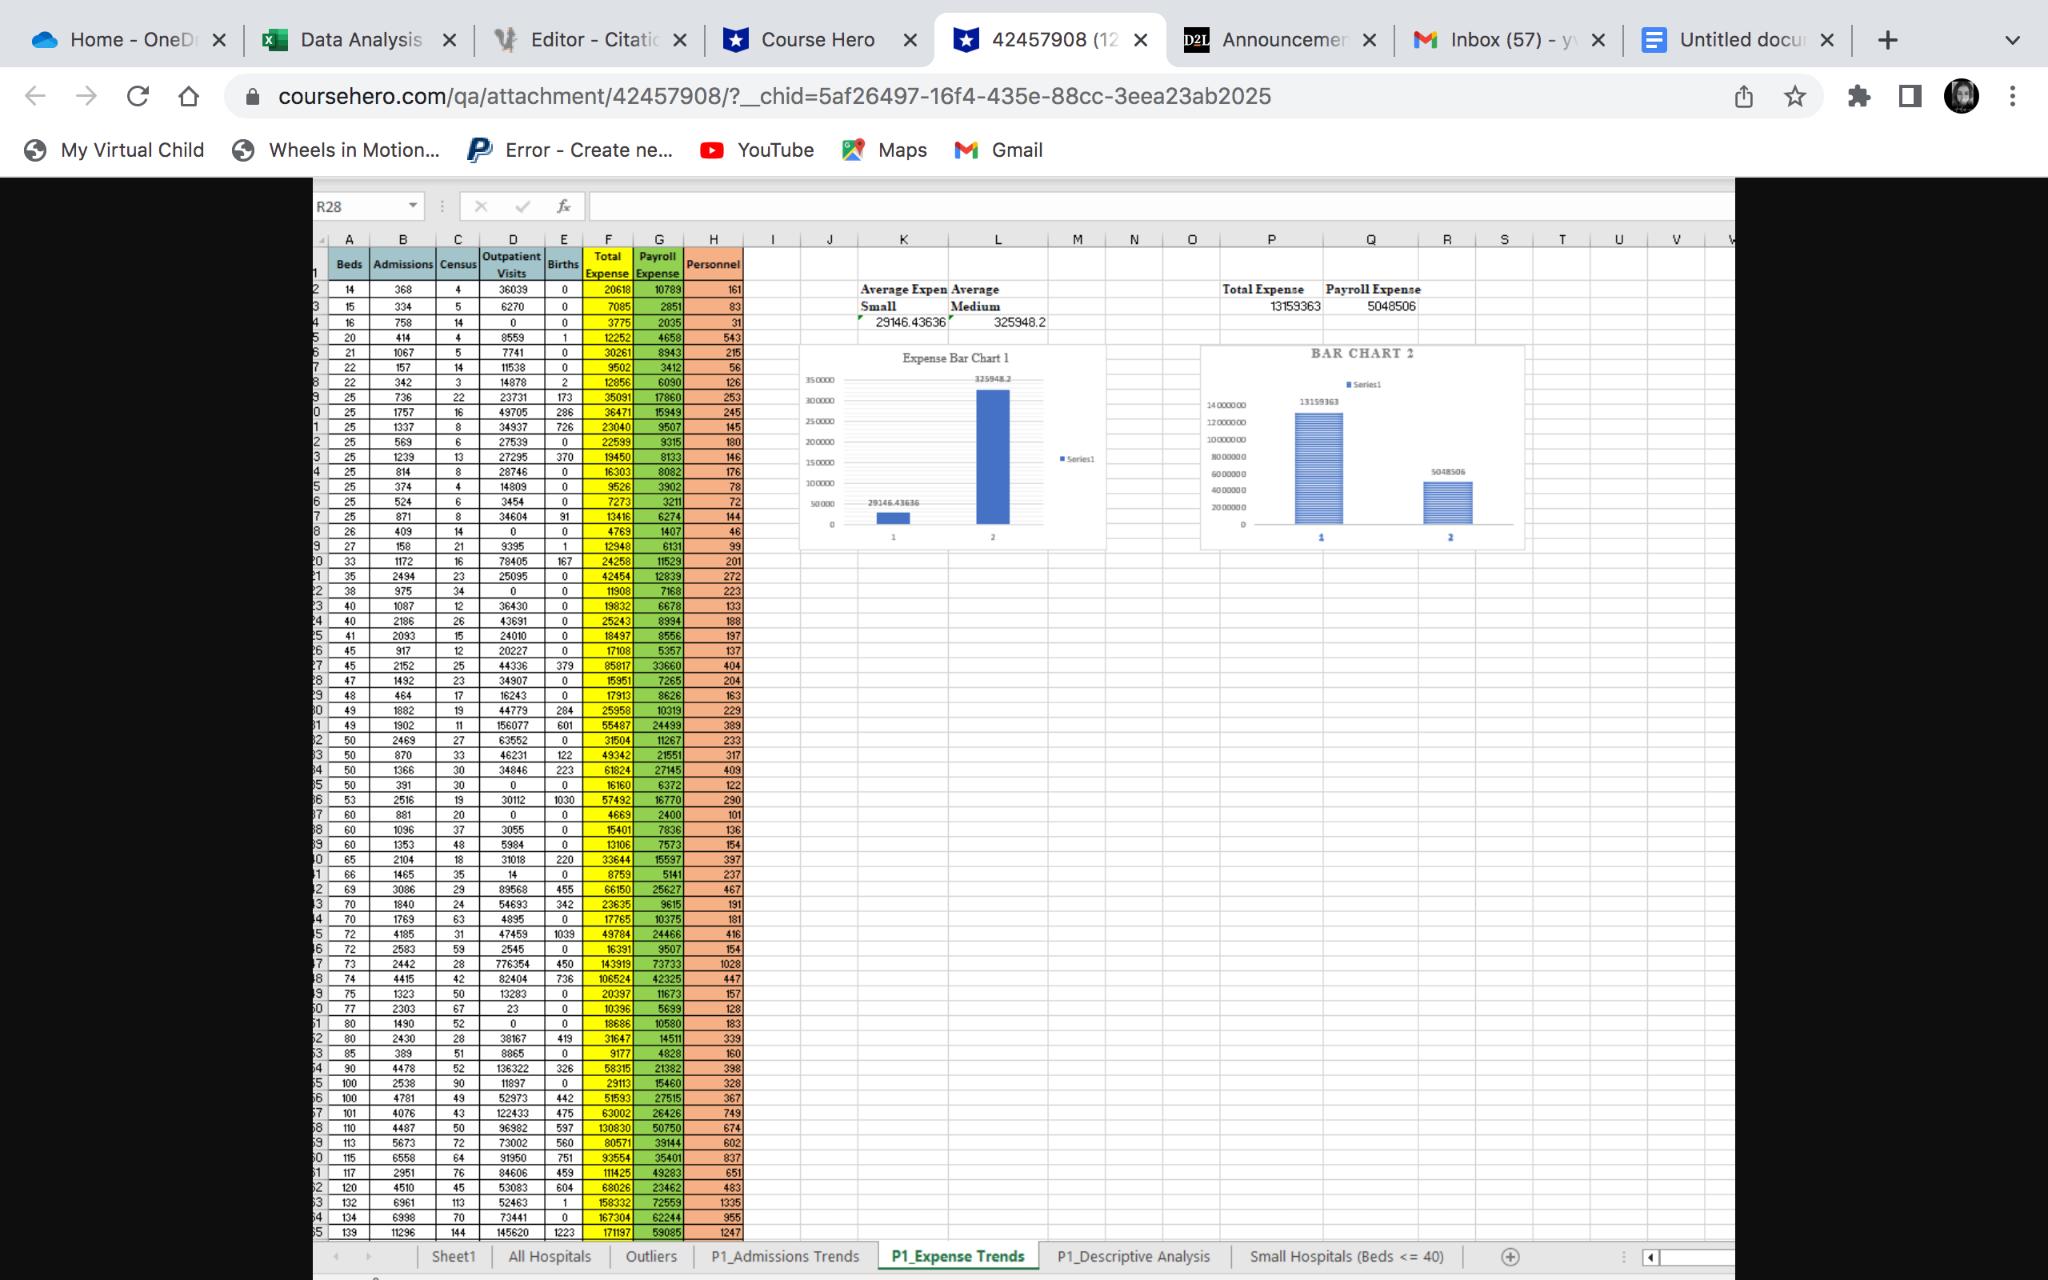
PI _Expense Trends
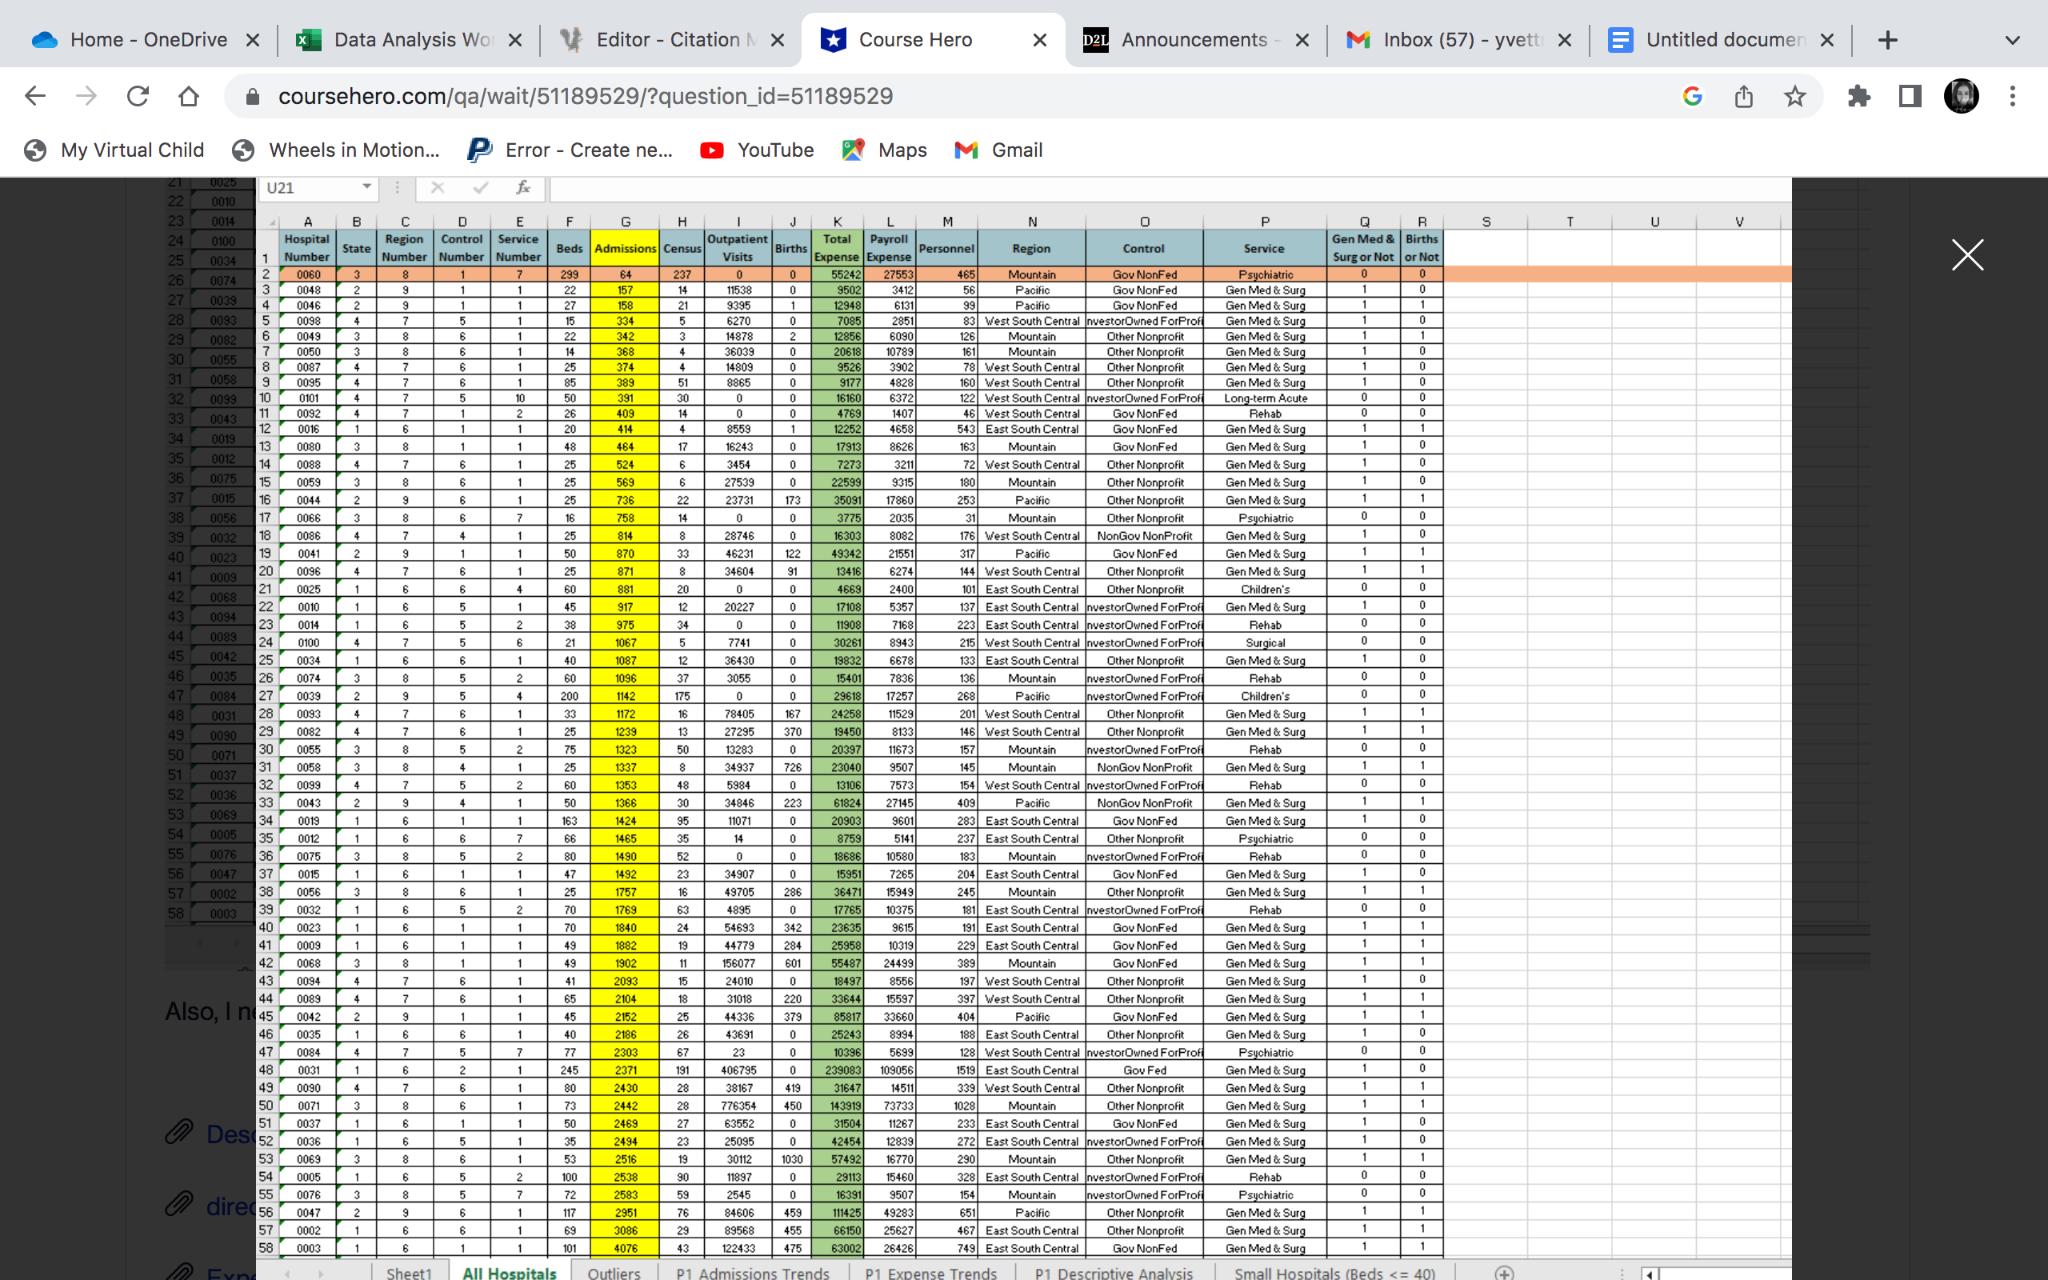
All Hospitals
Transcribed Image Text:
Home OneD X Data Analysis X Editor Citatic X Course Hero 42457906 (13 X D2L Announcemen M Inbox (57) - y\ X Untitled docut X My Virtual Child coursehero.com/qa/attachment/42457906/?_chid=5af26497-16f4-435e-88cc-3eea23ab2025 Wheels in Motion... P Error - Create ne... YouTube Maps M Gmail File Home Insert Draw Page Layout Formulas Data Review View Automate Help Power Pivot E10 X fx 284 A B D E F G H J K L M N 0 Q R T U v W x Y 2 Beds dmissionCensu 1 Outpati Birt Total ent hs Expe Pagr oll Personnel 2 247 11801 144 120979 3 29 89568 1111 455 147587 53436 947 Beds Admissia Census Outpatient Visits Births Total Expense Payroll Expe Personnel 66150 25427 467 mean 159.693069 4 101 4076 43 122433 475 63002 26426 749 median 5 236 7342 113 196025 534 104601 42704 968 standard deviation 80 182.113357 100 2538 90 11897 0 29113 15460 323 range 1048 7 297 14081 227 105526 266 203360 79182 1459 8 328 15057 230 128566 3 1062 71339 931 449155 10 49 1882 19 1074 210436 4087 121151 284 2595 68238 1089 448379 7525 10219 229 Beds Admissions Outpatient Visits Births 11 917 12 20227 0 17105 5357 137 12 115 6558 64 91950 751 93554 35401 Mean 159.633069 Mean 13 66 1465 35 $759 5141 237 Standard Error 18.1203563 Standard Erron 14 139 11294 144 145620 1223 171197 59085 1247 Median 80 Median 6832.043505 1005.317442 2494 Mean Standard Error Medion 103120.5248 14354.33643 52463 15 38 11908 7169 223 Mode 25 Mode #N/A 16 47 1492 23 34907 15951 7265 204 Standard Deviation 182.113357 Standard Deviation 17 414 8559 18 206 13392 195 77055 1216 12252 230442 53020 4658 543 Sample Variance 33165.2749 992 Kurtosis 7.67728905 19 250 5911 99 61469 79955 24234 690 Skewness 2.46185332 163 1424 11071 21 90 4473 52 22 150 9601 102 23 876 42317 571 136322 101608 749246 24 70 1940 24 54692 25 7221 88 75454 9601 20903 326 58315 21382 696 141010 46399 5161 734465 294038 342 23635 9615 759 83411 233 Range 398 Minimum 1048 14 Sample Variance Kurtosis Skewness Rangs Minimum 10103.31526 102076979.2 17.39358633 Mode Standard Deviation Sample Variance Mean Standard Error Medion Mode 709.039 118.2005 223 0 144259.2958 Standard Deviation 1187.9 20810744415 Kurtosis 3.537759671 Skewness 8.350192451 2.69952135 Sample Variance Kurtosis Skewness 1411107 5.557696 2.388936 71275 Range 776354 Rango 5602 918 Maximum 1062 Maximum 6355 Sum 16129 Sum 64 71339 690037 Minimum Minimum Maximum 776354 Maximum 5602 Sum 10415173 Sum 71619 191 Count 101 Count 101 Count Count 101 28799 26 60 881 20 4669 2400 101 27 349 14271 206 28 152 9637 132 141714 1664 161064 616 194730 67056 1594 132434 41923 129 6961 113 52463 193 9560 114 15839 31 387 251 244134 3370 793 158332 72559 98885 28869 365265 92770 1335 308 1830 32 245 2371 191 406795 239083 109056 1519 33 70 1764 63 4845 17765 10375 181 34 251 12383 165 148650 1332 167905 62421 1305 35 40 12 19832 6678 36 40 2186 43691 25243 8994 37 35 2494 25095 42454 12839 272 38 50 2469 63552 33 694 31544 461 440489 2244 31504 430129 11267 233 3735 40 200 175 29613 17257 268 41 217 5137 42 50 $70 33 314245 46231 1164 122 209350 $1309 998 49342 21551 45 2152 44336 44 1366 30 24846 379 223 05017 33660 404 61124 27145 409 45 25 736 23731 35091 17260 253 46 74 4415 42 82404 736 106524 42325 447 47 27 158 21 9345 12943 6131 99 48 117 2951 76 $4606 111425 49283 651 49 22 157 11538 9502 3412 56 50 22 342 " 14878 12856 6090 126 51 14 368 4 36039 20618 10789 152 243 1797 187 161416 3691 298690 123569 1671 53 110 4487 50 96982 597 130930 50750 674 54 267 13751 170 67590 155 212 12992 90839 1287 318500 117760 2877 1590 80582 56 75 1322 50 13203 20397 11673 157 57 25 1757 16 49705 286 3647 15949 245 58 100 9204 116 285162 690 224503 96512 1542 59 25 1331 34437 23040 9507 145 60 25 569 6 27534 22594 9315 161 299 64 237 55242 27553 465 162 100 4781 49 52973 442 51593 27515 367 63 268 12147 168 45444 394787 123267 3707 64 363 12 57 208 216121 0 626069 254026 3012 165 586 30222 403 66 134 699 70 472684 4708 888665 350540 73441 4265 167304 62244 955 67 758 14 3775 2035 68 72 47454 1039 49784 24466 416 69 1902 11 156071 70 2510 19 71 273 1612 194 20112 106656 1607 601 1030 55487 24499 389 57492 16770 290 232441 $4904 1445 172 2442 28 776354 450 142919 73723 1028 436 16414 216 144429 2537 247813 90143 74 262 11125 142 186694 187411 69626 1131 75 60 1096 3055 1540 7836 80 1490 52 10686 10580 182 77 72 2502 59 2545 16391 9507 154 78 591 3065 351 147874 419401 169728 73 161 7244 110 206776 137164 50660 978 80 479 23082 362 479254 1882 644405 212667 3710 81 4$ 464 17913 8626 163 82 406 16560 123 160321 3349 304891 116242 1615 83 25 1239 84 210 8039 27295 217940 370 19450 8133 146 740 153651 56900 1131 85 77 2303 67 23 10396 5699 128 Sheet1 All Hospitals Outliers P1 Admissions Trends P1 Expense Trends P1_Descriptive Analysis Small Hospitals (Beds Home OneD X Data Analysis X Editor Citatic X Course Hero 42457906 (13 X D2L Announcemen M Inbox (57) - y\ X Untitled docut X My Virtual Child coursehero.com/qa/attachment/42457906/?_chid=5af26497-16f4-435e-88cc-3eea23ab2025 Wheels in Motion... P Error - Create ne... YouTube Maps M Gmail File Home Insert Draw Page Layout Formulas Data Review View Automate Help Power Pivot E10 X fx 284 A B D E F G H J K L M N 0 Q R T U v W x Y 2 Beds dmissionCensu 1 Outpati Birt Total ent hs Expe Pagr oll Personnel 2 247 11801 144 120979 3 29 89568 1111 455 147587 53436 947 Beds Admissia Census Outpatient Visits Births Total Expense Payroll Expe Personnel 66150 25427 467 mean 159.693069 4 101 4076 43 122433 475 63002 26426 749 median 5 236 7342 113 196025 534 104601 42704 968 standard deviation 80 182.113357 100 2538 90 11897 0 29113 15460 323 range 1048 7 297 14081 227 105526 266 203360 79182 1459 8 328 15057 230 128566 3 1062 71339 931 449155 10 49 1882 19 1074 210436 4087 121151 284 2595 68238 1089 448379 7525 10219 229 Beds Admissions Outpatient Visits Births 11 917 12 20227 0 17105 5357 137 12 115 6558 64 91950 751 93554 35401 Mean 159.633069 Mean 13 66 1465 35 $759 5141 237 Standard Error 18.1203563 Standard Erron 14 139 11294 144 145620 1223 171197 59085 1247 Median 80 Median 6832.043505 1005.317442 2494 Mean Standard Error Medion 103120.5248 14354.33643 52463 15 38 11908 7169 223 Mode 25 Mode #N/A 16 47 1492 23 34907 15951 7265 204 Standard Deviation 182.113357 Standard Deviation 17 414 8559 18 206 13392 195 77055 1216 12252 230442 53020 4658 543 Sample Variance 33165.2749 992 Kurtosis 7.67728905 19 250 5911 99 61469 79955 24234 690 Skewness 2.46185332 163 1424 11071 21 90 4473 52 22 150 9601 102 23 876 42317 571 136322 101608 749246 24 70 1940 24 54692 25 7221 88 75454 9601 20903 326 58315 21382 696 141010 46399 5161 734465 294038 342 23635 9615 759 83411 233 Range 398 Minimum 1048 14 Sample Variance Kurtosis Skewness Rangs Minimum 10103.31526 102076979.2 17.39358633 Mode Standard Deviation Sample Variance Mean Standard Error Medion Mode 709.039 118.2005 223 0 144259.2958 Standard Deviation 1187.9 20810744415 Kurtosis 3.537759671 Skewness 8.350192451 2.69952135 Sample Variance Kurtosis Skewness 1411107 5.557696 2.388936 71275 Range 776354 Rango 5602 918 Maximum 1062 Maximum 6355 Sum 16129 Sum 64 71339 690037 Minimum Minimum Maximum 776354 Maximum 5602 Sum 10415173 Sum 71619 191 Count 101 Count 101 Count Count 101 28799 26 60 881 20 4669 2400 101 27 349 14271 206 28 152 9637 132 141714 1664 161064 616 194730 67056 1594 132434 41923 129 6961 113 52463 193 9560 114 15839 31 387 251 244134 3370 793 158332 72559 98885 28869 365265 92770 1335 308 1830 32 245 2371 191 406795 239083 109056 1519 33 70 1764 63 4845 17765 10375 181 34 251 12383 165 148650 1332 167905 62421 1305 35 40 12 19832 6678 36 40 2186 43691 25243 8994 37 35 2494 25095 42454 12839 272 38 50 2469 63552 33 694 31544 461 440489 2244 31504 430129 11267 233 3735 40 200 175 29613 17257 268 41 217 5137 42 50 $70 33 314245 46231 1164 122 209350 $1309 998 49342 21551 45 2152 44336 44 1366 30 24846 379 223 05017 33660 404 61124 27145 409 45 25 736 23731 35091 17260 253 46 74 4415 42 82404 736 106524 42325 447 47 27 158 21 9345 12943 6131 99 48 117 2951 76 $4606 111425 49283 651 49 22 157 11538 9502 3412 56 50 22 342 " 14878 12856 6090 126 51 14 368 4 36039 20618 10789 152 243 1797 187 161416 3691 298690 123569 1671 53 110 4487 50 96982 597 130930 50750 674 54 267 13751 170 67590 155 212 12992 90839 1287 318500 117760 2877 1590 80582 56 75 1322 50 13203 20397 11673 157 57 25 1757 16 49705 286 3647 15949 245 58 100 9204 116 285162 690 224503 96512 1542 59 25 1331 34437 23040 9507 145 60 25 569 6 27534 22594 9315 161 299 64 237 55242 27553 465 162 100 4781 49 52973 442 51593 27515 367 63 268 12147 168 45444 394787 123267 3707 64 363 12 57 208 216121 0 626069 254026 3012 165 586 30222 403 66 134 699 70 472684 4708 888665 350540 73441 4265 167304 62244 955 67 758 14 3775 2035 68 72 47454 1039 49784 24466 416 69 1902 11 156071 70 2510 19 71 273 1612 194 20112 106656 1607 601 1030 55487 24499 389 57492 16770 290 232441 $4904 1445 172 2442 28 776354 450 142919 73723 1028 436 16414 216 144429 2537 247813 90143 74 262 11125 142 186694 187411 69626 1131 75 60 1096 3055 1540 7836 80 1490 52 10686 10580 182 77 72 2502 59 2545 16391 9507 154 78 591 3065 351 147874 419401 169728 73 161 7244 110 206776 137164 50660 978 80 479 23082 362 479254 1882 644405 212667 3710 81 4$ 464 17913 8626 163 82 406 16560 123 160321 3349 304891 116242 1615 83 25 1239 84 210 8039 27295 217940 370 19450 8133 146 740 153651 56900 1131 85 77 2303 67 23 10396 5699 128 Sheet1 All Hospitals Outliers P1 Admissions Trends P1 Expense Trends P1_Descriptive Analysis Small Hospitals (Beds
Expert Answer:

Related Book For 

Stats Data and Models
ISBN: 978-0321986498
4th edition
Authors: Richard D. De Veaux, Paul D. Velleman, David E. Bock
Posted Date:
Students also viewed these marketing questions
-
TranscribedText: Account Receivables Accounts Payable Sales Revenue Raw Materials Salaries and Wages Payable Cost of Goods Sold Work In Process Salaries and Wages Expense Finished Goods Advertising...
-
Go to the 2013 annual report for Kelloggs Company at http://investor.kelloggs.com/investor-relations/annual-reports. What is the cost of finished goods inventory for 2013 as shown in note 17?
-
What is an integrity constraint? When does a database have integrity?
-
Equation 14.34 indicates that a red (blue) shift occurs when a source and observer are receding (approaching) with respect to one another in purely radial motion (i.e., β = β,). Show that,...
-
On January 7, Red Tucker, Inc., paid $254,700 for equipment used in manufacturing automotive supplies. In addition to the basic purchase price, the company paid $500 transportation charges, $300...
-
Only one firm produces and sells soccer balls in the country of Wiknam, and as the story begins, international trade in soccer balls is prohibited. The following equations describe the monopolists...
-
Compare the application of a DC and an AC motor for two contrasting modern electrical installations. To achieve this you must research and investigate two sufficiently complex and contrasting...
-
Which is most effective for organizational stakeholders: internal self-regulation or government regulation? Explain your answer.
-
Selected current year-end financial statements of Cabot Corporation follow. (All sales were on credit; selected balance sheet amounts at December 31 of the prior year were inventory, $50,900; total...
-
Great Boots Company sells rock climbing equipment. On February 28, Great Boots had the following accounts and balances: Bonds payable $180,000 Discount on bonds payable 19,000 On that day, Great...
-
Robo Advisors and the Future of Technology in Personal Finance Since their introduction in 2006, Robo advisors have been an increasing presence in the world of financial services. Companies like...
-
A company has a marketing budget of $100,000 and wants to allocate it across different marketing channels. They want to spend 40% on online advertising, 30% on social media marketing, and the...
-
You are going to loan money to your brother-in-law. He is borrowing $1000 for six months. You have learned that the value of money may go down and buy less in the future. You decide to charge your...
-
If you want to have $3,575 in 29 months, how much money must you put in a savings account today? Assume that the savings account pays 12% and it is compounded monthly; round to nearest $1.
-
Determine the annual percentage yield for a loan that charges a monthly interest rate of 1.5% and compounds the interest monthly.
-
The adjusted trial balance of Marshall Ltd. at December 31, 2020. Requirements 1. Prepare Marshall Ltd.'s 2020 income statement, statement of retained earnings, and balance sheet. List expenses...
-
Fred's Catering Ltd. had the following selected transactions during May 2020: Requirements 1. Show how each transaction would be handled using the cash basis and the accrual basis, Under each column,...
-
The balance sheet at December 31, 2018, 2019) and 2020 and income statement for the years ended December 31, 2018, 2019, and 2020 for Ojibway Inc. include the following data: Requirements Use the...

Study smarter with the SolutionInn App