

Figure 2-11 shows the daylight hours during the course of the year for the equator, 30...
Fantastic news! We've Found the answer you've been seeking!
Question:
Transcribed Image Text:
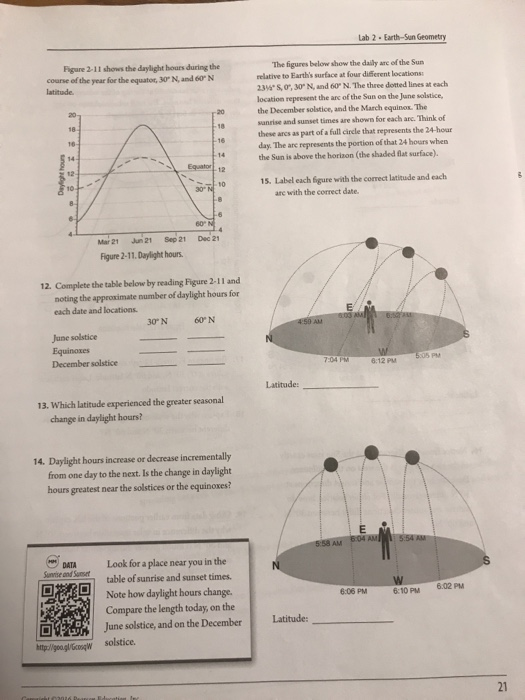
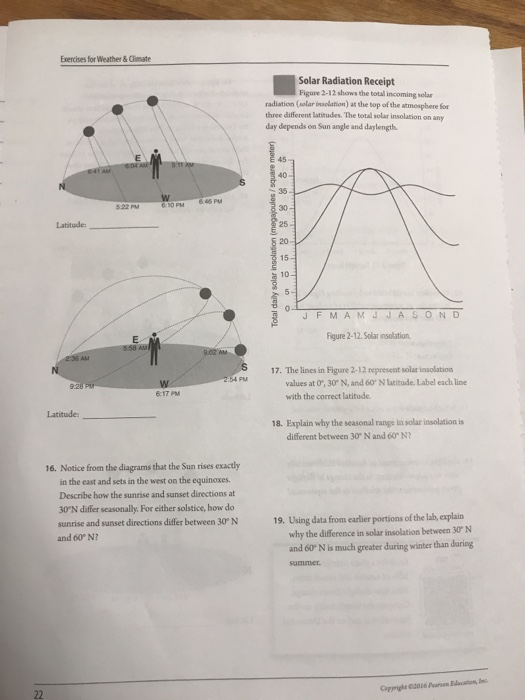
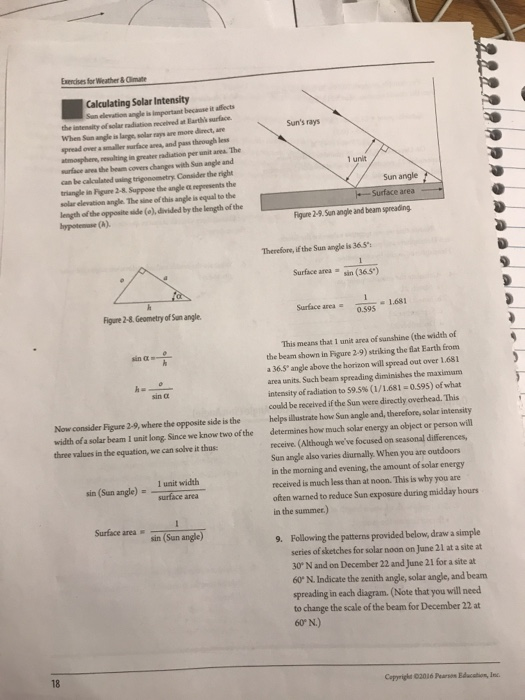
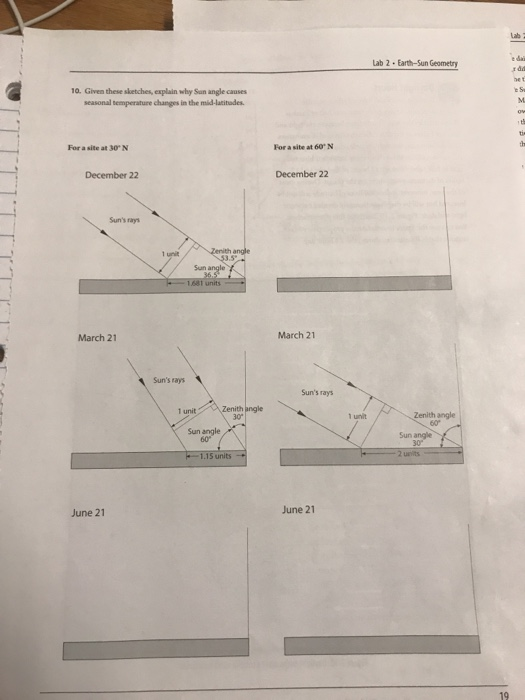
Figure 2-11 shows the daylight hours during the course of the year for the equator, 30° N, and 60° N latitude. Daylight hours 822222 20- 18- 16- Ⓡ 14- 12 8 June solstice Equinoxes December solstice Mar 21 Jun 21 Sep 21 Figure 2-11. Daylight hours. DATA Sunrise and Sunset http://goo.gl/GcosqW 12. Complete the table below by reading Figure 2-11 and noting the approximate number of daylight hours for each date and locations. 02016 B -14 Equator 12 10 30° N -18 -16 30 N Edu -8 13. Which latitude experienced the greater seasonal change in daylight hours? -6 14. Daylight hours increase or decrease incrementally from one day to the next. Is the change in daylight hours greatest near the solstices or the equinoxes? 60° N Dec 21 60° N Look for a place near you in the table of sunrise and sunset times. Note how daylight hours change. Compare the length today, on the June solstice, and on the December solstice. Lab 2. Earth-Sun Geometry The figures below show the daily arc of the Sun relative to Earth's surface at four different locations: 234 S, 0, 30° N, and 60° N. The three dotted lines at each location represent the arc of the Sun on the June solstice, the December solstice, and the March equinox. The sunrise and sunset times are shown for each arc. Think of these arcs as part of a full circle that represents the 24-hour day. The arc represents the portion of that 24 hours when the Sun is above the horizon (the shaded flat surface). 15. Label each figure with the correct latitude and each are with the correct date. 4:50 AM Latitude: N Latitude: 6:03 AM 7:04 PM 6:12 PM 6:06 PM 5:05 PM E 5:58 AM 6:04 AM 5:54 AM 6:10 PM 6:02 PM S 21 22 Exercises for Weather & Climate Latitude: 6:41 AM 2:36 AM 9:28 PM Latitude: 6:04 AM 5:22 PM E 5:58 AM W 6:10 PM W 6:17 PM 6:46 PM 9:02 AM 'S 2:54 PM 16. Notice from the diagrams that the Sun rises exactly in the east and sets in the west on the equinoxes. Describe how the sunrise and sunset directions at 30°N differ seasonally. For either solstice, how do sunrise and sunset directions differ between 30° N and 60° N? Solar Radiation Receipt Figure 2-12 shows the total incoming solar radiation (solar insolation) at the top of the atmosphere for three different latitudes. The total solar insolation on any day depends on Sun angle and daylength. Total daily solar insolation (megajoules/square meter) O 8 8 8 8 8 45 40 35 30- 25- 20- 15- 10- 5- 0 JFMAMJJASOND Figure 2-12. Solar insolation. 17. The lines in Figure 2-12 represent solar insolation values at 0, 30° N, and 60° N latitude. Label each line with the correct latitude. 18. Explain why the seasonal range in solar insolation is different between 30° N and 60° N 19. Using data from earlier portions of the lab, explain why the difference in solar insolation between 30° N and 60° N is much greater during winter than during summer. Copyright 2016 Pearson Education, Inc. Exercises for Weather & Climate Calculating Solar Intensity Sun elevation angle is important because it affects the intensity of solar radiation received at Earth's surface. When Sun angle is large, solar rays are more direct, are spread over a smaller surface area, and pass through less atmosphere, resulting in greater radiation per unit area. The surface area the beam covers changes with Sun angle and can be calculated using trigonometry. Consider the right triangle in Figure 2-8. Suppose the angle a represents the solar elevation angle. The sine of this angle is equal to the length of the opposite side (e), divided by the length of the hypotemuse (A). 18 h Figure 2-8. Geometry of Sun angle. sin t h= Now consider Figure 2-9, where the opposite side is the width of a solar beam 1 unit long. Since we know two of the three values in the equation, we can solve it thus: sin (Sun angle) = sin c Surface area 1 unit width surface area 1 sin (Sun angle) Sun's rays 1 unit Sun angle -Surface area Figure 2-9. Sun angle and beam spreading. Therefore, if the Sun angle is 36.5": 1 sin (36.5") Surface area Surface area 122 1 0.595 -1.681 This means that 1 unit area of sunshine (the width of the beam shown in Figure 2-9) striking the flat Earth from a 36.5° angle above the horizon will spread out over 1.681 area units. Such beam spreading diminishes the maximum intensity of radiation to 59.5 % (1/1.681-0.595) of what could be received if the Sun were directly overhead. This helps illustrate how Sun angle and, therefore, solar intensity determines how much solar energy an object or person will receive. (Although we've focused on seasonal differences, Sun angle also varies diurnally. When you are outdoors in the morning and evening, the amount of solar energy received is much less than at noon. This is why you are often warned to reduce Sun exposure during midday hours in the summer.) 9. Following the patterns provided below, draw a simple series of sketches for solar noon on June 21 at a site at 30° N and on December 22 and June 21 for a site at 60° N. Indicate the zenith angle, solar angle, and beam spreading in each diagram. (Note that you will need to change the scale of the beam for December 22 at 60° N.) Copyright ©2016 Pearson Education, Inc. 10. Given these sketches, explain why Sun angle causes seasonal temperature changes in the mid-latitudes. For a site at 30° N December 22 Sun's rays March 21 June 21 1 unit Sun's rays Zenith angle $3.5 Sun angle 36.5 1.681 units 1 unit) Zenith angle 30° Sun angle 60° -1.15 units For a site at 60' N December 22 March 21 Sun's rays June 21 1 unit Lab 2 Earth-Sun Geometry Zenith angle 60⁰ Sun angle 30⁰ 2 units 19 Lab e dai τὰς he t Sw M ow th tie the Figure 2-11 shows the daylight hours during the course of the year for the equator, 30° N, and 60° N latitude. Daylight hours 822222 20- 18- 16- Ⓡ 14- 12 8 June solstice Equinoxes December solstice Mar 21 Jun 21 Sep 21 Figure 2-11. Daylight hours. DATA Sunrise and Sunset http://goo.gl/GcosqW 12. Complete the table below by reading Figure 2-11 and noting the approximate number of daylight hours for each date and locations. 02016 B -14 Equator 12 10 30° N -18 -16 30 N Edu -8 13. Which latitude experienced the greater seasonal change in daylight hours? -6 14. Daylight hours increase or decrease incrementally from one day to the next. Is the change in daylight hours greatest near the solstices or the equinoxes? 60° N Dec 21 60° N Look for a place near you in the table of sunrise and sunset times. Note how daylight hours change. Compare the length today, on the June solstice, and on the December solstice. Lab 2. Earth-Sun Geometry The figures below show the daily arc of the Sun relative to Earth's surface at four different locations: 234 S, 0, 30° N, and 60° N. The three dotted lines at each location represent the arc of the Sun on the June solstice, the December solstice, and the March equinox. The sunrise and sunset times are shown for each arc. Think of these arcs as part of a full circle that represents the 24-hour day. The arc represents the portion of that 24 hours when the Sun is above the horizon (the shaded flat surface). 15. Label each figure with the correct latitude and each are with the correct date. 4:50 AM Latitude: N Latitude: 6:03 AM 7:04 PM 6:12 PM 6:06 PM 5:05 PM E 5:58 AM 6:04 AM 5:54 AM 6:10 PM 6:02 PM S 21 22 Exercises for Weather & Climate Latitude: 6:41 AM 2:36 AM 9:28 PM Latitude: 6:04 AM 5:22 PM E 5:58 AM W 6:10 PM W 6:17 PM 6:46 PM 9:02 AM 'S 2:54 PM 16. Notice from the diagrams that the Sun rises exactly in the east and sets in the west on the equinoxes. Describe how the sunrise and sunset directions at 30°N differ seasonally. For either solstice, how do sunrise and sunset directions differ between 30° N and 60° N? Solar Radiation Receipt Figure 2-12 shows the total incoming solar radiation (solar insolation) at the top of the atmosphere for three different latitudes. The total solar insolation on any day depends on Sun angle and daylength. Total daily solar insolation (megajoules/square meter) O 8 8 8 8 8 45 40 35 30- 25- 20- 15- 10- 5- 0 JFMAMJJASOND Figure 2-12. Solar insolation. 17. The lines in Figure 2-12 represent solar insolation values at 0, 30° N, and 60° N latitude. Label each line with the correct latitude. 18. Explain why the seasonal range in solar insolation is different between 30° N and 60° N 19. Using data from earlier portions of the lab, explain why the difference in solar insolation between 30° N and 60° N is much greater during winter than during summer. Copyright 2016 Pearson Education, Inc. Exercises for Weather & Climate Calculating Solar Intensity Sun elevation angle is important because it affects the intensity of solar radiation received at Earth's surface. When Sun angle is large, solar rays are more direct, are spread over a smaller surface area, and pass through less atmosphere, resulting in greater radiation per unit area. The surface area the beam covers changes with Sun angle and can be calculated using trigonometry. Consider the right triangle in Figure 2-8. Suppose the angle a represents the solar elevation angle. The sine of this angle is equal to the length of the opposite side (e), divided by the length of the hypotemuse (A). 18 h Figure 2-8. Geometry of Sun angle. sin t h= Now consider Figure 2-9, where the opposite side is the width of a solar beam 1 unit long. Since we know two of the three values in the equation, we can solve it thus: sin (Sun angle) = sin c Surface area 1 unit width surface area 1 sin (Sun angle) Sun's rays 1 unit Sun angle -Surface area Figure 2-9. Sun angle and beam spreading. Therefore, if the Sun angle is 36.5": 1 sin (36.5") Surface area Surface area 122 1 0.595 -1.681 This means that 1 unit area of sunshine (the width of the beam shown in Figure 2-9) striking the flat Earth from a 36.5° angle above the horizon will spread out over 1.681 area units. Such beam spreading diminishes the maximum intensity of radiation to 59.5 % (1/1.681-0.595) of what could be received if the Sun were directly overhead. This helps illustrate how Sun angle and, therefore, solar intensity determines how much solar energy an object or person will receive. (Although we've focused on seasonal differences, Sun angle also varies diurnally. When you are outdoors in the morning and evening, the amount of solar energy received is much less than at noon. This is why you are often warned to reduce Sun exposure during midday hours in the summer.) 9. Following the patterns provided below, draw a simple series of sketches for solar noon on June 21 at a site at 30° N and on December 22 and June 21 for a site at 60° N. Indicate the zenith angle, solar angle, and beam spreading in each diagram. (Note that you will need to change the scale of the beam for December 22 at 60° N.) Copyright ©2016 Pearson Education, Inc. 10. Given these sketches, explain why Sun angle causes seasonal temperature changes in the mid-latitudes. For a site at 30° N December 22 Sun's rays March 21 June 21 1 unit Sun's rays Zenith angle $3.5 Sun angle 36.5 1.681 units 1 unit) Zenith angle 30° Sun angle 60° -1.15 units For a site at 60' N December 22 March 21 Sun's rays June 21 1 unit Lab 2 Earth-Sun Geometry Zenith angle 60⁰ Sun angle 30⁰ 2 units 19 Lab e dai τὰς he t Sw M ow th tie the
Expert Answer:
Answer rating: 100% (QA)
Question 14 Daylight hours increase or decrease incrementally from one day to the next Is the change ... View the full answer

Related Book For 
Posted Date:
Students also viewed these law questions
-
Complete the table below by indicating whether the transactions or economic events would increase, decrease, or have no effect on the financial ratios in the period they occur. Assume the entity uses...
-
Complete the table below by indicating whether the transactions or economic events would increase, decrease, or have no effect on the financial ratios in the period they occur. Assume the entity uses...
-
Complete the table below by indicating whether the transactions or economic events would increase, decrease, or have no effect on the financial ratios listed in the period they occur in. Assume the...
-
One of Red Clay's employee handbook sections covers employee monitoring. An employee filed a complaint with the HR department stating he opposes this monitoring and chooses to opt out. What legal...
-
GRC currently manufactures and sells computer- controlled gear- cutting machines used by automobile companies to produce gears for car and truck transmissions and differentials. GRC has decided to...
-
Given the matrix \[\mathbf{C}(z)=\left[\begin{array}{cc}R_{0}(z) & R_{1}(z) \\z^{-1} R_{1}(z) & R_{0}(z)\end{array} ight]\] show that its inverse is pseudo-circulant.
-
Follow the steps below to prove the LLN without using CLT. (a) Let \(X\) be a random variable with mean \(\mu\) and variance \(\sigma^{2}\). Then for any real number \(\alpha>0,...
-
Two companies, Energen and Hastings Corporation, began operations with identical balance sheets. A year later, both required additional manufacturing capacity at a cost of $50,000. Energen obtained a...
-
Let G = (N,A) be an undirected graph. (a) Suppose the arcs of G have with nonnegative weights. Explain how you could modify Dijkstra's algorithm (not G) to find a shortest path from a designated node...
-
Show the contents in hexadecimal of registers PC, AR, DR, IR, and SC of the basic computer when an ISZ indirect instruction is fetched from memory and executed. The initial content of PC is 7FF. The...
-
Evaluate the function for the given value of x. f(x) = x + 6x, (ff)(3) =?
-
If requirements are easily understandable and defined, which of the following models is best suited? (a) Waterfall model (b) Prototyping model (c) Spiral model (d) None of these
-
What is contract-based modeling?
-
Which of the following are new introductions in UML 2? (a) Guards (b) Combined fragments (c) Interaction Occurrences (d) Frames
-
Waterfall model is not suitable for (a) Small projects (b) Accommodating change (c) Complex projects (d) None of these
-
Use the data in Table 9.2 to assign the Q branch lines in Figure 9.6. Account for the relative intensities. Figure 9.6 Table 9.2 Spectroscopic constants for diatomics in the ground electronic state...
-
A firm recently overhauled its capital structure by replacing debt with equity. Before the overhaul, it had 20% equity and 80% debt in its capital structure. Its equity beta was 1.8. After the...
-
3M Company reports the following financial statement amounts in its 10-K report: a. Compute the receivables, inventory, and PPE turnover ratios for both 2018 and 2017. (Receivables turnover and...
-
Graph the equation P = 2Q + 3. Is this the supply curve or demand curve?
-
Rank the following equations by the steepness of their slope from lowest to highest. a. y = -3x + 9 b. y = 4x + 2 c. y = -0.5x + 4
-
Many online subscription services have automatic renewal policies, in which they will automatically bill you for another years subscription when your current one runs out. Why is this default rule a...
-
Telemark-Kjemi AS manufactures an industrial solvent in two departments mixing and cooking. This question focuses on the Cooking Department. During June 2022, 90 tonnes of solvent were completed and...
-
Consider the following data for the satellite Assembly Division of Aro-France: Exercise4.11 Europe Electronics SNC manufactures microchips in large quantities. Each microchip undergoes assembly and...
-
Required Do Exercise4.20 using the FIFO method of process costing. Explain any difference between the cost of work completed and transferred out and cost of closing work in progress in the Assembly...

Study smarter with the SolutionInn App