

Financial History: (3-year analysis of the company's performance. Your report will include the ratio results plus an
Question:
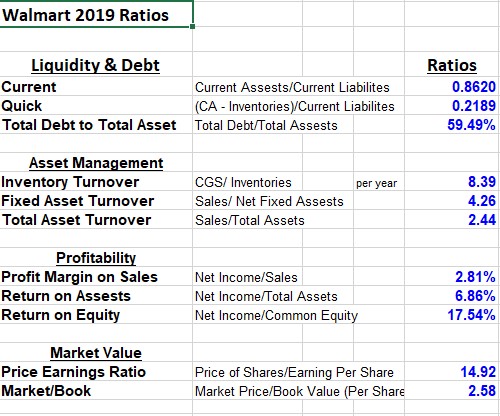
Financial History: (3-year analysis of the company's performance. Your report will include the ratio results plus an explanation and analysis of each ratio. (Liquidity and Debt, Asset Management, Profitability, and Market ratios. See ratio detail below.) Were there changes in the ratios? What could have caused the change? You must include an evaluation section of what each type of (LAPM) ratio means over the three years, then an overall comparison to validate your conclusion. (Show you understand and know the ratios.)
After each LAPM box you will include your words regarding the ratios in that box. Focus on demonstrating your understanding of what the individual ratio means and your assessment of Walmart's financial conditions based on the results. The paper should include an individual evaluation section for each ratio, over the three years, and an overall comparison to validate your conclusion of Walmart's financial condition.
| Liquidity & Debt | 2018 | 2017 | 2016 | |
| Current | Current Assets/Current Liabilities | 0.76% | 0.86% | 0.93% |
| Quick | (Current Assets - Inventories)/Current Liabilities | 0.20% | 0.22% | 0.24% |
| Total Debt to Total Asset | Total Debt/Total Assets | 0.60% | 0.59% | 0.58% |
| Asset Management | 2018 | 2017 | 2016 | |
| Inventory Turnover | CGS/Inventories | 8.53% | 8.39% | 8.12% |
| Fixed Asset Turnover | Sales/Net Fixed Assets | 3.94% | 4.09% | 3.77% |
| Total Asset Turnover | Sales/Total Assets | 2.46% | 2.42% | 2.37% |
| Profitability | 2018 | 2017 | 2016 | |
| Profit Margin on Sales | Net Income/Sales | 2.12% | 2.97% | 3.15% |
| Return on Assets | Net Income/Total Assets | 5.20% | 7.20% | 7.50% |
| Return on Equity | Net Income/Common Equity | 0.14% | 0.18% | 0.19% |
| Market Value | 2018 | 2017 | 2016 | |
| Price Earnings Ratio | Price of Shares/Earning per Share | 46.73% | 20.97% | 13.34% |
| Market/Book | Market Price/Book Value per share | 3.25% | 2.96% | 2.35%
|
Financials Today: Current year with comparison to a competitor. What are they doing? How are they doing now? Add current events and focus on the current financials. Include an evaluation for each type of (LAPM) ratio for the current year, then an overall comparison to validate your conclusion. Include your findings for your competitor.
Here you should include an individual evaluation section for each ratio with a reflection on this year's comparison to past years. Also, include a comparison to the results of the competitor you chose or the industry averages. Then, an overall comparison to validate your conclusion.
| Liquidity & Debt | 2019 | Competitor (Amazon) |
| Current | 0.80% | 1.10% |
| Quick | 0.23% | 0.86% |
| Total Debt to Total Asset | 0.64% | 0.38% |
Here you should include an individual evaluation section for each ratio with a reflection on this year's comparison to past years. Also, include a comparison to the results of the competitor you chose or the industry averages. Then, an overall comparison to validate your conclusion.
| Asset Management | 2019 | Competitor (Amazon) |
| Inventory Turnover | 8.70% | 12.83% |
| Fixed Asset Turnover | 3.39% | 3.51% |
| Total Asset Turnover | 2.33% | 1.45% |
Here you should include an individual evaluation section for each ratio with a reflection on this year's comparison to past years. Also, include a comparison to the results of the competitor you chose or the industry averages. Then, an overall comparison to validate your conclusion.
| Profitability | 2019 | Competitor (Amazon) |
| Profit Margin on Sales | 1.41% | 4.13% |
| Return on Assets | 3.27% | 5.84% |
| Return on Equity | 9.90% | 21.07% |
Here you should include an individual evaluation section for each ratio with a reflection on this year's comparison to past years. Also, include a comparison to the results of the competitor you chose or the industry averages. Then, an overall comparison to validate your conclusion.
Financial Future: The story behind your analysis of 5-year proforma forecast of the income statement for Walmart based on the spreadsheet. Your analysis will include why you chose the specific rate changes you did in your version of the spreadsheet. You will also provide an analysis of the impact your assumptions had on the value of Walmart.
Conclusion: In this section include your summary of your findings based on your complete analysis plus your analysis, with justification, of how much you think Walmart's stock is worth today. Defend your analysis contrasting it to the actual price of Walmart's stock today, and make a recommendation as to whether investors should or should not buy Walmart stock. Defend that recommendation.
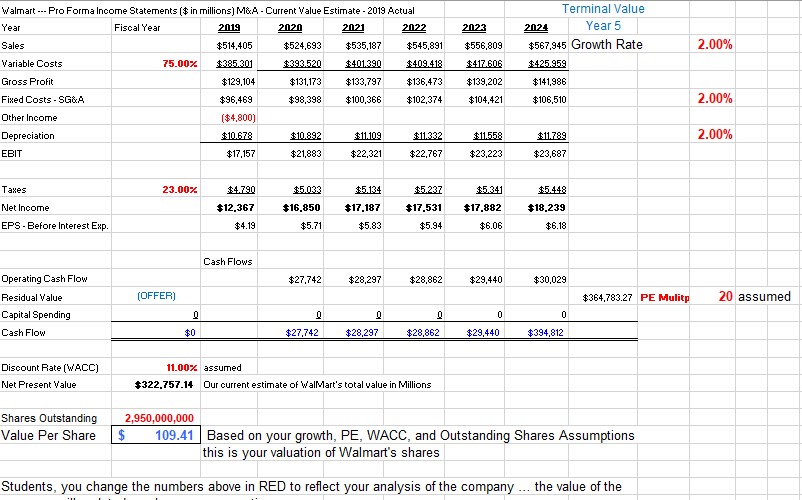
The numbers highlighted in red will need to be changed to reflect your analysis of the company
Expert Answer:


Financial Reporting Financial Statement Analysis and Valuation a strategic perspective
ISBN: 978-1337614689
9th edition
Authors: James M. Wahlen, Stephen P. Baginski, Mark Bradshaw
