

Suppose that the market for black sweaters is a competitive market. The following graph shows the daily
Fantastic news! We've Found the answer you've been seeking!
Question:
Suppose that the market for black sweaters is a competitive market. The following graph shows the daily cost curves of a firm operating in this market.
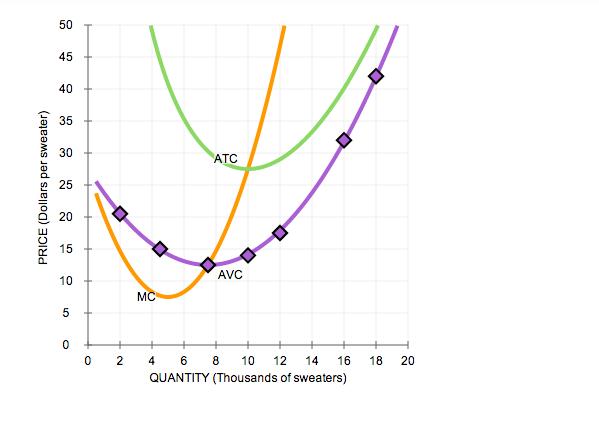
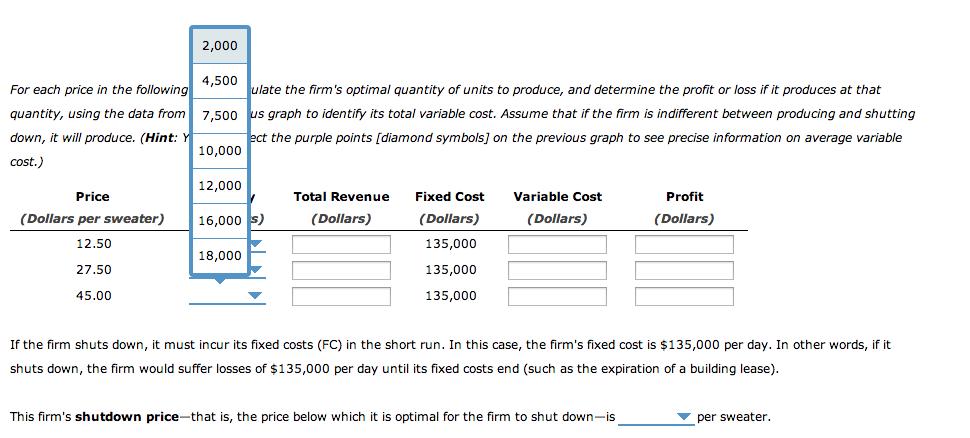
For each price in the following table, calculate the firm's optimal quantity of units to produce, and determine the profit or loss if it produces at that quantity, using the data from the previous graph to identify its total variable cost. Assume that if the firm is indifferent between producing and shutting down, it will produce. (Hint: You can select the purple points [diamond symbols] on the previous graph to see precise information on average variable cost.)
Expert Answer:

Related Book For 

Posted Date:
