

For the conditional probability of left-right by gender in Switzerland, we initially recoded Irscale so that...
Fantastic news! We've Found the answer you've been seeking!
Question:
Transcribed Image Text:
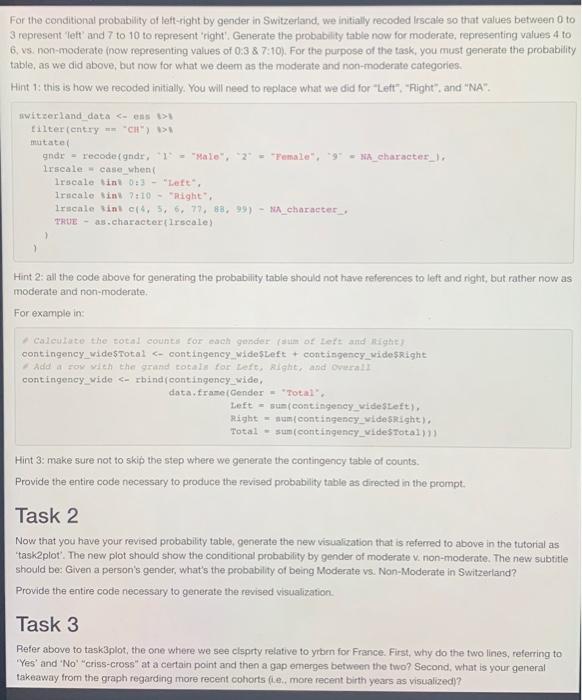
For the conditional probability of left-right by gender in Switzerland, we initially recoded Irscale so that values between 0 to 3 represent "left' and 7 to 10 to represent 'right'. Generate the probability table now for moderate, representing values 4 to 6, vs. non-moderate (now representing values of 0:3 & 7:10), For the purpose of the task, you must generate the probability table, as we did above, but now for what we deem as the moderate and non-moderate categories. Hint 1: this is how we recoded initially. You will need to replace what we did for "Left", "Right", and "NA". switzerland data <- es >1 filter (entry "CH") > mutate( gndr 1rscale recode(gndr, "I "Male", case when() (1) "Female", 1rscale sint 0:3 "Left", irscale sins 7:10 "Right", irscale sins c(4, 5, 6, 77, 88, 99) NA character, TRUE as.character(Irscale) -NA_character_), Hint 2: all the code above for generating the probability table should not have references to left and right, but rather now as moderate and non-moderate. For example in: data.frame(Gender Calculate the total counts for each gender (sum of Left and Right) contingency_wide$Total <- contingency wide$Left + contingency wide Right Add a zov with the grand totals for Left, Right, and overall contingency vide <- rbind(contingency wide, Total", sum(contingency vide$Left), Left Right sum(contingency_videsRight), Totalsum (contingency vide$Total))) Hint 3: make sure not to skip the step where we generate the contingency table of counts. Provide the entire code necessary to produce the revised probability table as directed in the prompt. Task 2 Now that you have your revised probability table, generate the new visualization that is referred to above in the tutorial as task2plot'. The new plot should show the conditional probability by gender of moderate v. non-moderate. The new subtitle should be: Given a person's gender, what's the probability of being Moderate vs. Non-Moderate in Switzerland? Provide the entire code necessary to generate the revised visualization. Task 3 Refer above to task3plot, the one where we see clsprty relative to yrben for France. First, why do the two lines, referring to 'Yes' and 'No' "criss-cross" at a certain point and then a gap emerges between the two? Second, what is your general takeaway from the graph regarding more recent cohorts (e., more recent birth years as visualized)? For the conditional probability of left-right by gender in Switzerland, we initially recoded Irscale so that values between 0 to 3 represent "left' and 7 to 10 to represent 'right'. Generate the probability table now for moderate, representing values 4 to 6, vs. non-moderate (now representing values of 0:3 & 7:10), For the purpose of the task, you must generate the probability table, as we did above, but now for what we deem as the moderate and non-moderate categories. Hint 1: this is how we recoded initially. You will need to replace what we did for "Left", "Right", and "NA". switzerland data <- es >1 filter (entry "CH") > mutate( gndr 1rscale recode(gndr, "I "Male", case when() (1) "Female", 1rscale sint 0:3 "Left", irscale sins 7:10 "Right", irscale sins c(4, 5, 6, 77, 88, 99) NA character, TRUE as.character(Irscale) -NA_character_), Hint 2: all the code above for generating the probability table should not have references to left and right, but rather now as moderate and non-moderate. For example in: data.frame(Gender Calculate the total counts for each gender (sum of Left and Right) contingency_wide$Total <- contingency wide$Left + contingency wide Right Add a zov with the grand totals for Left, Right, and overall contingency vide <- rbind(contingency wide, Total", sum(contingency vide$Left), Left Right sum(contingency_videsRight), Totalsum (contingency vide$Total))) Hint 3: make sure not to skip the step where we generate the contingency table of counts. Provide the entire code necessary to produce the revised probability table as directed in the prompt. Task 2 Now that you have your revised probability table, generate the new visualization that is referred to above in the tutorial as task2plot'. The new plot should show the conditional probability by gender of moderate v. non-moderate. The new subtitle should be: Given a person's gender, what's the probability of being Moderate vs. Non-Moderate in Switzerland? Provide the entire code necessary to generate the revised visualization. Task 3 Refer above to task3plot, the one where we see clsprty relative to yrben for France. First, why do the two lines, referring to 'Yes' and 'No' "criss-cross" at a certain point and then a gap emerges between the two? Second, what is your general takeaway from the graph regarding more recent cohorts (e., more recent birth years as visualized)?
Expert Answer:

Related Book For 

Income Tax Fundamentals 2013
ISBN: 9781285586618
31st Edition
Authors: Gerald E. Whittenburg, Martha Altus Buller, Steven L Gill
Posted Date:
Students also viewed these programming questions
-
Writea 950-word paper in which you analyze Albert Bandura cognitive theories. Address the following items: Discuss the contributions that Albert Banduramade to the field of learning and cognition....
-
Explain the cash flow matching approach to portfolio management. Explain the key issues with using a cash flow matching portfolio management approach. Identify and explain some alternative approaches...
-
For the conditional probability of left-right by gender in Switzerland, we initially recoded Irscale so that values between 0 to 3 represent 'left' and 7 to 10 to represent 'right'. Generate the...
-
Kenny operates a store, where he sells feed and other supplies to farmers. Heather purchases a $20,000 tractor from Kenny and pays Kenny with $18,000 in cash and $2,000 in corn. How much gross income...
-
Infrared absorption by I H81 12 Br gives rise to an R branch from v = O. What is the wave number of the line originating from the rotational state with J = 2? Use the information in Table 13.2.
-
For the network of Fig. 5.152: a. Calculate IB, IC, and re b. Determine Zi and Zo c. Calculate Av. d. Determine the effect of ro = 30 Ω on Av, 10 V 4.3 k2 Zo B- 100 2, +10 V
-
Water in a rectangular channel flows into a gradual contraction section as is indicated in Fig. P10.17. If the flowrate is \(Q=25\) \(\mathrm{ft}^{3} / \mathrm{s}\) and the upstream depth is...
-
A refinery blends four petroleum components into three grades of gasolineregular, premium, and diesel. The maximum quantities available of each component and the cost per barrel are as follows: To...
-
Question 1. From the research for this terms Crisis Management Team Assignment - Taylor swift and Ticket Master Crisis a. Explaining, with some detail, three (3) specific things that the leader(s) in...
-
Formulate a linear program which can be used to generate a comprehensive plan for the whole Far Eastern operations. Clearly define every variable used in your formulation. Start your report with an...
-
Mickey Company reported the following figures: 2021 2020 RM572,000 RM600,000 Net Credit Sales Account receivables at end of year RM38,700 RM46,100 Required: 1) Compute Mickey's collection period of...
-
General plc has recently implemented a system of standard costing. It now has the actual results for the first month of the system's operation to compare with its standard figures. Standard costs:...
-
Javed is a writer who works from home and he lives next door to Tommen who is a drrummer in a local band. tommen needs to practice to earn his share of the band's pofits which is $300. Javed is...
-
On January 1, Year 6, Kiri Company signed a six-month, non-interest-bearing note payable for $170,000 and received $162,800 from Year 6, what amount should Kiri record for interest expense, and what...
-
A corporation had $24,000 of cash at the beginning of the year. During the year, it had sales on account of $21,000 and cash receipts of $25,000 during the year. At the end of the year, it had...
-
WINDON COMPANT Comparative Balance Sheet December 31, Assets 2020 2019 Cash $29,000 $45,000 Short-term investments 30,000 63,000 Accounts receivable (net) 40,300 31,800 Inventory 60,900 70,700...
-
Write a shell script to find the largest among the 3 given numbers.
-
XYZ Inc. a calendar year, accrual basis corporation, had the following items during 2021: Gross revenue from operations Cost of goods sold $420,000 ($180,000) $9,000 LT capital gain .LT capital...
-
Abigail (Abby) Boxer is a single mother working as a civilian accountant for the U.S. Army. Her Social Security number is 676-73-3311 and she lives at 3456 Alamo Way, San Antonio, TX 78249. Helen,...
-
The following additional information is available for the Dr. Ivan and Irene Incisor family from Chapters 1-5. Ivan's grandfather died and left a portfolio of municipal bonds. In 2012, they pay Ivan...
-
Jim is fired from his job as a waiter and decides to take an extended trip to Europe. After touring Europe for 3 months, Jim returns to look for a new job as a waiter. Are his job-hunting expenses...
-
Many factors affect the economics of sport. What are some not discussed in the chapter? How do they affect financial management within the industry?
-
What is financial management? How does financial management differ in the sport industry as compared to other industries?
-
Which has the greater impact on financial management: the structure of a league or the structure of a team?

Study smarter with the SolutionInn App