

The Martin-Beck Company operates a plant in St. Louis with an annual capacity of 30,000 units....
Fantastic news! We've Found the answer you've been seeking!
Question:

Transcribed Image Text:
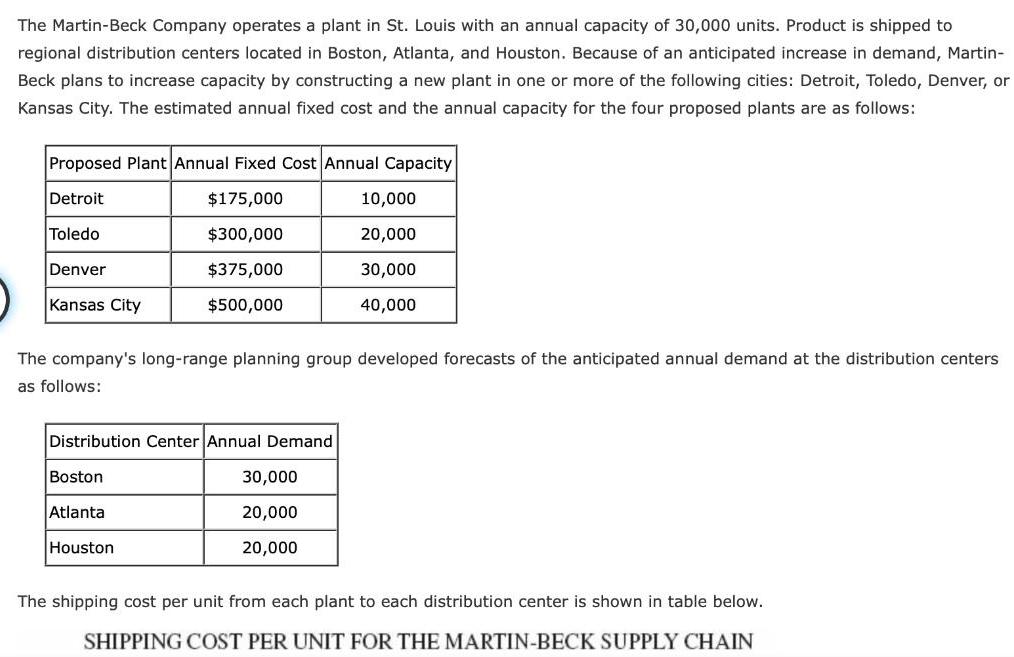
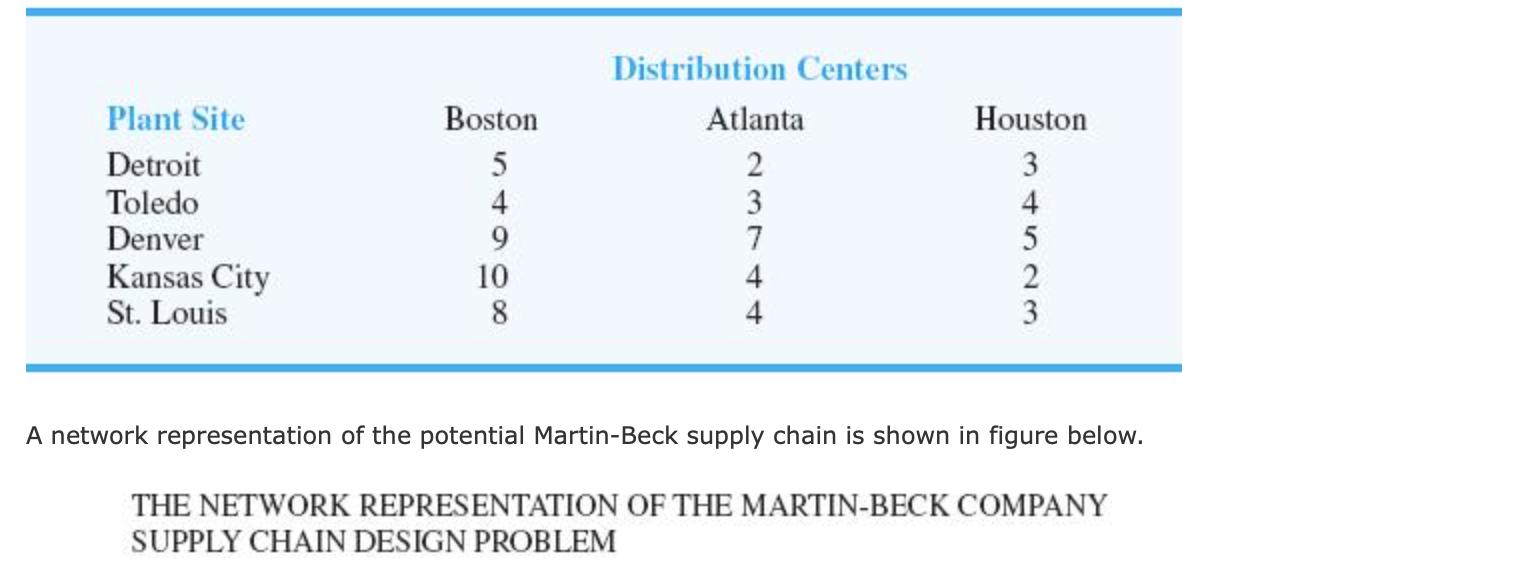
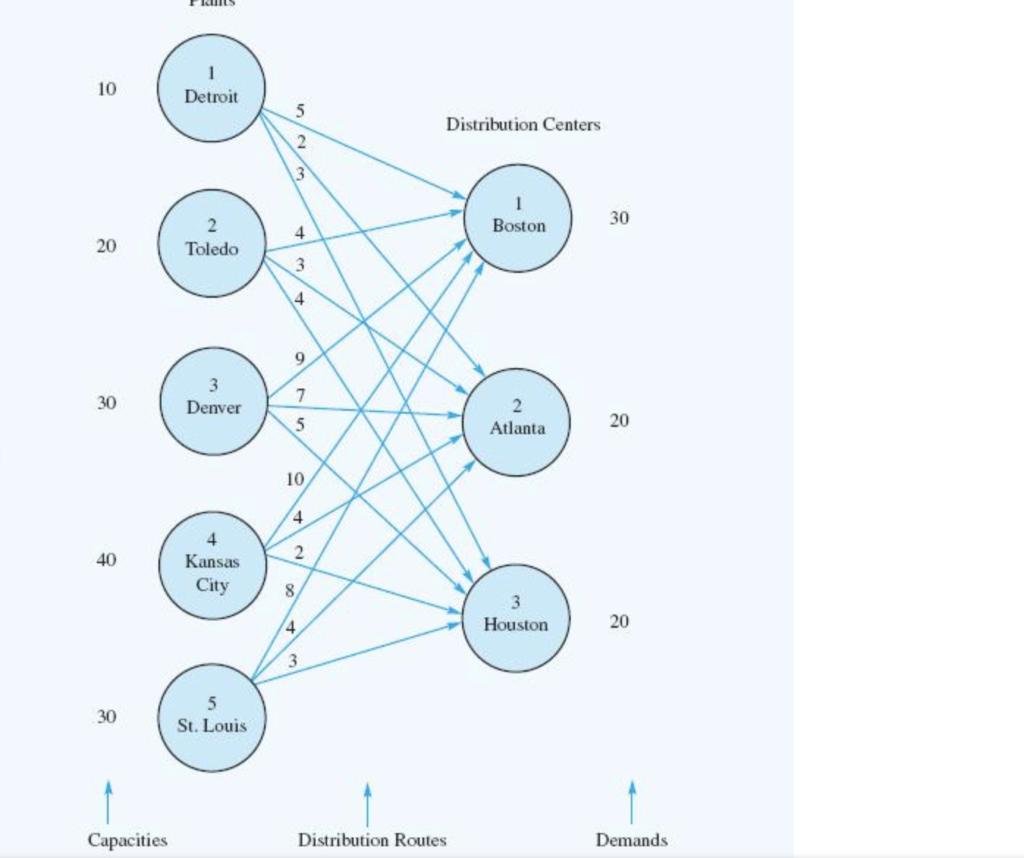
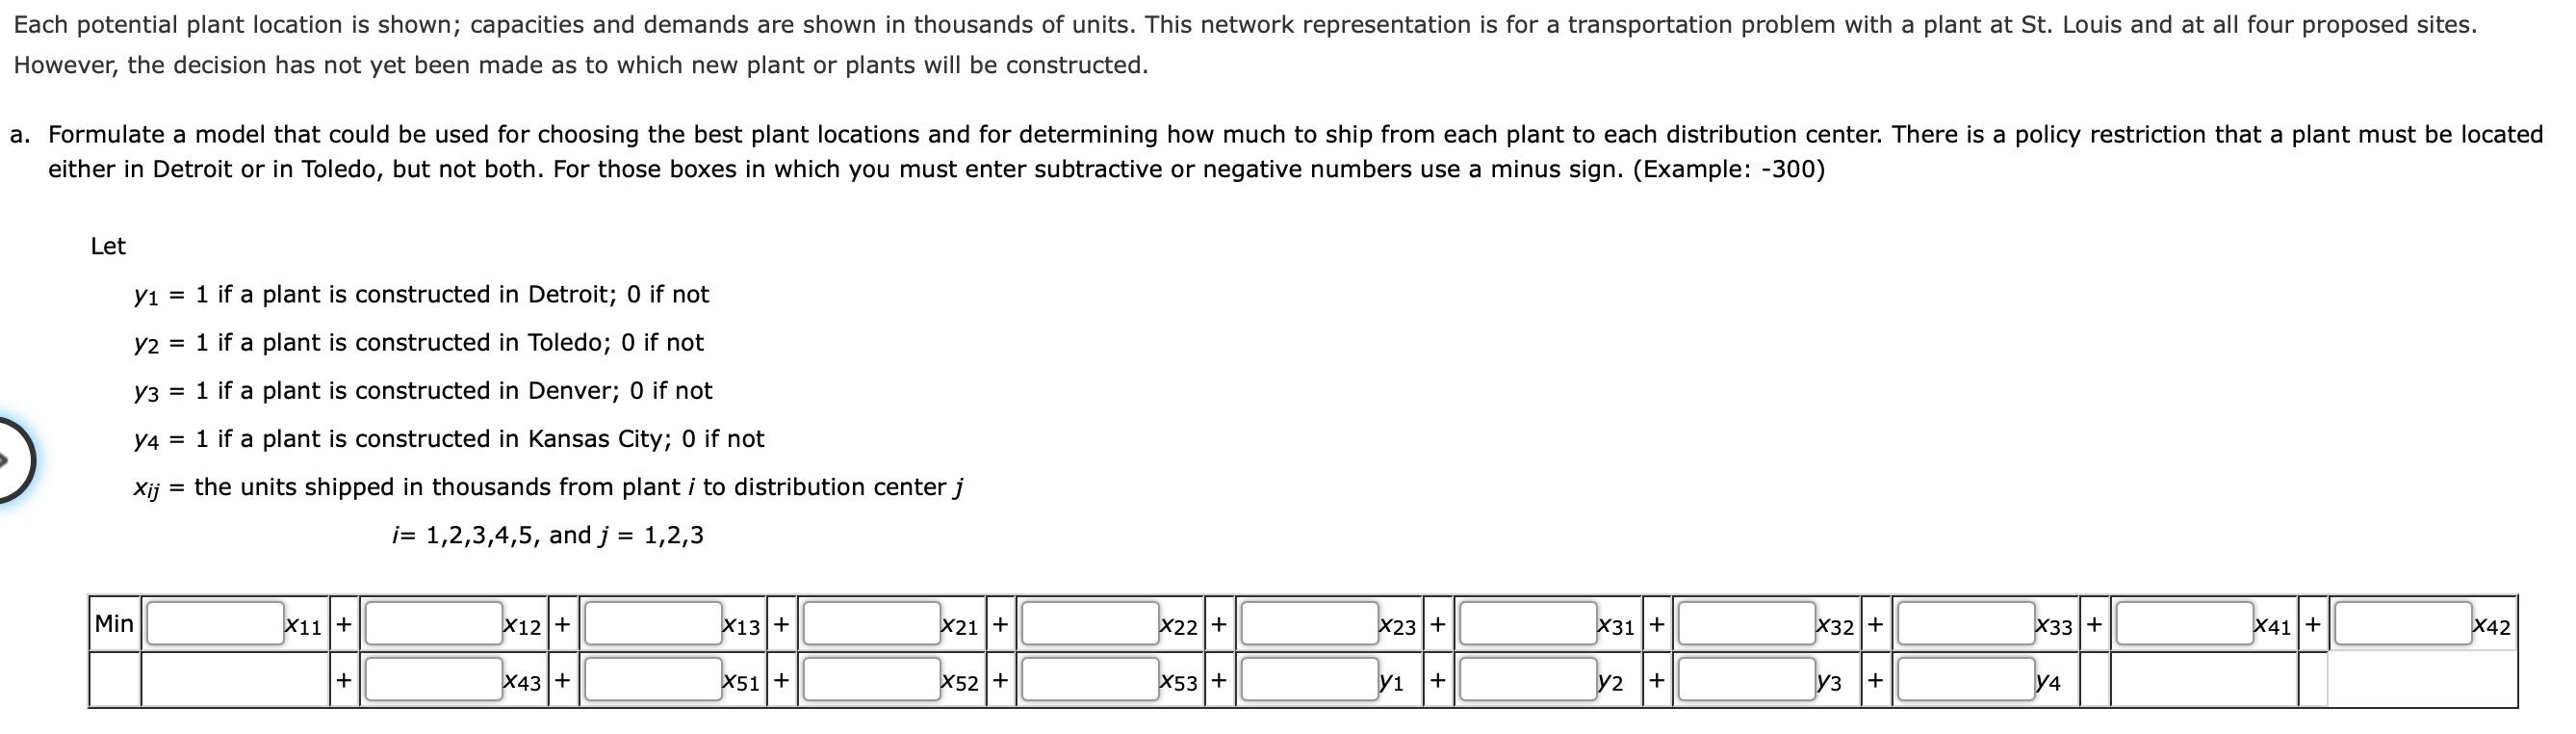
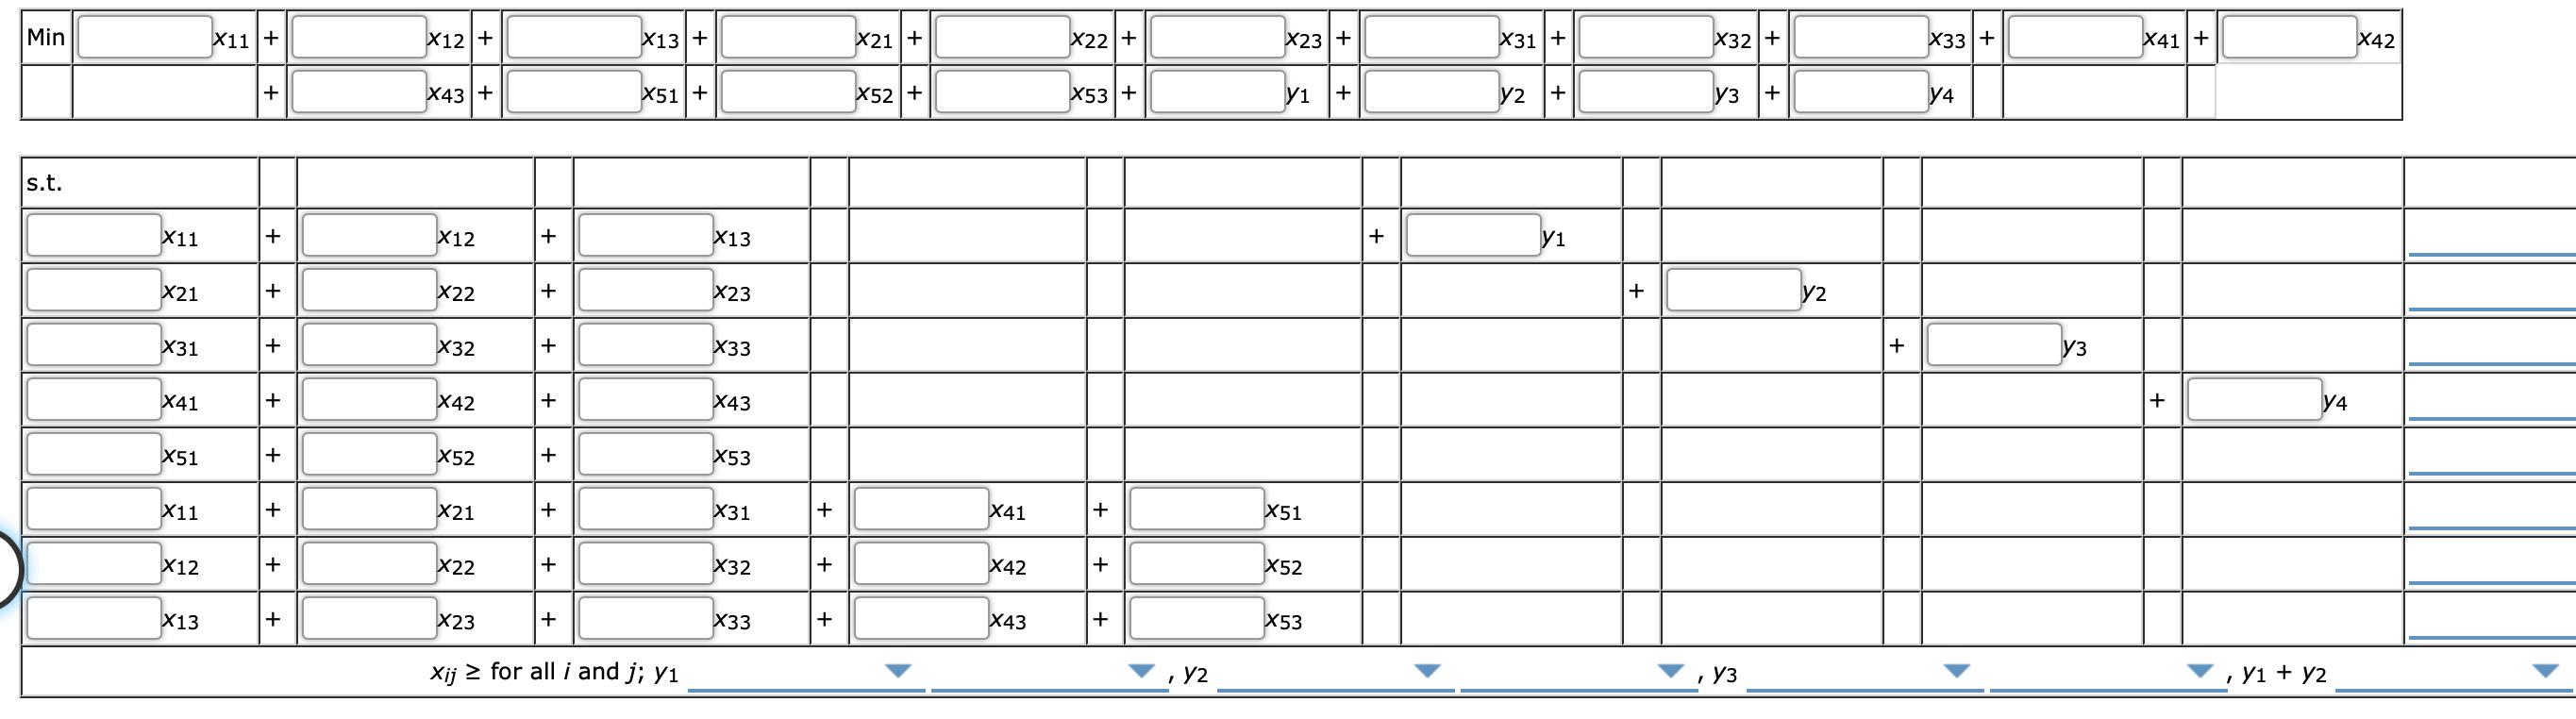
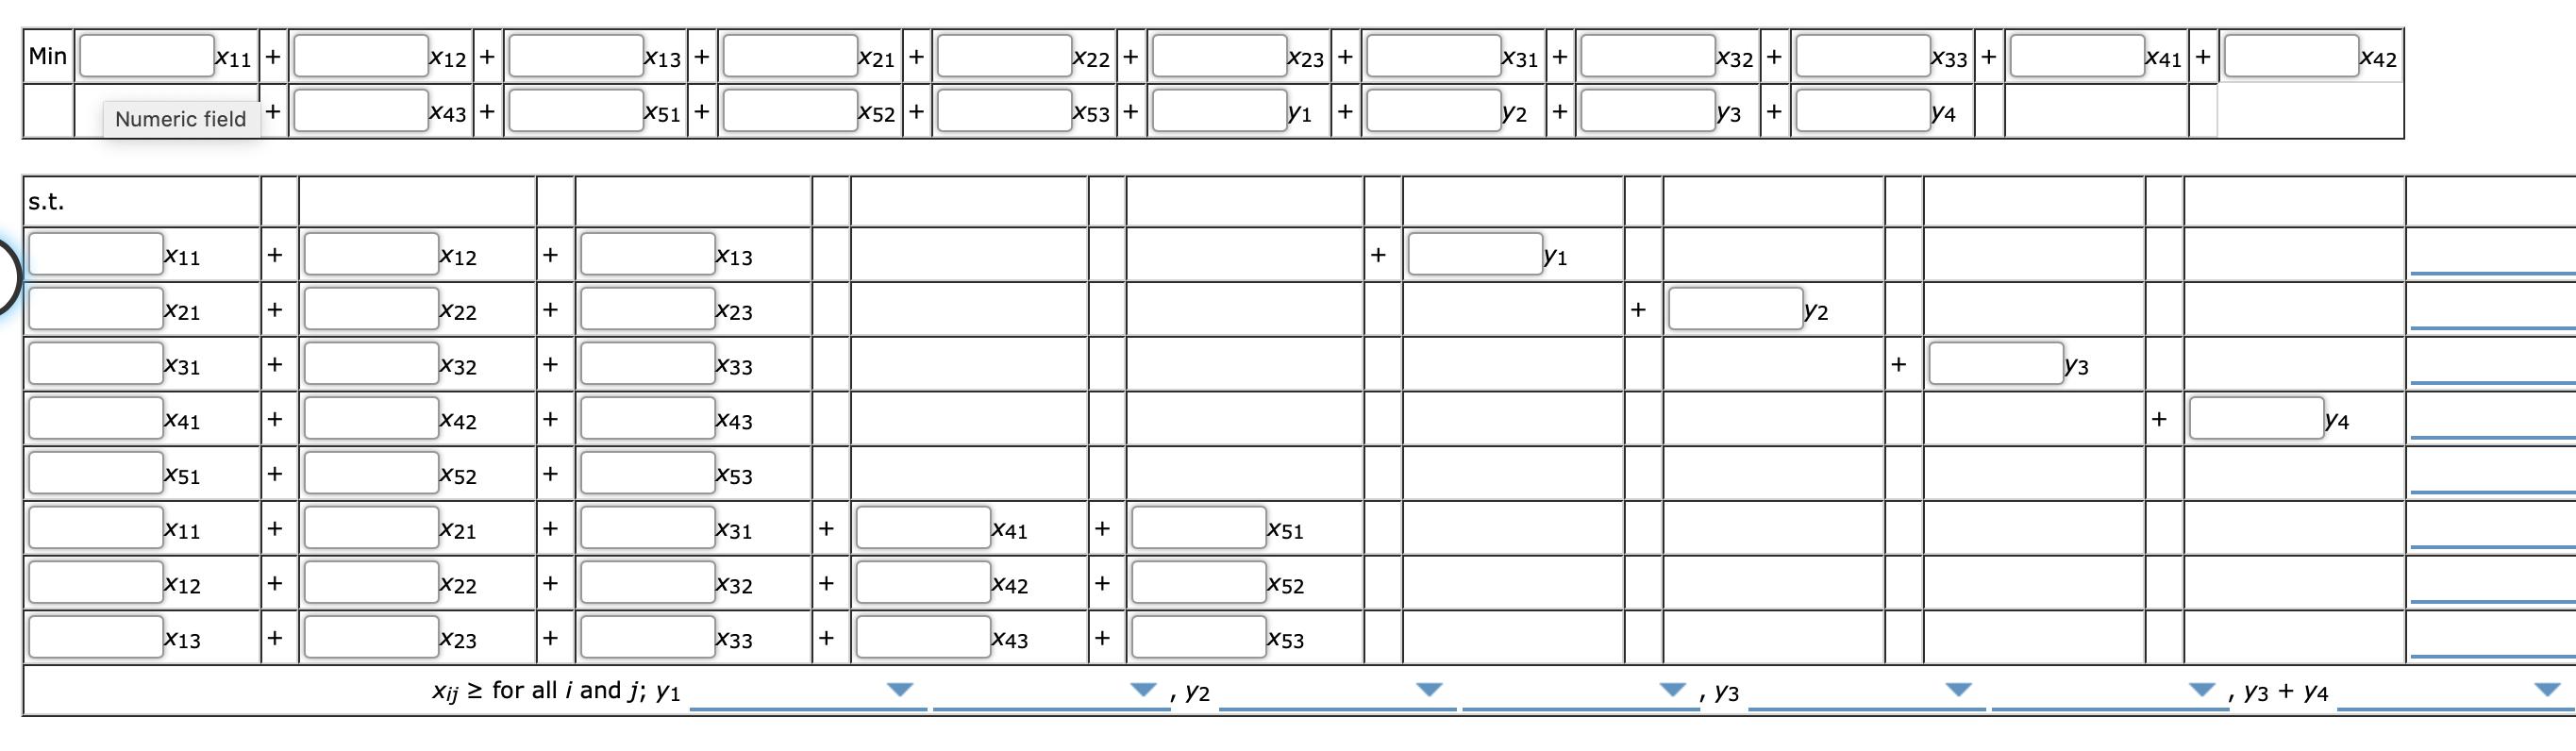
The Martin-Beck Company operates a plant in St. Louis with an annual capacity of 30,000 units. Product is shipped to regional distribution centers located in Boston, Atlanta, and Houston. Because of an anticipated increase in demand, Martin- Beck plans to increase capacity by constructing a new plant in one or more of the following cities: Detroit, Toledo, Denver, or Kansas City. The estimated annual fixed cost and the annual capacity for the four proposed plants are as follows: Proposed Plant Annual Fixed Cost Annual Capacity Detroit $175,000 10,000 Toledo $300,000 20,000 Denver $375,000 30,000 Kansas City $500,000 40,000 The company's long-range planning group developed forecasts of the anticipated annual demand at the distribution centers as follows: Distribution Center Annual Demand Boston 30,000 Atlanta 20,000 Houston 20,000 The shipping cost per unit from each plant to each distribution center is shown in table below. SHIPPING COST PER UNIT FOR THE MARTIN-BECK SUPPLY CHAIN Distribution Centers ETTT Plant Site Boston Atlanta Houston Detroit 2 3 Toledo Denver 4 3 7 4 5 Kansas City St. Louis 10 8. 4 4 2 3 A network representation of the potential Martin-Beck supply chain is shown in figure below. THE NETWORK REPRESENTATION OF THE MARTIN-BECK COMPANY SUPPLY CHAIN DESIGN PROBLEM 10 Detroit Distribution Centers 30 Boston 4 20 Toledo 3. 4 9 7 30 Denver 5 Atlanta 20 10 4. 40 Kansas City 8. Houston 20 3. 30 St. Louis Сараcities Distribution Routes Demands - Each potential plant location is shown; capacities and demands are shown in thousands of units. This network representation is for a transportation problem with a plant at St. Louis and at all four proposed sites. However, the decision has not yet been made as to which new plant or plants will be constructed. a. Formulate a model that could be used for choosing the best plant locations and for determining how much to ship from each plant to each distribution center. There is a policy restriction that a plant must be located either in Detroit or in Toledo, but not both. For those boxes in which you must enter subtractive or negative numbers use a minus sign. (Example: -300) Let y1 = 1 if a plant is constructed in Detroit; 0 if not y2 = 1 if a plant is constructed in Toledo; 0 if not y3 = 1 if a plant is constructed in Denver; 0 if not y4 = 1 if a plant is constructed in Kansas City; 0 if not Xij = the units shipped in thousands from plant i to distribution center j i= 1,2,3,4,5, and j = 1,2,3 Min X11+ X12 + X13 + X21 + X22+ X23 + X31 + X32 + X33 + X41+ X42 + X43 + X51+ X52 + X53+ Y2 + y3 + y4 + Min X11+ X12+ X13 + X21 + X22 + X23+ X31 + X32+ X33 + X41+ X42 X43 + X51+ X52 + X53 + yi + y2 y3 y4 s.t. X11 + X12 + X13 + y1 X21 + X22 X23 + y2 X31 X32 X33 y3 y4 X41 + X42 + X43 X51 + X52 + X53 X11 X21 +1 X31 + X41 + X51 X12 + X22 X42 X52 + X32 + + X13 X23 X33 + X43 X53 Xij 2 for all i i and j; y1 , Y2 , УЗ , Y1 + y2 + + + b. Formulate a model that could be used for choosing the best plant locations and for determining how much to ship from each plant to each distribution center. There is a policy restriction that no more than two plants can be located in Denver, Kansas City, and St. Louis. For those boxes in which you must enter subtractive or negative numbers use a minus sign. (Example: -300) Let yi = 1 if a plant is constructed in Detroit; 0 if not y2 = 1 if a plant is constructed in Toledo; 0 if not y3 = 1 if a plant is constructed in Denver; 0 if not y4 = 1 if a plant is constructed in Kansas City; 0 if not Xij the units shipped in thousands from plant i to distribution center j %3D i= 1,2,3,4,5, and j = 1,2,3 Min X11+ X12 + X13 + X21+ X22+ X23 + X31 + X32 + X33 + X41 + X42 X43 + X51+ X52 + X53 + y1 y2 y3 + Numeric field + + y4 s.t. X11 X12 X13 + X21 X22 X23 + y2 X31 + X32 X33 y3 X41 X42 +1 X43 y4 X51 + X52 + X53 X11 X21 X31 X41 X51 X12 + X22 X32 X42 X52 X13 + X23 X33 X43 X53 Xij 2 for all i and j; y1 , Y2 , Уз , Уз + у4 + + + + + + + + + + + + The Martin-Beck Company operates a plant in St. Louis with an annual capacity of 30,000 units. Product is shipped to regional distribution centers located in Boston, Atlanta, and Houston. Because of an anticipated increase in demand, Martin- Beck plans to increase capacity by constructing a new plant in one or more of the following cities: Detroit, Toledo, Denver, or Kansas City. The estimated annual fixed cost and the annual capacity for the four proposed plants are as follows: Proposed Plant Annual Fixed Cost Annual Capacity Detroit $175,000 10,000 Toledo $300,000 20,000 Denver $375,000 30,000 Kansas City $500,000 40,000 The company's long-range planning group developed forecasts of the anticipated annual demand at the distribution centers as follows: Distribution Center Annual Demand Boston 30,000 Atlanta 20,000 Houston 20,000 The shipping cost per unit from each plant to each distribution center is shown in table below. SHIPPING COST PER UNIT FOR THE MARTIN-BECK SUPPLY CHAIN Distribution Centers ETTT Plant Site Boston Atlanta Houston Detroit 2 3 Toledo Denver 4 3 7 4 5 Kansas City St. Louis 10 8. 4 4 2 3 A network representation of the potential Martin-Beck supply chain is shown in figure below. THE NETWORK REPRESENTATION OF THE MARTIN-BECK COMPANY SUPPLY CHAIN DESIGN PROBLEM 10 Detroit Distribution Centers 30 Boston 4 20 Toledo 3. 4 9 7 30 Denver 5 Atlanta 20 10 4. 40 Kansas City 8. Houston 20 3. 30 St. Louis Сараcities Distribution Routes Demands - Each potential plant location is shown; capacities and demands are shown in thousands of units. This network representation is for a transportation problem with a plant at St. Louis and at all four proposed sites. However, the decision has not yet been made as to which new plant or plants will be constructed. a. Formulate a model that could be used for choosing the best plant locations and for determining how much to ship from each plant to each distribution center. There is a policy restriction that a plant must be located either in Detroit or in Toledo, but not both. For those boxes in which you must enter subtractive or negative numbers use a minus sign. (Example: -300) Let y1 = 1 if a plant is constructed in Detroit; 0 if not y2 = 1 if a plant is constructed in Toledo; 0 if not y3 = 1 if a plant is constructed in Denver; 0 if not y4 = 1 if a plant is constructed in Kansas City; 0 if not Xij = the units shipped in thousands from plant i to distribution center j i= 1,2,3,4,5, and j = 1,2,3 Min X11+ X12 + X13 + X21 + X22+ X23 + X31 + X32 + X33 + X41+ X42 + X43 + X51+ X52 + X53+ Y2 + y3 + y4 + Min X11+ X12+ X13 + X21 + X22 + X23+ X31 + X32+ X33 + X41+ X42 X43 + X51+ X52 + X53 + yi + y2 y3 y4 s.t. X11 + X12 + X13 + y1 X21 + X22 X23 + y2 X31 X32 X33 y3 y4 X41 + X42 + X43 X51 + X52 + X53 X11 X21 +1 X31 + X41 + X51 X12 + X22 X42 X52 + X32 + + X13 X23 X33 + X43 X53 Xij 2 for all i i and j; y1 , Y2 , УЗ , Y1 + y2 + + + b. Formulate a model that could be used for choosing the best plant locations and for determining how much to ship from each plant to each distribution center. There is a policy restriction that no more than two plants can be located in Denver, Kansas City, and St. Louis. For those boxes in which you must enter subtractive or negative numbers use a minus sign. (Example: -300) Let yi = 1 if a plant is constructed in Detroit; 0 if not y2 = 1 if a plant is constructed in Toledo; 0 if not y3 = 1 if a plant is constructed in Denver; 0 if not y4 = 1 if a plant is constructed in Kansas City; 0 if not Xij the units shipped in thousands from plant i to distribution center j %3D i= 1,2,3,4,5, and j = 1,2,3 Min X11+ X12 + X13 + X21+ X22+ X23 + X31 + X32 + X33 + X41 + X42 X43 + X51+ X52 + X53 + y1 y2 y3 + Numeric field + + y4 s.t. X11 X12 X13 + X21 X22 X23 + y2 X31 + X32 X33 y3 X41 X42 +1 X43 y4 X51 + X52 + X53 X11 X21 X31 X41 X51 X12 + X22 X32 X42 X52 X13 + X23 X33 X43 X53 Xij 2 for all i and j; y1 , Y2 , Уз , Уз + у4 + + + + + + + + + + + + The Martin-Beck Company operates a plant in St. Louis with an annual capacity of 30,000 units. Product is shipped to regional distribution centers located in Boston, Atlanta, and Houston. Because of an anticipated increase in demand, Martin- Beck plans to increase capacity by constructing a new plant in one or more of the following cities: Detroit, Toledo, Denver, or Kansas City. The estimated annual fixed cost and the annual capacity for the four proposed plants are as follows: Proposed Plant Annual Fixed Cost Annual Capacity Detroit $175,000 10,000 Toledo $300,000 20,000 Denver $375,000 30,000 Kansas City $500,000 40,000 The company's long-range planning group developed forecasts of the anticipated annual demand at the distribution centers as follows: Distribution Center Annual Demand Boston 30,000 Atlanta 20,000 Houston 20,000 The shipping cost per unit from each plant to each distribution center is shown in table below. SHIPPING COST PER UNIT FOR THE MARTIN-BECK SUPPLY CHAIN Distribution Centers ETTT Plant Site Boston Atlanta Houston Detroit 2 3 Toledo Denver 4 3 7 4 5 Kansas City St. Louis 10 8. 4 4 2 3 A network representation of the potential Martin-Beck supply chain is shown in figure below. THE NETWORK REPRESENTATION OF THE MARTIN-BECK COMPANY SUPPLY CHAIN DESIGN PROBLEM 10 Detroit Distribution Centers 30 Boston 4 20 Toledo 3. 4 9 7 30 Denver 5 Atlanta 20 10 4. 40 Kansas City 8. Houston 20 3. 30 St. Louis Сараcities Distribution Routes Demands - Each potential plant location is shown; capacities and demands are shown in thousands of units. This network representation is for a transportation problem with a plant at St. Louis and at all four proposed sites. However, the decision has not yet been made as to which new plant or plants will be constructed. a. Formulate a model that could be used for choosing the best plant locations and for determining how much to ship from each plant to each distribution center. There is a policy restriction that a plant must be located either in Detroit or in Toledo, but not both. For those boxes in which you must enter subtractive or negative numbers use a minus sign. (Example: -300) Let y1 = 1 if a plant is constructed in Detroit; 0 if not y2 = 1 if a plant is constructed in Toledo; 0 if not y3 = 1 if a plant is constructed in Denver; 0 if not y4 = 1 if a plant is constructed in Kansas City; 0 if not Xij = the units shipped in thousands from plant i to distribution center j i= 1,2,3,4,5, and j = 1,2,3 Min X11+ X12 + X13 + X21 + X22+ X23 + X31 + X32 + X33 + X41+ X42 + X43 + X51+ X52 + X53+ Y2 + y3 + y4 + Min X11+ X12+ X13 + X21 + X22 + X23+ X31 + X32+ X33 + X41+ X42 X43 + X51+ X52 + X53 + yi + y2 y3 y4 s.t. X11 + X12 + X13 + y1 X21 + X22 X23 + y2 X31 X32 X33 y3 y4 X41 + X42 + X43 X51 + X52 + X53 X11 X21 +1 X31 + X41 + X51 X12 + X22 X42 X52 + X32 + + X13 X23 X33 + X43 X53 Xij 2 for all i i and j; y1 , Y2 , УЗ , Y1 + y2 + + + b. Formulate a model that could be used for choosing the best plant locations and for determining how much to ship from each plant to each distribution center. There is a policy restriction that no more than two plants can be located in Denver, Kansas City, and St. Louis. For those boxes in which you must enter subtractive or negative numbers use a minus sign. (Example: -300) Let yi = 1 if a plant is constructed in Detroit; 0 if not y2 = 1 if a plant is constructed in Toledo; 0 if not y3 = 1 if a plant is constructed in Denver; 0 if not y4 = 1 if a plant is constructed in Kansas City; 0 if not Xij the units shipped in thousands from plant i to distribution center j %3D i= 1,2,3,4,5, and j = 1,2,3 Min X11+ X12 + X13 + X21+ X22+ X23 + X31 + X32 + X33 + X41 + X42 X43 + X51+ X52 + X53 + y1 y2 y3 + Numeric field + + y4 s.t. X11 X12 X13 + X21 X22 X23 + y2 X31 + X32 X33 y3 X41 X42 +1 X43 y4 X51 + X52 + X53 X11 X21 X31 X41 X51 X12 + X22 X32 X42 X52 X13 + X23 X33 X43 X53 Xij 2 for all i and j; y1 , Y2 , Уз , Уз + у4 + + + + + + + + + + + + The Martin-Beck Company operates a plant in St. Louis with an annual capacity of 30,000 units. Product is shipped to regional distribution centers located in Boston, Atlanta, and Houston. Because of an anticipated increase in demand, Martin- Beck plans to increase capacity by constructing a new plant in one or more of the following cities: Detroit, Toledo, Denver, or Kansas City. The estimated annual fixed cost and the annual capacity for the four proposed plants are as follows: Proposed Plant Annual Fixed Cost Annual Capacity Detroit $175,000 10,000 Toledo $300,000 20,000 Denver $375,000 30,000 Kansas City $500,000 40,000 The company's long-range planning group developed forecasts of the anticipated annual demand at the distribution centers as follows: Distribution Center Annual Demand Boston 30,000 Atlanta 20,000 Houston 20,000 The shipping cost per unit from each plant to each distribution center is shown in table below. SHIPPING COST PER UNIT FOR THE MARTIN-BECK SUPPLY CHAIN Distribution Centers ETTT Plant Site Boston Atlanta Houston Detroit 2 3 Toledo Denver 4 3 7 4 5 Kansas City St. Louis 10 8. 4 4 2 3 A network representation of the potential Martin-Beck supply chain is shown in figure below. THE NETWORK REPRESENTATION OF THE MARTIN-BECK COMPANY SUPPLY CHAIN DESIGN PROBLEM 10 Detroit Distribution Centers 30 Boston 4 20 Toledo 3. 4 9 7 30 Denver 5 Atlanta 20 10 4. 40 Kansas City 8. Houston 20 3. 30 St. Louis Сараcities Distribution Routes Demands - Each potential plant location is shown; capacities and demands are shown in thousands of units. This network representation is for a transportation problem with a plant at St. Louis and at all four proposed sites. However, the decision has not yet been made as to which new plant or plants will be constructed. a. Formulate a model that could be used for choosing the best plant locations and for determining how much to ship from each plant to each distribution center. There is a policy restriction that a plant must be located either in Detroit or in Toledo, but not both. For those boxes in which you must enter subtractive or negative numbers use a minus sign. (Example: -300) Let y1 = 1 if a plant is constructed in Detroit; 0 if not y2 = 1 if a plant is constructed in Toledo; 0 if not y3 = 1 if a plant is constructed in Denver; 0 if not y4 = 1 if a plant is constructed in Kansas City; 0 if not Xij = the units shipped in thousands from plant i to distribution center j i= 1,2,3,4,5, and j = 1,2,3 Min X11+ X12 + X13 + X21 + X22+ X23 + X31 + X32 + X33 + X41+ X42 + X43 + X51+ X52 + X53+ Y2 + y3 + y4 + Min X11+ X12+ X13 + X21 + X22 + X23+ X31 + X32+ X33 + X41+ X42 X43 + X51+ X52 + X53 + yi + y2 y3 y4 s.t. X11 + X12 + X13 + y1 X21 + X22 X23 + y2 X31 X32 X33 y3 y4 X41 + X42 + X43 X51 + X52 + X53 X11 X21 +1 X31 + X41 + X51 X12 + X22 X42 X52 + X32 + + X13 X23 X33 + X43 X53 Xij 2 for all i i and j; y1 , Y2 , УЗ , Y1 + y2 + + + b. Formulate a model that could be used for choosing the best plant locations and for determining how much to ship from each plant to each distribution center. There is a policy restriction that no more than two plants can be located in Denver, Kansas City, and St. Louis. For those boxes in which you must enter subtractive or negative numbers use a minus sign. (Example: -300) Let yi = 1 if a plant is constructed in Detroit; 0 if not y2 = 1 if a plant is constructed in Toledo; 0 if not y3 = 1 if a plant is constructed in Denver; 0 if not y4 = 1 if a plant is constructed in Kansas City; 0 if not Xij the units shipped in thousands from plant i to distribution center j %3D i= 1,2,3,4,5, and j = 1,2,3 Min X11+ X12 + X13 + X21+ X22+ X23 + X31 + X32 + X33 + X41 + X42 X43 + X51+ X52 + X53 + y1 y2 y3 + Numeric field + + y4 s.t. X11 X12 X13 + X21 X22 X23 + y2 X31 + X32 X33 y3 X41 X42 +1 X43 y4 X51 + X52 + X53 X11 X21 X31 X41 X51 X12 + X22 X32 X42 X52 X13 + X23 X33 X43 X53 Xij 2 for all i and j; y1 , Y2 , Уз , Уз + у4 + + + + + + + + + + + + The Martin-Beck Company operates a plant in St. Louis with an annual capacity of 30,000 units. Product is shipped to regional distribution centers located in Boston, Atlanta, and Houston. Because of an anticipated increase in demand, Martin- Beck plans to increase capacity by constructing a new plant in one or more of the following cities: Detroit, Toledo, Denver, or Kansas City. The estimated annual fixed cost and the annual capacity for the four proposed plants are as follows: Proposed Plant Annual Fixed Cost Annual Capacity Detroit $175,000 10,000 Toledo $300,000 20,000 Denver $375,000 30,000 Kansas City $500,000 40,000 The company's long-range planning group developed forecasts of the anticipated annual demand at the distribution centers as follows: Distribution Center Annual Demand Boston 30,000 Atlanta 20,000 Houston 20,000 The shipping cost per unit from each plant to each distribution center is shown in table below. SHIPPING COST PER UNIT FOR THE MARTIN-BECK SUPPLY CHAIN Distribution Centers ETTT Plant Site Boston Atlanta Houston Detroit 2 3 Toledo Denver 4 3 7 4 5 Kansas City St. Louis 10 8. 4 4 2 3 A network representation of the potential Martin-Beck supply chain is shown in figure below. THE NETWORK REPRESENTATION OF THE MARTIN-BECK COMPANY SUPPLY CHAIN DESIGN PROBLEM 10 Detroit Distribution Centers 30 Boston 4 20 Toledo 3. 4 9 7 30 Denver 5 Atlanta 20 10 4. 40 Kansas City 8. Houston 20 3. 30 St. Louis Сараcities Distribution Routes Demands - Each potential plant location is shown; capacities and demands are shown in thousands of units. This network representation is for a transportation problem with a plant at St. Louis and at all four proposed sites. However, the decision has not yet been made as to which new plant or plants will be constructed. a. Formulate a model that could be used for choosing the best plant locations and for determining how much to ship from each plant to each distribution center. There is a policy restriction that a plant must be located either in Detroit or in Toledo, but not both. For those boxes in which you must enter subtractive or negative numbers use a minus sign. (Example: -300) Let y1 = 1 if a plant is constructed in Detroit; 0 if not y2 = 1 if a plant is constructed in Toledo; 0 if not y3 = 1 if a plant is constructed in Denver; 0 if not y4 = 1 if a plant is constructed in Kansas City; 0 if not Xij = the units shipped in thousands from plant i to distribution center j i= 1,2,3,4,5, and j = 1,2,3 Min X11+ X12 + X13 + X21 + X22+ X23 + X31 + X32 + X33 + X41+ X42 + X43 + X51+ X52 + X53+ Y2 + y3 + y4 + Min X11+ X12+ X13 + X21 + X22 + X23+ X31 + X32+ X33 + X41+ X42 X43 + X51+ X52 + X53 + yi + y2 y3 y4 s.t. X11 + X12 + X13 + y1 X21 + X22 X23 + y2 X31 X32 X33 y3 y4 X41 + X42 + X43 X51 + X52 + X53 X11 X21 +1 X31 + X41 + X51 X12 + X22 X42 X52 + X32 + + X13 X23 X33 + X43 X53 Xij 2 for all i i and j; y1 , Y2 , УЗ , Y1 + y2 + + + b. Formulate a model that could be used for choosing the best plant locations and for determining how much to ship from each plant to each distribution center. There is a policy restriction that no more than two plants can be located in Denver, Kansas City, and St. Louis. For those boxes in which you must enter subtractive or negative numbers use a minus sign. (Example: -300) Let yi = 1 if a plant is constructed in Detroit; 0 if not y2 = 1 if a plant is constructed in Toledo; 0 if not y3 = 1 if a plant is constructed in Denver; 0 if not y4 = 1 if a plant is constructed in Kansas City; 0 if not Xij the units shipped in thousands from plant i to distribution center j %3D i= 1,2,3,4,5, and j = 1,2,3 Min X11+ X12 + X13 + X21+ X22+ X23 + X31 + X32 + X33 + X41 + X42 X43 + X51+ X52 + X53 + y1 y2 y3 + Numeric field + + y4 s.t. X11 X12 X13 + X21 X22 X23 + y2 X31 + X32 X33 y3 X41 X42 +1 X43 y4 X51 + X52 + X53 X11 X21 X31 X41 X51 X12 + X22 X32 X42 X52 X13 + X23 X33 X43 X53 Xij 2 for all i and j; y1 , Y2 , Уз , Уз + у4 + + + + + + + + + + + + The Martin-Beck Company operates a plant in St. Louis with an annual capacity of 30,000 units. Product is shipped to regional distribution centers located in Boston, Atlanta, and Houston. Because of an anticipated increase in demand, Martin- Beck plans to increase capacity by constructing a new plant in one or more of the following cities: Detroit, Toledo, Denver, or Kansas City. The estimated annual fixed cost and the annual capacity for the four proposed plants are as follows: Proposed Plant Annual Fixed Cost Annual Capacity Detroit $175,000 10,000 Toledo $300,000 20,000 Denver $375,000 30,000 Kansas City $500,000 40,000 The company's long-range planning group developed forecasts of the anticipated annual demand at the distribution centers as follows: Distribution Center Annual Demand Boston 30,000 Atlanta 20,000 Houston 20,000 The shipping cost per unit from each plant to each distribution center is shown in table below. SHIPPING COST PER UNIT FOR THE MARTIN-BECK SUPPLY CHAIN Distribution Centers ETTT Plant Site Boston Atlanta Houston Detroit 2 3 Toledo Denver 4 3 7 4 5 Kansas City St. Louis 10 8. 4 4 2 3 A network representation of the potential Martin-Beck supply chain is shown in figure below. THE NETWORK REPRESENTATION OF THE MARTIN-BECK COMPANY SUPPLY CHAIN DESIGN PROBLEM 10 Detroit Distribution Centers 30 Boston 4 20 Toledo 3. 4 9 7 30 Denver 5 Atlanta 20 10 4. 40 Kansas City 8. Houston 20 3. 30 St. Louis Сараcities Distribution Routes Demands - Each potential plant location is shown; capacities and demands are shown in thousands of units. This network representation is for a transportation problem with a plant at St. Louis and at all four proposed sites. However, the decision has not yet been made as to which new plant or plants will be constructed. a. Formulate a model that could be used for choosing the best plant locations and for determining how much to ship from each plant to each distribution center. There is a policy restriction that a plant must be located either in Detroit or in Toledo, but not both. For those boxes in which you must enter subtractive or negative numbers use a minus sign. (Example: -300) Let y1 = 1 if a plant is constructed in Detroit; 0 if not y2 = 1 if a plant is constructed in Toledo; 0 if not y3 = 1 if a plant is constructed in Denver; 0 if not y4 = 1 if a plant is constructed in Kansas City; 0 if not Xij = the units shipped in thousands from plant i to distribution center j i= 1,2,3,4,5, and j = 1,2,3 Min X11+ X12 + X13 + X21 + X22+ X23 + X31 + X32 + X33 + X41+ X42 + X43 + X51+ X52 + X53+ Y2 + y3 + y4 + Min X11+ X12+ X13 + X21 + X22 + X23+ X31 + X32+ X33 + X41+ X42 X43 + X51+ X52 + X53 + yi + y2 y3 y4 s.t. X11 + X12 + X13 + y1 X21 + X22 X23 + y2 X31 X32 X33 y3 y4 X41 + X42 + X43 X51 + X52 + X53 X11 X21 +1 X31 + X41 + X51 X12 + X22 X42 X52 + X32 + + X13 X23 X33 + X43 X53 Xij 2 for all i i and j; y1 , Y2 , УЗ , Y1 + y2 + + + b. Formulate a model that could be used for choosing the best plant locations and for determining how much to ship from each plant to each distribution center. There is a policy restriction that no more than two plants can be located in Denver, Kansas City, and St. Louis. For those boxes in which you must enter subtractive or negative numbers use a minus sign. (Example: -300) Let yi = 1 if a plant is constructed in Detroit; 0 if not y2 = 1 if a plant is constructed in Toledo; 0 if not y3 = 1 if a plant is constructed in Denver; 0 if not y4 = 1 if a plant is constructed in Kansas City; 0 if not Xij the units shipped in thousands from plant i to distribution center j %3D i= 1,2,3,4,5, and j = 1,2,3 Min X11+ X12 + X13 + X21+ X22+ X23 + X31 + X32 + X33 + X41 + X42 X43 + X51+ X52 + X53 + y1 y2 y3 + Numeric field + + y4 s.t. X11 X12 X13 + X21 X22 X23 + y2 X31 + X32 X33 y3 X41 X42 +1 X43 y4 X51 + X52 + X53 X11 X21 X31 X41 X51 X12 + X22 X32 X42 X52 X13 + X23 X33 X43 X53 Xij 2 for all i and j; y1 , Y2 , Уз , Уз + у4 + + + + + + + + + + + + The Martin-Beck Company operates a plant in St. Louis with an annual capacity of 30,000 units. Product is shipped to regional distribution centers located in Boston, Atlanta, and Houston. Because of an anticipated increase in demand, Martin- Beck plans to increase capacity by constructing a new plant in one or more of the following cities: Detroit, Toledo, Denver, or Kansas City. The estimated annual fixed cost and the annual capacity for the four proposed plants are as follows: Proposed Plant Annual Fixed Cost Annual Capacity Detroit $175,000 10,000 Toledo $300,000 20,000 Denver $375,000 30,000 Kansas City $500,000 40,000 The company's long-range planning group developed forecasts of the anticipated annual demand at the distribution centers as follows: Distribution Center Annual Demand Boston 30,000 Atlanta 20,000 Houston 20,000 The shipping cost per unit from each plant to each distribution center is shown in table below. SHIPPING COST PER UNIT FOR THE MARTIN-BECK SUPPLY CHAIN Distribution Centers ETTT Plant Site Boston Atlanta Houston Detroit 2 3 Toledo Denver 4 3 7 4 5 Kansas City St. Louis 10 8. 4 4 2 3 A network representation of the potential Martin-Beck supply chain is shown in figure below. THE NETWORK REPRESENTATION OF THE MARTIN-BECK COMPANY SUPPLY CHAIN DESIGN PROBLEM 10 Detroit Distribution Centers 30 Boston 4 20 Toledo 3. 4 9 7 30 Denver 5 Atlanta 20 10 4. 40 Kansas City 8. Houston 20 3. 30 St. Louis Сараcities Distribution Routes Demands - Each potential plant location is shown; capacities and demands are shown in thousands of units. This network representation is for a transportation problem with a plant at St. Louis and at all four proposed sites. However, the decision has not yet been made as to which new plant or plants will be constructed. a. Formulate a model that could be used for choosing the best plant locations and for determining how much to ship from each plant to each distribution center. There is a policy restriction that a plant must be located either in Detroit or in Toledo, but not both. For those boxes in which you must enter subtractive or negative numbers use a minus sign. (Example: -300) Let y1 = 1 if a plant is constructed in Detroit; 0 if not y2 = 1 if a plant is constructed in Toledo; 0 if not y3 = 1 if a plant is constructed in Denver; 0 if not y4 = 1 if a plant is constructed in Kansas City; 0 if not Xij = the units shipped in thousands from plant i to distribution center j i= 1,2,3,4,5, and j = 1,2,3 Min X11+ X12 + X13 + X21 + X22+ X23 + X31 + X32 + X33 + X41+ X42 + X43 + X51+ X52 + X53+ Y2 + y3 + y4 + Min X11+ X12+ X13 + X21 + X22 + X23+ X31 + X32+ X33 + X41+ X42 X43 + X51+ X52 + X53 + yi + y2 y3 y4 s.t. X11 + X12 + X13 + y1 X21 + X22 X23 + y2 X31 X32 X33 y3 y4 X41 + X42 + X43 X51 + X52 + X53 X11 X21 +1 X31 + X41 + X51 X12 + X22 X42 X52 + X32 + + X13 X23 X33 + X43 X53 Xij 2 for all i i and j; y1 , Y2 , УЗ , Y1 + y2 + + + b. Formulate a model that could be used for choosing the best plant locations and for determining how much to ship from each plant to each distribution center. There is a policy restriction that no more than two plants can be located in Denver, Kansas City, and St. Louis. For those boxes in which you must enter subtractive or negative numbers use a minus sign. (Example: -300) Let yi = 1 if a plant is constructed in Detroit; 0 if not y2 = 1 if a plant is constructed in Toledo; 0 if not y3 = 1 if a plant is constructed in Denver; 0 if not y4 = 1 if a plant is constructed in Kansas City; 0 if not Xij the units shipped in thousands from plant i to distribution center j %3D i= 1,2,3,4,5, and j = 1,2,3 Min X11+ X12 + X13 + X21+ X22+ X23 + X31 + X32 + X33 + X41 + X42 X43 + X51+ X52 + X53 + y1 y2 y3 + Numeric field + + y4 s.t. X11 X12 X13 + X21 X22 X23 + y2 X31 + X32 X33 y3 X41 X42 +1 X43 y4 X51 + X52 + X53 X11 X21 X31 X41 X51 X12 + X22 X32 X42 X52 X13 + X23 X33 X43 X53 Xij 2 for all i and j; y1 , Y2 , Уз , Уз + у4 + + + + + + + + + + + + The Martin-Beck Company operates a plant in St. Louis with an annual capacity of 30,000 units. Product is shipped to regional distribution centers located in Boston, Atlanta, and Houston. Because of an anticipated increase in demand, Martin- Beck plans to increase capacity by constructing a new plant in one or more of the following cities: Detroit, Toledo, Denver, or Kansas City. The estimated annual fixed cost and the annual capacity for the four proposed plants are as follows: Proposed Plant Annual Fixed Cost Annual Capacity Detroit $175,000 10,000 Toledo $300,000 20,000 Denver $375,000 30,000 Kansas City $500,000 40,000 The company's long-range planning group developed forecasts of the anticipated annual demand at the distribution centers as follows: Distribution Center Annual Demand Boston 30,000 Atlanta 20,000 Houston 20,000 The shipping cost per unit from each plant to each distribution center is shown in table below. SHIPPING COST PER UNIT FOR THE MARTIN-BECK SUPPLY CHAIN Distribution Centers ETTT Plant Site Boston Atlanta Houston Detroit 2 3 Toledo Denver 4 3 7 4 5 Kansas City St. Louis 10 8. 4 4 2 3 A network representation of the potential Martin-Beck supply chain is shown in figure below. THE NETWORK REPRESENTATION OF THE MARTIN-BECK COMPANY SUPPLY CHAIN DESIGN PROBLEM 10 Detroit Distribution Centers 30 Boston 4 20 Toledo 3. 4 9 7 30 Denver 5 Atlanta 20 10 4. 40 Kansas City 8. Houston 20 3. 30 St. Louis Сараcities Distribution Routes Demands - Each potential plant location is shown; capacities and demands are shown in thousands of units. This network representation is for a transportation problem with a plant at St. Louis and at all four proposed sites. However, the decision has not yet been made as to which new plant or plants will be constructed. a. Formulate a model that could be used for choosing the best plant locations and for determining how much to ship from each plant to each distribution center. There is a policy restriction that a plant must be located either in Detroit or in Toledo, but not both. For those boxes in which you must enter subtractive or negative numbers use a minus sign. (Example: -300) Let y1 = 1 if a plant is constructed in Detroit; 0 if not y2 = 1 if a plant is constructed in Toledo; 0 if not y3 = 1 if a plant is constructed in Denver; 0 if not y4 = 1 if a plant is constructed in Kansas City; 0 if not Xij = the units shipped in thousands from plant i to distribution center j i= 1,2,3,4,5, and j = 1,2,3 Min X11+ X12 + X13 + X21 + X22+ X23 + X31 + X32 + X33 + X41+ X42 + X43 + X51+ X52 + X53+ Y2 + y3 + y4 + Min X11+ X12+ X13 + X21 + X22 + X23+ X31 + X32+ X33 + X41+ X42 X43 + X51+ X52 + X53 + yi + y2 y3 y4 s.t. X11 + X12 + X13 + y1 X21 + X22 X23 + y2 X31 X32 X33 y3 y4 X41 + X42 + X43 X51 + X52 + X53 X11 X21 +1 X31 + X41 + X51 X12 + X22 X42 X52 + X32 + + X13 X23 X33 + X43 X53 Xij 2 for all i i and j; y1 , Y2 , УЗ , Y1 + y2 + + + b. Formulate a model that could be used for choosing the best plant locations and for determining how much to ship from each plant to each distribution center. There is a policy restriction that no more than two plants can be located in Denver, Kansas City, and St. Louis. For those boxes in which you must enter subtractive or negative numbers use a minus sign. (Example: -300) Let yi = 1 if a plant is constructed in Detroit; 0 if not y2 = 1 if a plant is constructed in Toledo; 0 if not y3 = 1 if a plant is constructed in Denver; 0 if not y4 = 1 if a plant is constructed in Kansas City; 0 if not Xij the units shipped in thousands from plant i to distribution center j %3D i= 1,2,3,4,5, and j = 1,2,3 Min X11+ X12 + X13 + X21+ X22+ X23 + X31 + X32 + X33 + X41 + X42 X43 + X51+ X52 + X53 + y1 y2 y3 + Numeric field + + y4 s.t. X11 X12 X13 + X21 X22 X23 + y2 X31 + X32 X33 y3 X41 X42 +1 X43 y4 X51 + X52 + X53 X11 X21 X31 X41 X51 X12 + X22 X32 X42 X52 X13 + X23 X33 X43 X53 Xij 2 for all i and j; y1 , Y2 , Уз , Уз + у4 + + + + + + + + + + + +
Expert Answer:
Answer rating: 100% (QA)
The shipping cost per unit from each plant to each distribution center is as fol... View the full answer

Related Book For 
Quantitative Methods for Business
ISBN: 978-0840062345
12th edition
Authors: David Anderson, Dennis Sweeney, Thomas Williams, Jeffrey Cam
Posted Date:
Students also viewed these accounting questions
-
This visualization is an example of which type of data visualization? how scientific accounting Selected Answer: Answers: A boxplot A histogram A boxplot A A bar graph A stacked bar chart A line...
-
Galaxy Cloud Services operates several data centers across the United States that contain servers which store and process the data on the Internet. Suppose that Galaxy Cloud Services currently has...
-
Consider the following population growth model N t =N 0 * t Question options: It includes the "finite rate of increase" It includes the "intrinsic rate of increase" It includes the "Malthusian...
-
Apply the product rule for exponents, if possible. y 4 y 5 y 6
-
The average monthly price of regular gasoline in Southern California is monitored by the Automobile Club of South-ern Californias monthly Fuel Gauge Report. The prices of the time period July 2004 to...
-
A register cell is to be designed for register B, which has the following register transfers: Share the combinational logic between the two transfers as much as possible. SO: BB+ A S1: B A + 1
-
In a laboratory test of a new automobile engine design carried out at the Colorado School of Mines, the emission rate (in milligrams per second) of oxides of nitrogen was measured for 32 engines at...
-
Kate is having a difficult time differentiating all of the account names. My head is spinning when all the accounts sound the same to me! Does unearned revenue belong on the income statement or the...
-
Convertible Bond Arbitrage desk managers closely monitor their book delta exposure and dynamically hedge the risk by shorting the related stocks. (1) What is the major reason why the Convertible Bond...
-
Using the percentage method for manual payroll with W-4s from 2020 or later in Appendix C calculate the federal withholding amounts for the following employees. No information was included in Step 4...
-
Let f(r) = r* - 2? 2 Z3[r]. (a) Find the splitting field E of f(x) over Z3. (b) Find the Galois group Gal(E/Z3). Hint: How many elements does E have?
-
How to make a vba for payback period from these case Cumulative Year Cash Flow Cash Flow DF 12,00% PV NPV 50.677.130 IRR 15,20% 13,25% MIRR Payback Period Calculation Last Negative Cashflow Years...
-
Cambridge Office Furniture is weighing a proposal to manufacture and sell a new line of products aimed at the home office market. It would feature a number of modular components such as computer...
-
The two balls are attached to the light rigid rod, which is suspended by a cord from the support above it. If the balls and rod, initially at rest, are struck with the force F = 17.0 lb, calculate...
-
6 Binomial Model II (15 points) Consider a three-period binomial model with t = 0,1,2,3. To make life easy, At = 1. To make life even easier, suppose that at every point in time, the risk-free zero...
-
IE 375 - Production Planning Homework Assignment 1 - October 10 The past demand data for taxi rides at Bilkent Campus is given in the following table. Week 1 Week 2 Week 3 Week 4 Week 5 Week 6 Monday...
-
The project is on smith and Wesson arm fire company GENERAL ENVIRONMENT RESEARCH-PEST- DEG Analysis - Broad Market Forces Influence Industry (Include citations) Make sure that you clearly identify...
-
Suppose Green Network Energy needs to raise money to finance its new manufacturing facility, but their CFO does not think the company is financially capable of making the periodic interest payments...
-
A company imports goods at two ports: Philadelphia and New Orleans. Shipments of one product are made to customers in Atlanta, Dallas, Columbus, and Boston. For the next planning period, the supplies...
-
Consider the following mixed-integer linear program: Max 1x1 + 1x2 s.t. 7x1 + 9x2 63 9x1 + 5x2 45 3x1 + 1x2 12 x1, x2 0 and x2 integer a. Graph the constraints for this problem. Indicate on your...
-
The purpose of this exercise is to provide practice using LINGO or Excel Solver. Find the values of X and Y that minimize the function Min X2 - 4X + Y2 + 8Y + 20 Do not assume non-negativity of the X...
-
A cylindrical tank of methanol has a mass of \(60 \mathrm{~kg}\) and a volume of \(75 \mathrm{~L}\). Determine the methanol's weight, density, and specific gravity. Take the gravitational...
-
A mass of \(0.5-\mathrm{kg}\) of argon is maintained at \(1400 \mathrm{kPa}\) and \(40^{\circ} \mathrm{C}\) in a tank. What is the volume of the tank?
-
The air in an automobile tire with a volume of \(0.015 \mathrm{~m}^{3}\) is at \(30^{\circ} \mathrm{C}\) and \(140 \mathrm{kPa}\) (gage). Determine the amount of air that must be added to raise the...

Study smarter with the SolutionInn App