

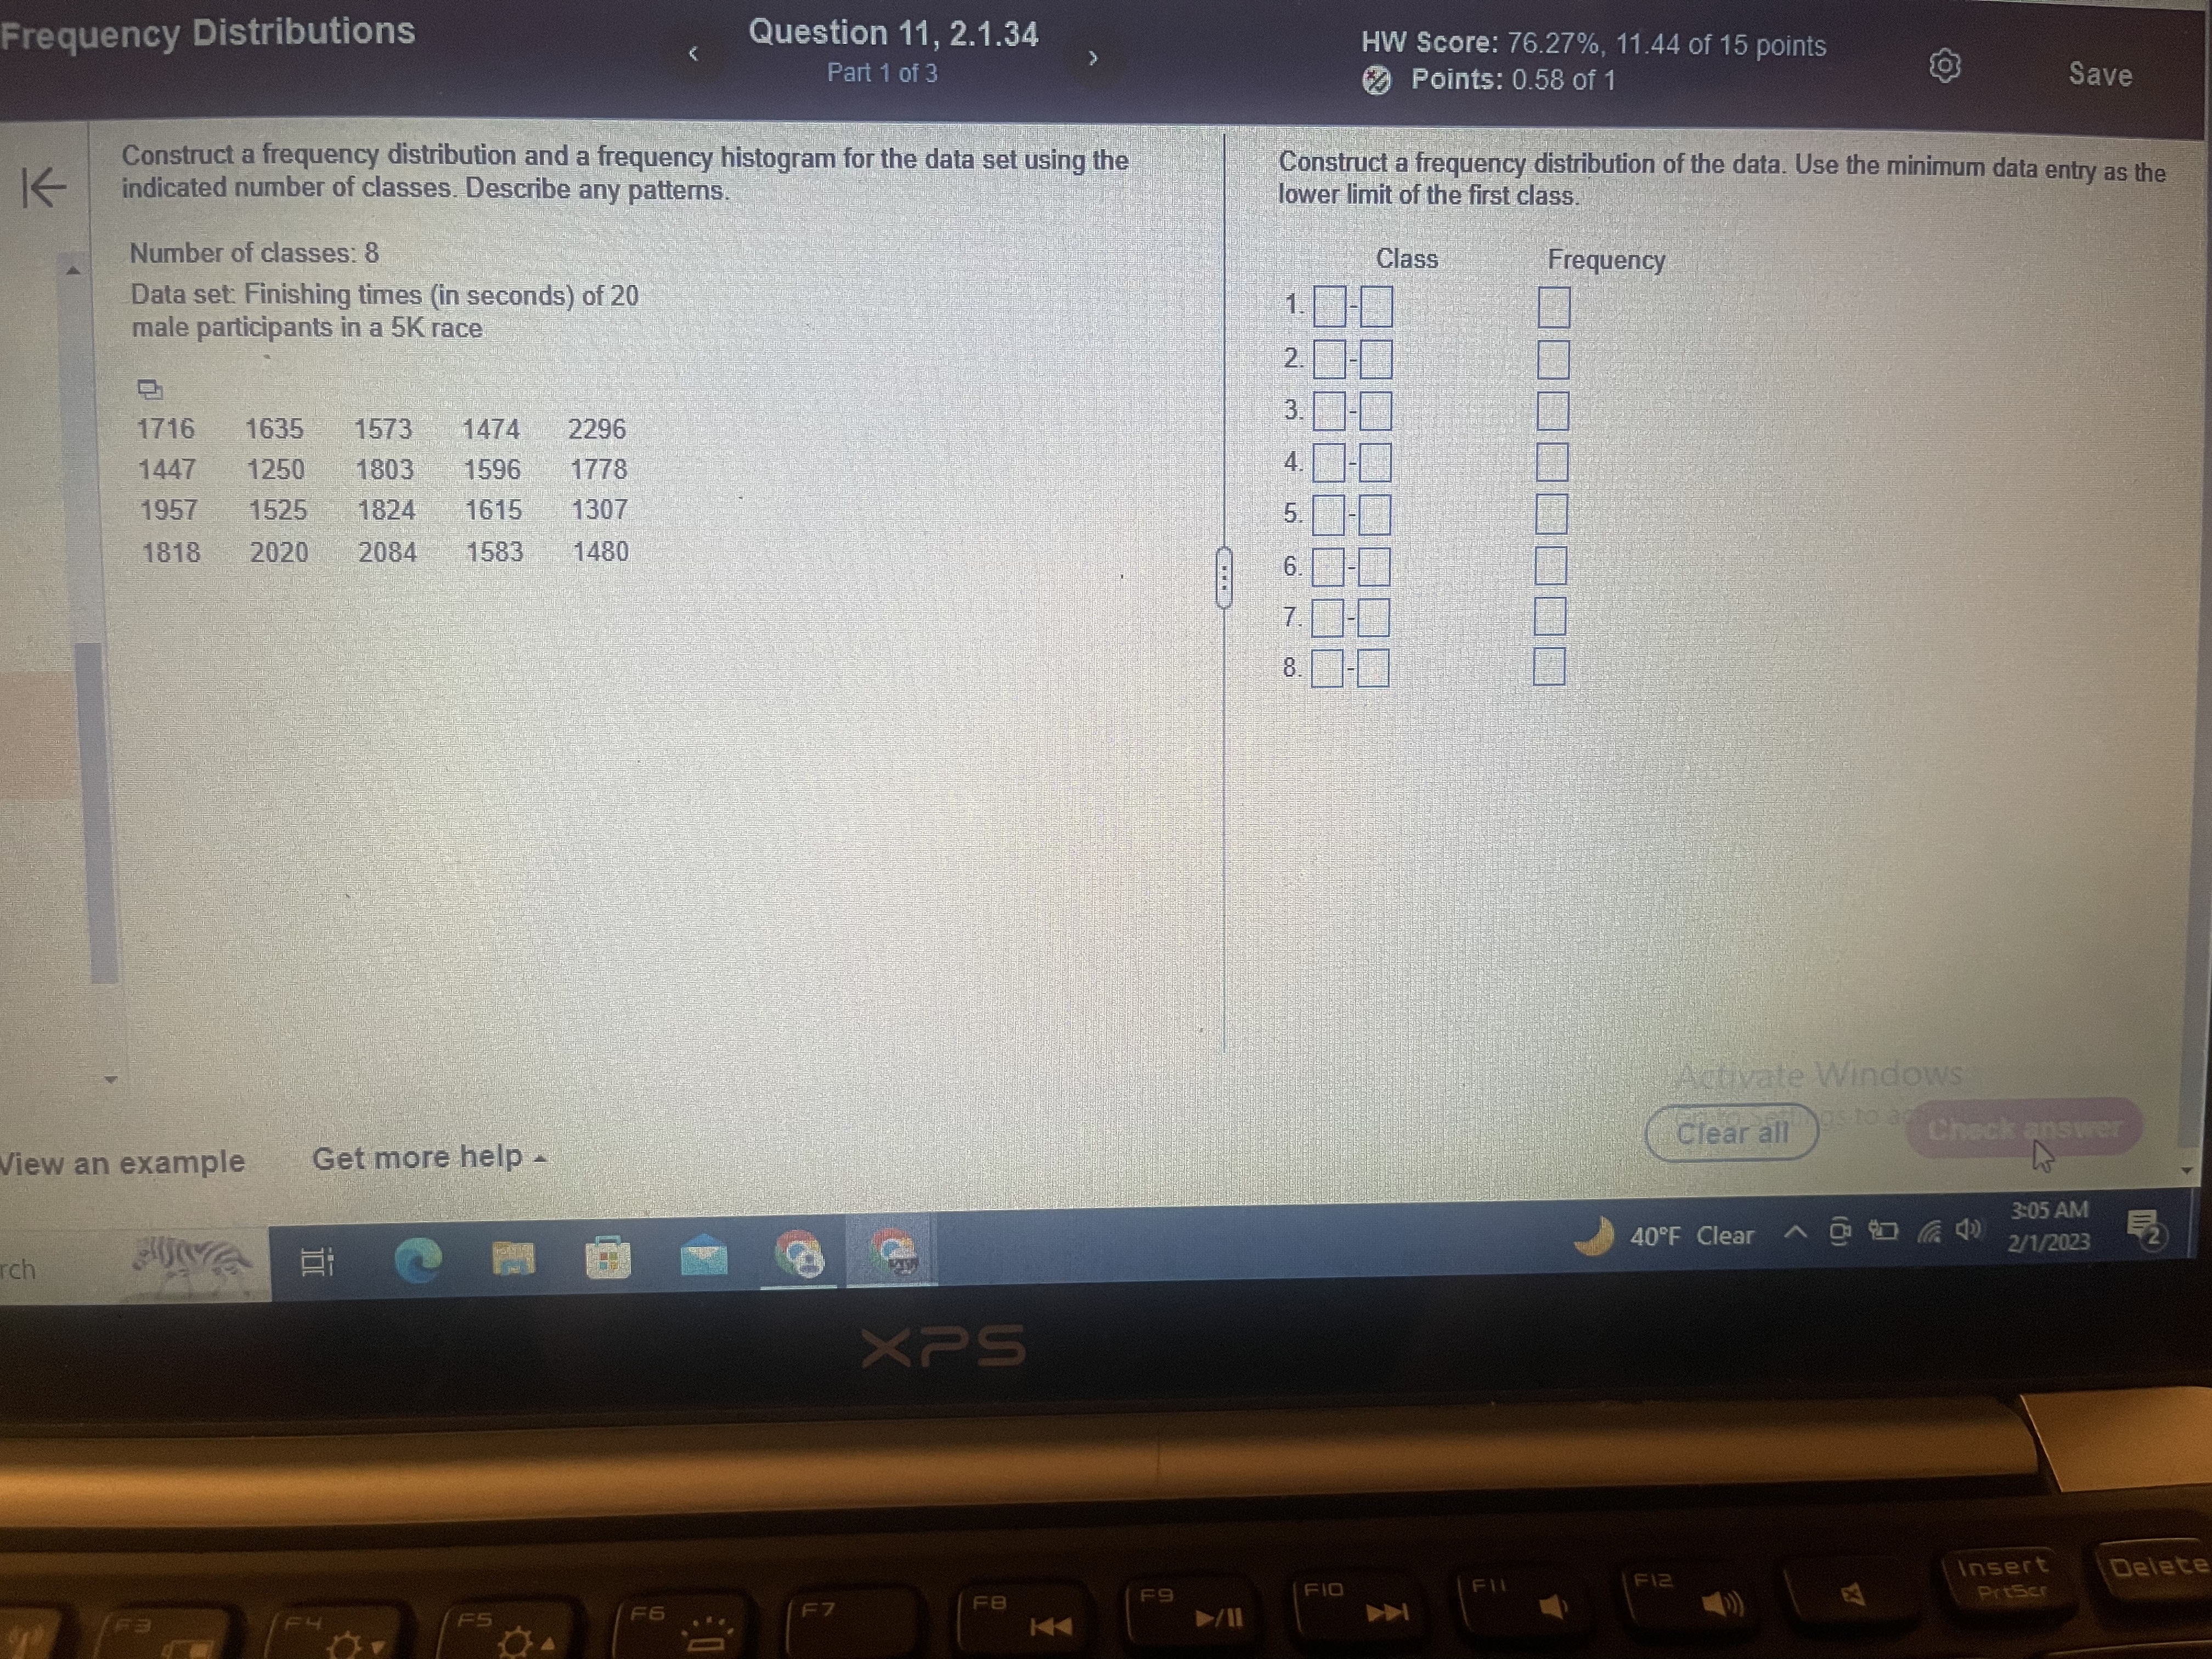
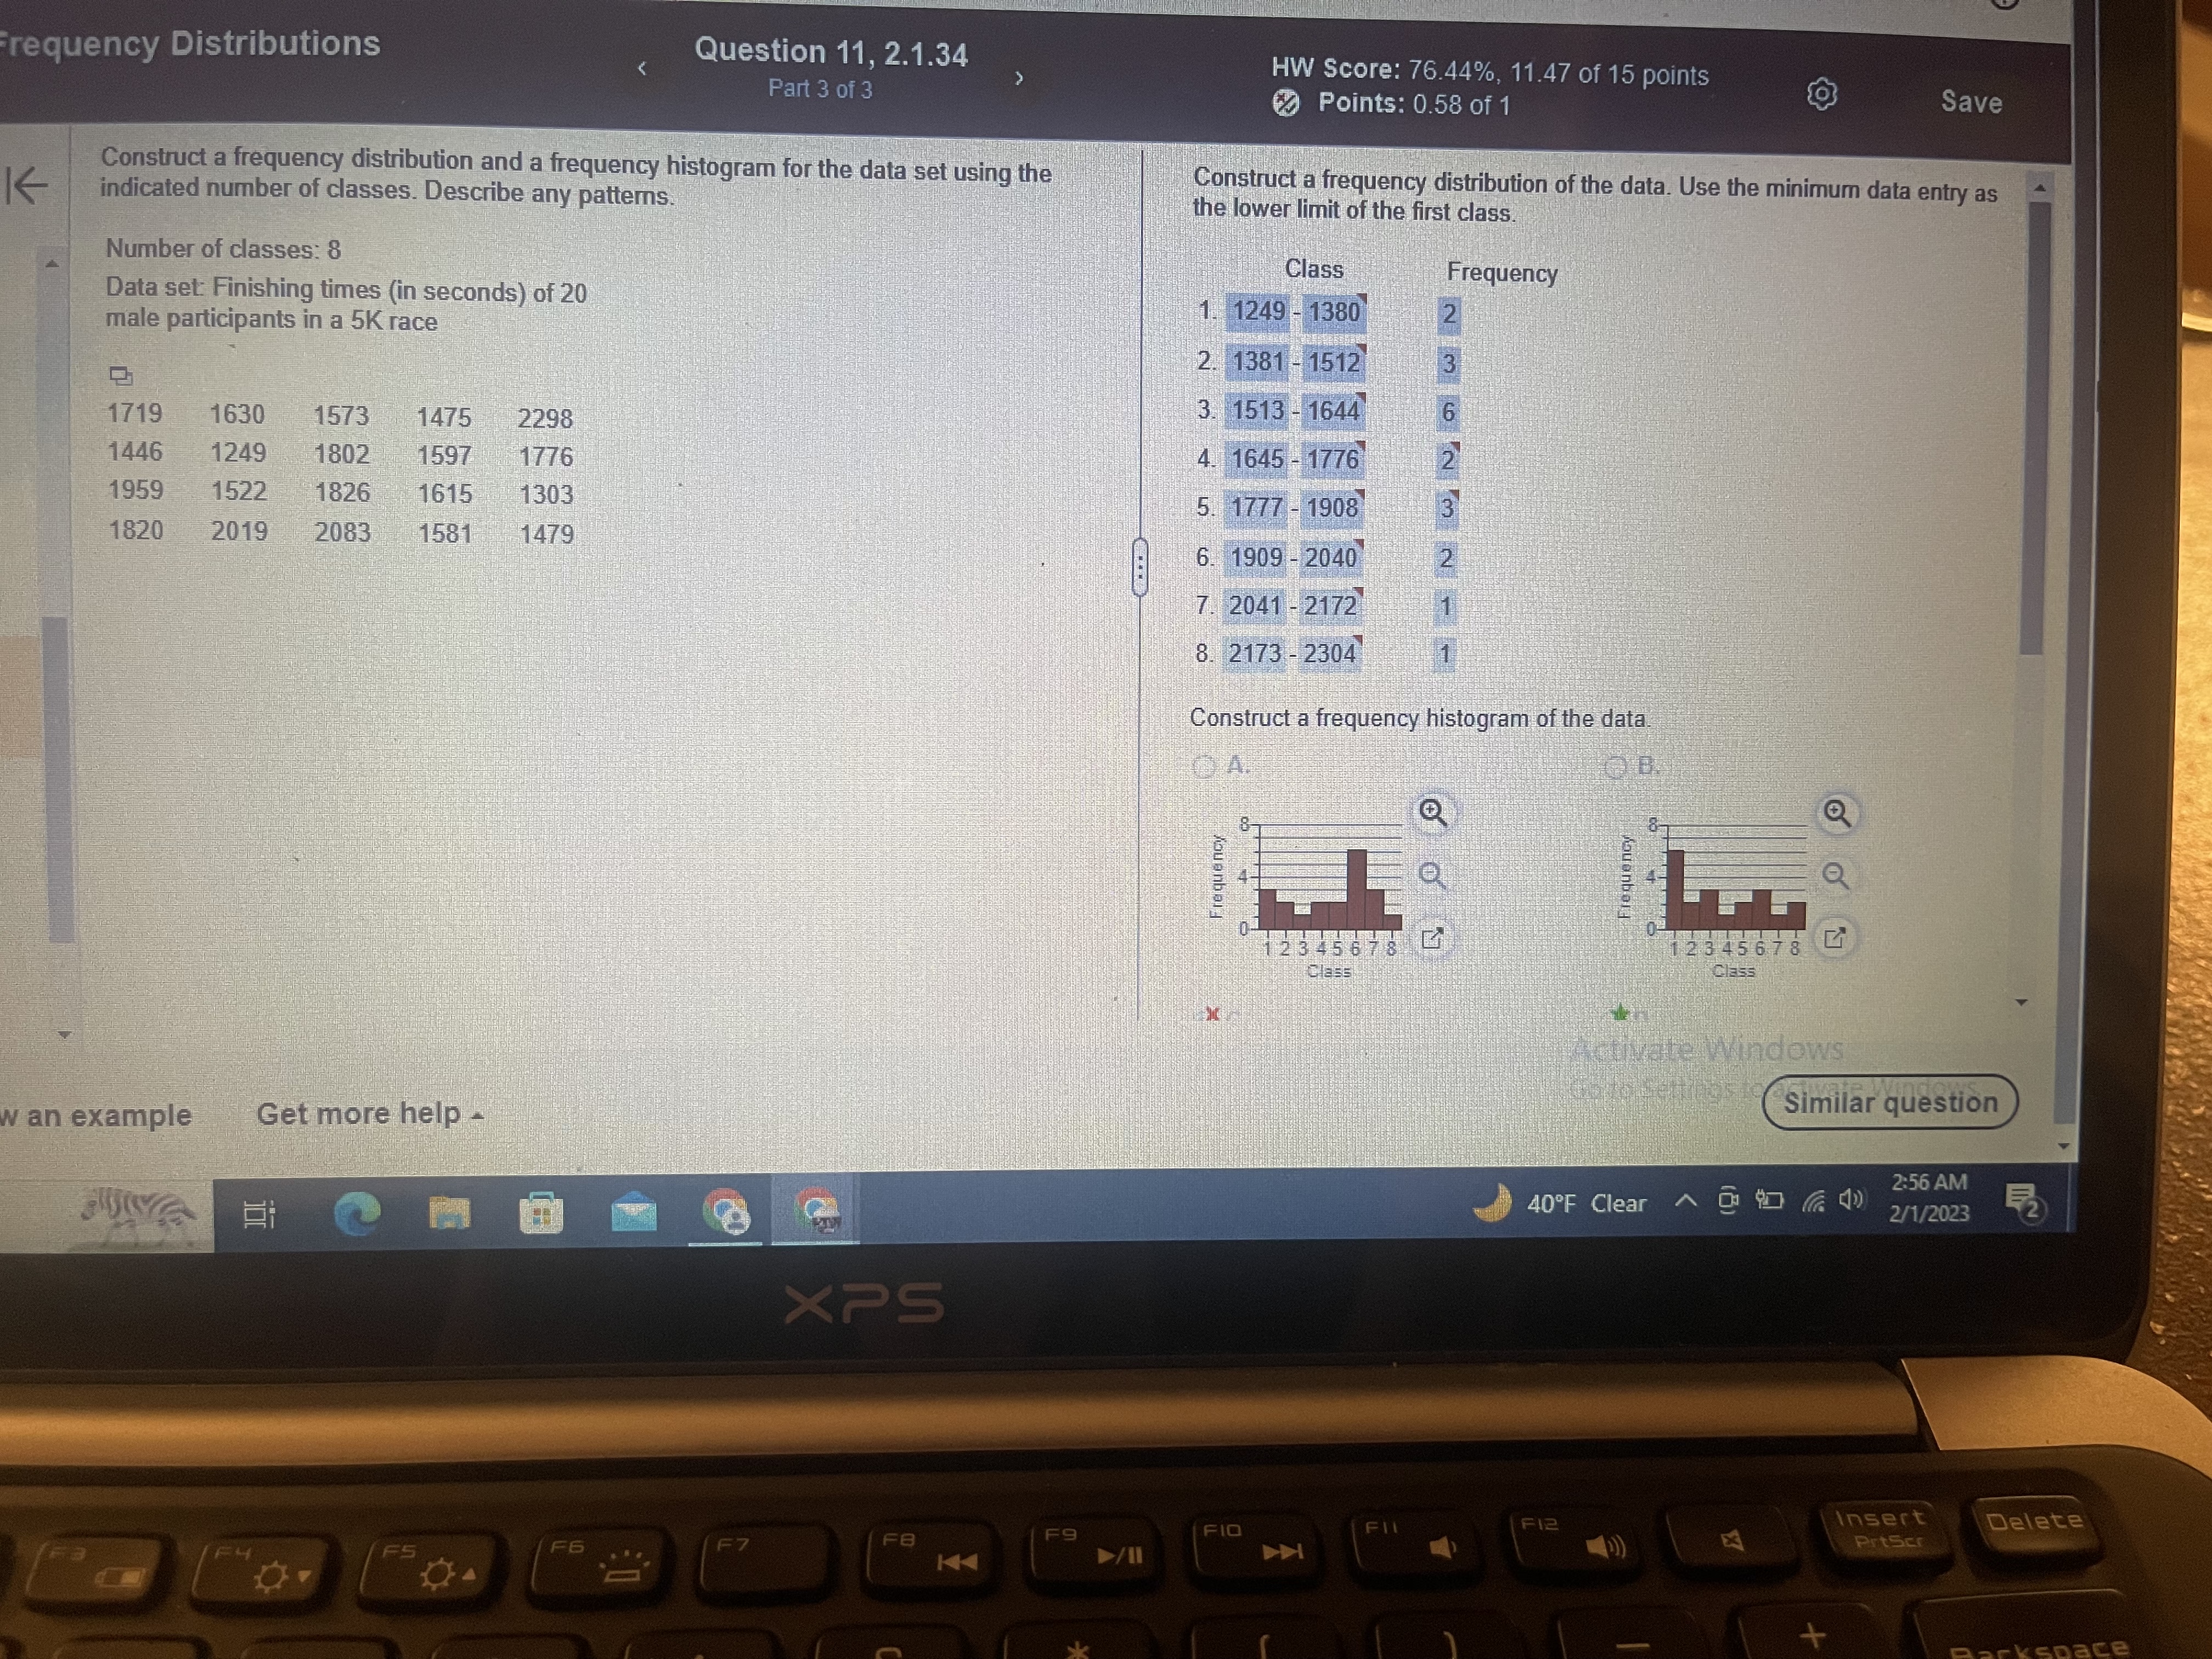
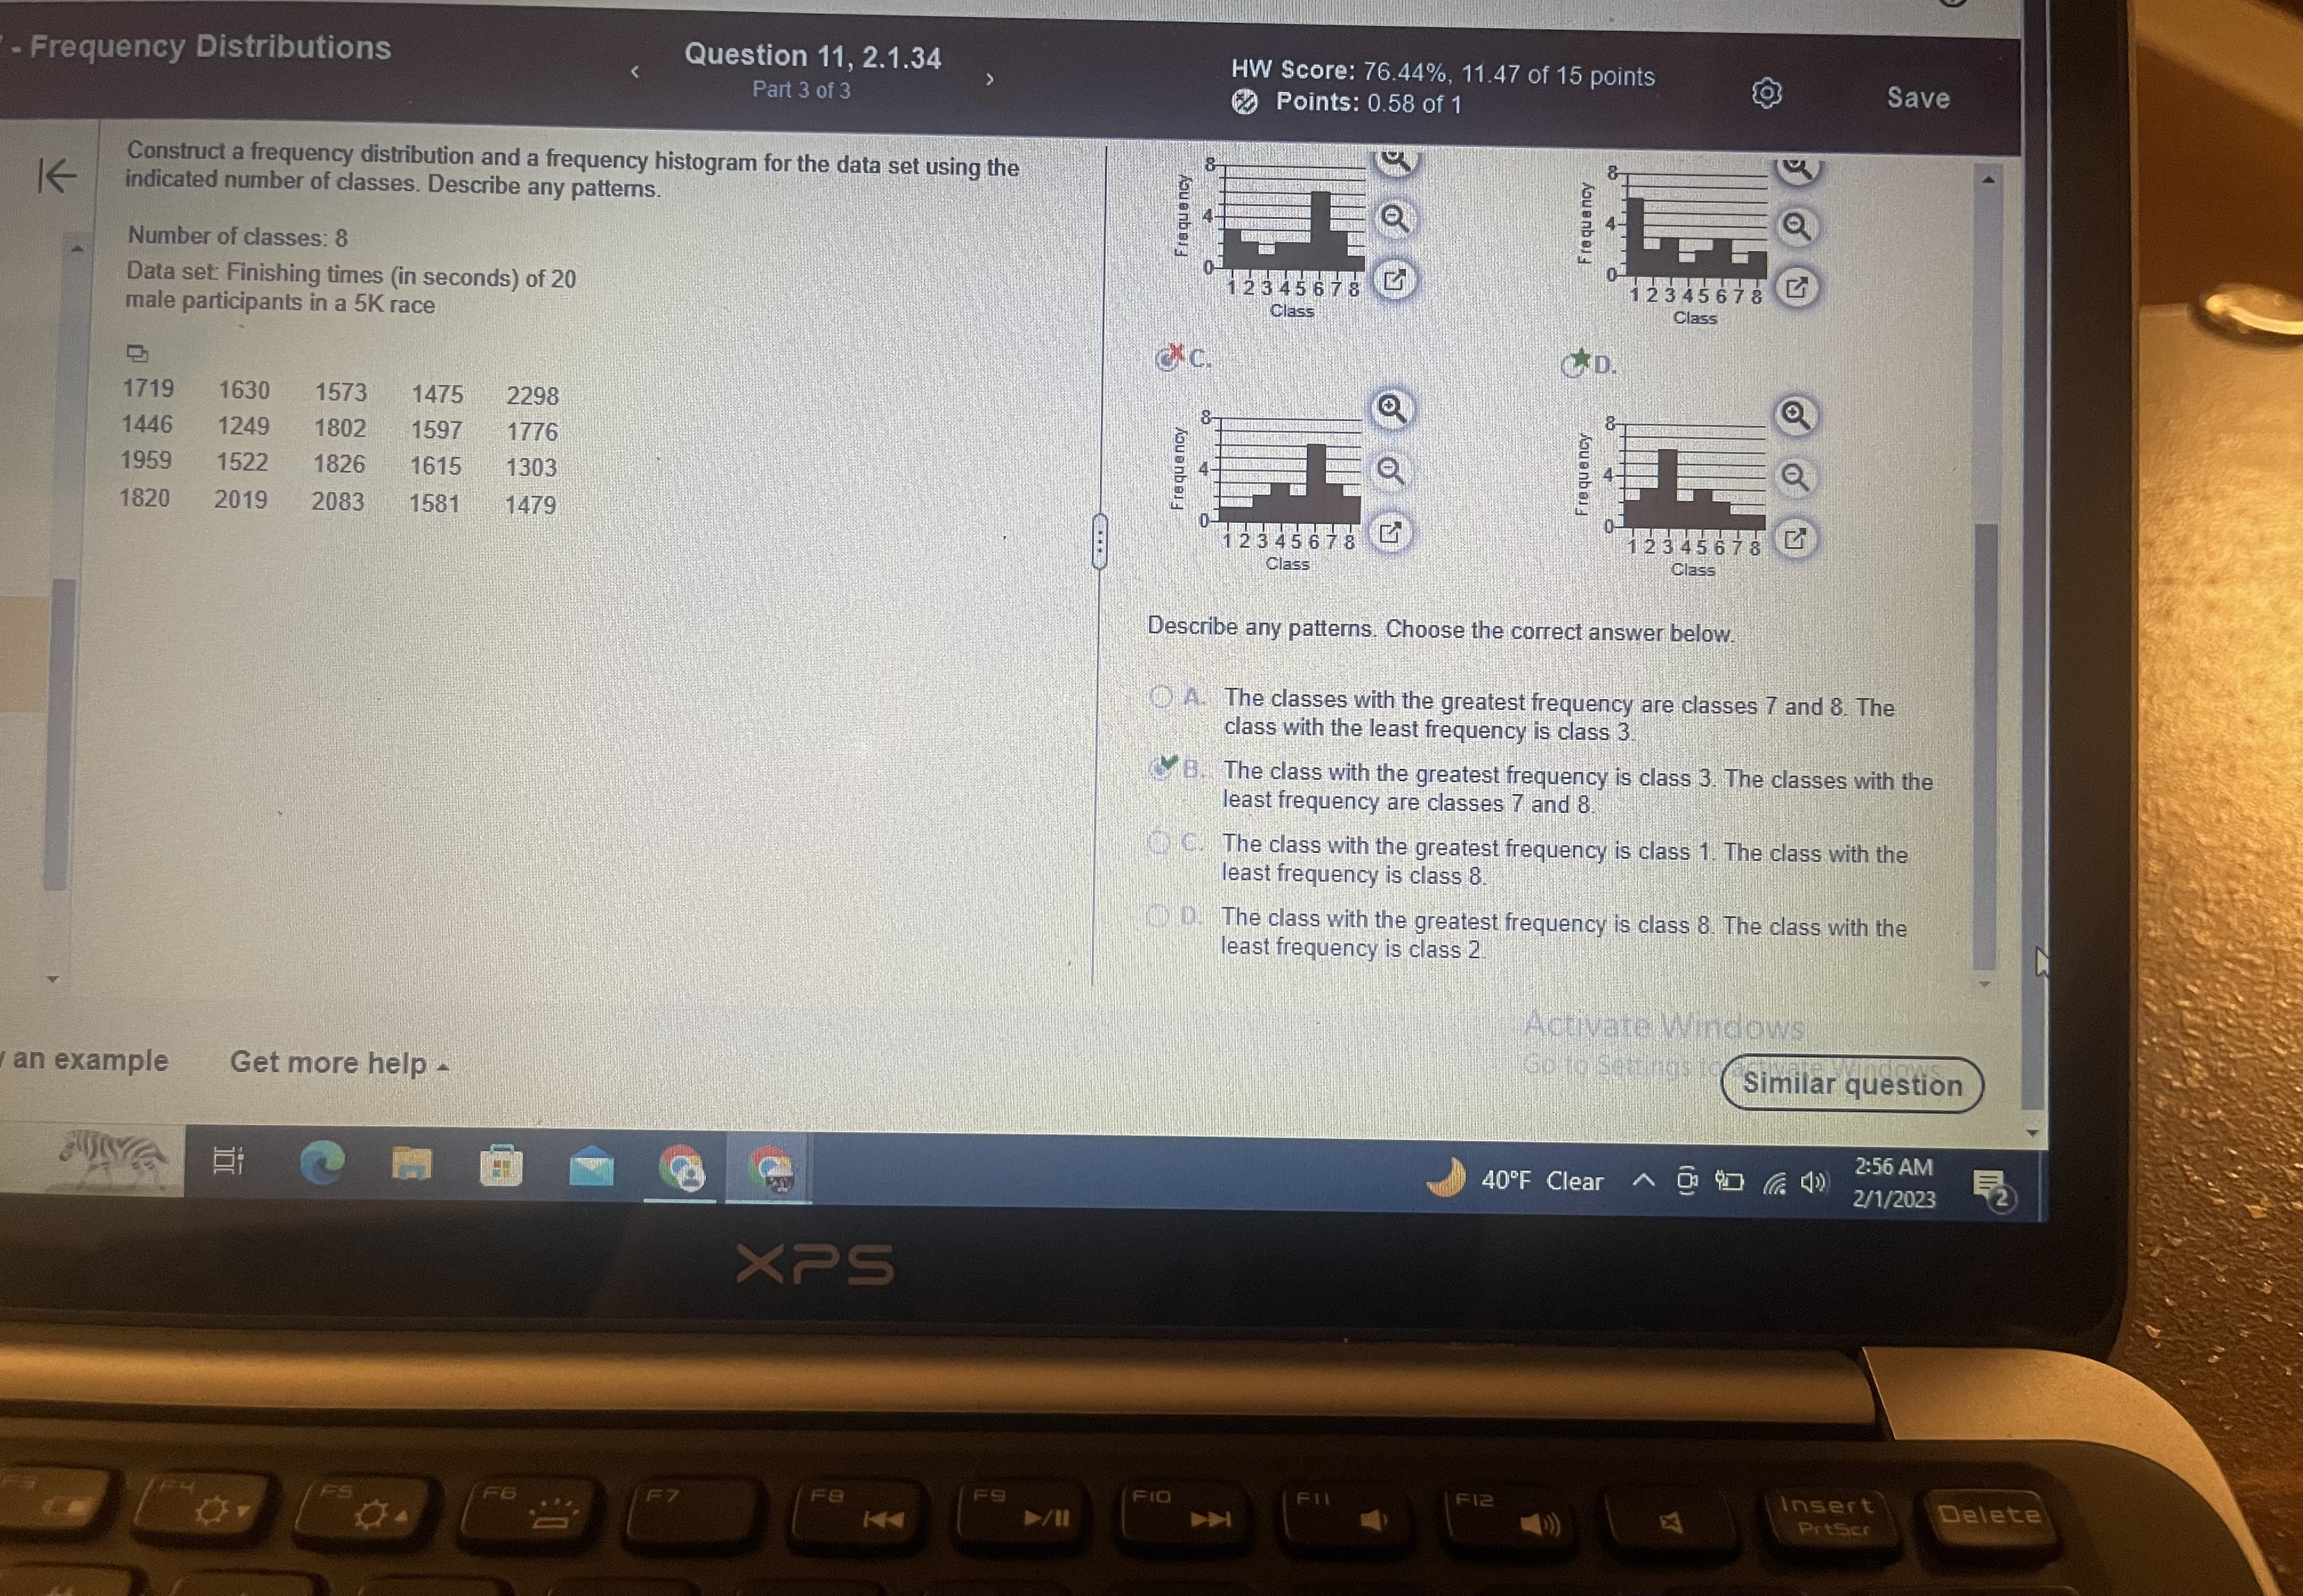
Frequency Distributions Question 11, 2.1.34 Part 1 of 3 > K Construct a frequency distribution and...
Fantastic news! We've Found the answer you've been seeking!
Question:


Transcribed Image Text:
Frequency Distributions Question 11, 2.1.34 Part 1 of 3 > K Construct a frequency distribution and a frequency histogram for the data set using the indicated number of classes. Describe any patterns. Number of classes: 8 Data set: Finishing times (in seconds) of 20 male participants in a 5K race HW Score: 76.27%, 11.44 of 15 points Points: 0.58 of 1 Save Construct a frequency distribution of the data. Use the minimum data entry as the lower limit of the first class. 2. 3. 1716 1635 1573 1474 2296 1447 1250 1803 1596 1778 4. 1957 1818 1525 1824 1615 1307 5. 2020 2084 1583 1480 6 7. View an example Get more help - rch XPS 8. Class Frequency Activate Windows os to ac Clear all Check answer 40F Clear ^ @4) FS F6 F7 FB F9 FIO FIL FIZ K X 3:05 AM 2/1/2023 Insert PrtScr Delete Frequency Distributions Question 11, 2.1.34 Part 3 of 3 K Construct a frequency distribution and a frequency histogram for the data set using the indicated number of classes. Describe any patterns. HW Score: 76.44%, 11.47 of 15 points Points: 0.58 of 1 Save Construct a frequency distribution of the data. Use the minimum data entry as the lower limit of the first class. Number of classes: 8 Data set: Finishing times (in seconds) of 20 male participants in a 5K race Class Frequency 1. 1249-1380 2 2. 1381-1512 3 D 3. 1513-1644 6 1719 1630 1573 1475 2298 1446 1249 1802 1597 1776 1959 1522 1826 1615 1303 1820 2019 4. 1645-1776 5. 1777 1908 3 2083 1581 1479 6. 1909 2040 2 7. 2041-2172 1 8. 2173 2304 1 w an example Get more help - FH FS F6 F7 XPS FB K F9 11/4 Construct a frequency histogram of the data. A. . Frequency L 12345678 G Q FIO FIL F12 Frequency 12345678 G Class Activate Windows Go to Settings to actuate Windows Similar question 2:56 AM 40F Clear ^ 64 2/1/2023 X + Insert PrtScr Delete Barkspace G - Frequency Distributions K Question 11, 2.1.34 Part 3 of 3 Construct a frequency distribution and a frequency histogram for the data set using the indicated number of classes. Describe any patterns. Number of classes: 8 Data set: Finishing times (in seconds) of 20 male participants in a 5K race 1719 1630 1573 1475 2298 1446 1249 1802 1597 1776 1959 1522 1826 1615 1303 1820 2019 2083 1581 1479 w an example Get more help - FS XPS Frequency Frequency . HW Score: 76.44%, 11.47 of 15 points Points: 0.58 of 1 1 2 3 4 5 6 7 8 Class Q Frequency D. L 12345678 Class 1 2 3 4 5 6 7 8 Class G Frequency H 2 Q 12345678 G Class Save Describe any patterns. Choose the correct answer below. OA. The classes with the greatest frequency are classes 7 and 8. The class with the least frequency is class 3. B. The class with the greatest frequency is class 3. The classes with the least frequency are classes 7 and 8. The class with the greatest frequency is class 1. The class with the least frequency is class 8. OD. The class with the greatest frequency is class 8. The class with the least frequency is class 2 Activate Windows Go 160 10 Settings to fatware Landow Similar question F6 F7 FB F9 FIO FII F12 K T 2:56 AM 40F Clear 64 2/1/2023 X Insert Delete PrtScr K The accompanying data set lists the numbers of children of world leaders. Use the data to construct a frequency distribution using six classes a Describe any patterns. Click the icon to view the data set. Complete the frequency distribution table below. Use the minimum data entry as the lower limit of the first class. Class Frequency Midpoint View an example Get more help - earch E XPS D Activ Clear 40F Clear Part 1 of 3 Points: 0.73 of 1 Save K The accompanying data set lists the numbers of children of world leaders. Use the data to construct a frequency distribution using six classes and to create a frequency polygon. Describe any patterns. Click the icon to view the data set Data Set Complete the fr Class Numbers of Children 6 5 3 0 1 17 10 4317 204O 54022 17 0 0 6 5 4 0 6 1 12 8 13 34559t 662172 13 17 9 View an example Get more help - rch Ei Print Done XPS UX 13 Activate Windows ags to a check answer Clear all 40F Clear ^ (64) 3:09 AM 2/1/2023 F4 FS F6 F7 FB F9 FIO FIL F12 K Insert PrtScr E Frequency Distributions Question 10, 2.1.30 Part 1 of 8 HW Score: 76.27%, 11.44 of 15 points Points: 0 of 1 Save Construct a frequency distribution for the given data set using 6 classes. In the table, include the midpoints, relative frequencies, and cumulative frequencies. Which class has the Kgreatest frequency and which has the least frequency? Amount (in dollars) spent on books for a semester 545 224 166 222 338 546 86 470 58 439 539 349 296 64 528 458 438 40 375 253 241 459 261 170 449 334 270 169 58 Complete the table, starting with the lowest class limit. Use the minimum data entry as the lower limit of the first class. (Type integers or decimals. Round the class limits to the nearest whole number. Round all other values to the nearest thousandth as needed.) Class Frequency Midpoint Relative Frequency Cumulative Frequency - View an example Get more help - search 2 XPS Activate Windows Clear all Check answer 40F Clear 3:02 AM 2/1/2023 F3 F4 F5 F6 F7 FB F9 FIO FIL F12 Insert HW-Frequency Distributions s K Question 12, 2.1.36 Part 3 of 3 HW Score: 72.43%, 10.86 of 15 points Points: 0.73 of 1 Save The accompanying data set lists the numbers of children of world leaders. Use the data to construct a frequency distribution using six classes and to create a frequency polygon. Describe any patterns. Click the icon to view the data set Data Set Complete the fr Class Numbers of Children 0-2 22 3 5 2 2 1 16 2 1 2 5 5 1 0 2 1 3-5 4 6 0 3 2 5 4 0 6-8 8 6 0 4 3 8 4 6 9-11 13 9 4 3 14 10 11 14 9 15 10 12-14 15-17 Create a freque Asuonbal 16 109 his View an example Get more help re to search F2 P F3 Asuanbai Print Done 12 8 XPS Noutatibar 12 X FIO F9 FB F6 F7 F5 K FH U & % A D requency 16- Activate Windows to Go to Settings Similar question 40F Clear (1) 3:07 AM 2/1/2023 2 FII F12 X Insert Delete PrtScr + Backspace K The accompanying data set lists the numbers of children of world leaders. Use the data to construct a frequency distribution using six classes and to create a frequency polygon Describe any patterns. BEE Click the icon to view the data set. Create a frequency polygon. Choose the correct graph below. A. Frequency 16- 12 4- 0 0 4 8 12 16 Number of Children auenbo B. 16 12- 0 4 8 12 16 Number of Children Describe any patterns. Choose the correct answer below. A The data show that most of the 43 world leaders had fewer than 6 children. *B The data show that most of the 43 world leaders had more than 11 children. OLC. The data show that most of the 43 world leaders had more than 17 children. On The data show that most of the 43 world leaders had fewer than 2 children View an example Get more help - arch XPS OC. D. 16 16 12 Q 12- & 4 0 -4 0 4 8 121620 Number of Children 0 0 4 8 12 16 Number of Children G L Activate Windows Go to Settings to similar qu questi ^ 40F Clear (4) F6 F7 FB F9 FIO FII F12 FY F5 1 X 3:08 AM 2/1/2023 Insert PrtScr uestion list K Describe any patterns. Click the icon to view the data set. ers of children of world leaders. Use the data to construct a frequency distribution using six classes and to create a frequency polygon. Question 8 Question 9 Complete the frequency distribution table below. Use the minimum data entry as the lower limit of the first class. Class 0-2 Frequency Midpoint 15 3-5 13 3 Question 10 6-8 9-11 Question 11 12-14 15-17 5532 7 10 13 16 Question 12 O Question 13 Create a frequency polygon. Choose the correct graph below. A Kourenbor Help me solve this View an example Get more help - Type here to search Esc BID F2 P F3 FL B 16- 12 Abu anbau XPS 16 12- 8 F5 F6 F7 D FB F9 FIO SJ L # M 3 % 25 <6 W E R T Ve 7 * K OD. 16 Mouanbor Activate Windows Go to Settings toSimilar question Windows! 40F Clear (4) 3:08 AM 2/1/2023 FII F12 0 P K Insert Delete PrtScr + Backspa = - Frequency Distributions K Question 10, 2.1.30 Part 8 of 8 > HW Score: 76.44%, 11.47 of 15 points Points: 0.03 of 1 Save Construct a frequency distribution for the given data set using 6 classes. In the table, include the midpoints, relative frequencies, and cumulative frequencies. Which class has the greatest frequency and which has the least frequency? Amount (in dollars) spent on books for a semester 291 123 514 341 269 535 479 215 79 73 285 522 195 462 306 103 144 443 40 70 208 149 490 169 431 472 449 238 293 Complete the lavie, Staluny will die IuWEST LIDSS MIMIL. USE ME MINmum Udla Emy as me wwel mim vi mi mist Glass. (Type integers or decimals. Round the class limits to the nearest whole number. Round all other values to the nearest thousandth as needed.) Class 40-122 Frequency 5 Midpoint 81 Relative Frequency Cumulative 0.172 Frequency 5 123-205 5 164 0.172 10 206 - 288 5 247 0.172 15 289-371 330 0.138 19 372-454 3 413 0.103 22 455 - 537 7 496 0.241 29 Which class has the greatest frequency? The class with the greatest frequency is from 455 to 537 Which class has the least frequency? The class with the least frequency is from 372 to 454 View an example Get more help - o search F2 P F3 F4 XPS Activate Windows Ubito Settings toSimilar question 2:44 AM A 40F Clear ^ (61) 2/1/2023 F5 F6 F7 FB F9 FIO FIL F12 Insert PrtScr Delete KA Frequency Distributions Question 11, 2.1.34 Part 1 of 3 > K Construct a frequency distribution and a frequency histogram for the data set using the indicated number of classes. Describe any patterns. Number of classes: 8 Data set: Finishing times (in seconds) of 20 male participants in a 5K race HW Score: 76.27%, 11.44 of 15 points Points: 0.58 of 1 Save Construct a frequency distribution of the data. Use the minimum data entry as the lower limit of the first class. 2. 3. 1716 1635 1573 1474 2296 1447 1250 1803 1596 1778 4. 1957 1818 1525 1824 1615 1307 5. 2020 2084 1583 1480 6 7. View an example Get more help - rch XPS 8. Class Frequency Activate Windows os to ac Clear all Check answer 40F Clear ^ @4) FS F6 F7 FB F9 FIO FIL FIZ K X 3:05 AM 2/1/2023 Insert PrtScr Delete Frequency Distributions Question 11, 2.1.34 Part 3 of 3 K Construct a frequency distribution and a frequency histogram for the data set using the indicated number of classes. Describe any patterns. HW Score: 76.44%, 11.47 of 15 points Points: 0.58 of 1 Save Construct a frequency distribution of the data. Use the minimum data entry as the lower limit of the first class. Number of classes: 8 Data set: Finishing times (in seconds) of 20 male participants in a 5K race Class Frequency 1. 1249-1380 2 2. 1381-1512 3 D 3. 1513-1644 6 1719 1630 1573 1475 2298 1446 1249 1802 1597 1776 1959 1522 1826 1615 1303 1820 2019 4. 1645-1776 5. 1777 1908 3 2083 1581 1479 6. 1909 2040 2 7. 2041-2172 1 8. 2173 2304 1 w an example Get more help - FH FS F6 F7 XPS FB K F9 11/4 Construct a frequency histogram of the data. A. . Frequency L 12345678 G Q FIO FIL F12 Frequency 12345678 G Class Activate Windows Go to Settings to actuate Windows Similar question 2:56 AM 40F Clear ^ 64 2/1/2023 X + Insert PrtScr Delete Barkspace G - Frequency Distributions K Question 11, 2.1.34 Part 3 of 3 Construct a frequency distribution and a frequency histogram for the data set using the indicated number of classes. Describe any patterns. Number of classes: 8 Data set: Finishing times (in seconds) of 20 male participants in a 5K race 1719 1630 1573 1475 2298 1446 1249 1802 1597 1776 1959 1522 1826 1615 1303 1820 2019 2083 1581 1479 w an example Get more help - FS XPS Frequency Frequency . HW Score: 76.44%, 11.47 of 15 points Points: 0.58 of 1 1 2 3 4 5 6 7 8 Class Q Frequency D. L 12345678 Class 1 2 3 4 5 6 7 8 Class G Frequency H 2 Q 12345678 G Class Save Describe any patterns. Choose the correct answer below. OA. The classes with the greatest frequency are classes 7 and 8. The class with the least frequency is class 3. B. The class with the greatest frequency is class 3. The classes with the least frequency are classes 7 and 8. The class with the greatest frequency is class 1. The class with the least frequency is class 8. OD. The class with the greatest frequency is class 8. The class with the least frequency is class 2 Activate Windows Go 160 10 Settings to fatware Landow Similar question F6 F7 FB F9 FIO FII F12 K T 2:56 AM 40F Clear 64 2/1/2023 X Insert Delete PrtScr K The accompanying data set lists the numbers of children of world leaders. Use the data to construct a frequency distribution using six classes a Describe any patterns. Click the icon to view the data set. Complete the frequency distribution table below. Use the minimum data entry as the lower limit of the first class. Class Frequency Midpoint View an example Get more help - earch E XPS D Activ Clear 40F Clear Part 1 of 3 Points: 0.73 of 1 Save K The accompanying data set lists the numbers of children of world leaders. Use the data to construct a frequency distribution using six classes and to create a frequency polygon. Describe any patterns. Click the icon to view the data set Data Set Complete the fr Class Numbers of Children 6 5 3 0 1 17 10 4317 204O 54022 17 0 0 6 5 4 0 6 1 12 8 13 34559t 662172 13 17 9 View an example Get more help - rch Ei Print Done XPS UX 13 Activate Windows ags to a check answer Clear all 40F Clear ^ (64) 3:09 AM 2/1/2023 F4 FS F6 F7 FB F9 FIO FIL F12 K Insert PrtScr E Frequency Distributions Question 10, 2.1.30 Part 1 of 8 HW Score: 76.27%, 11.44 of 15 points Points: 0 of 1 Save Construct a frequency distribution for the given data set using 6 classes. In the table, include the midpoints, relative frequencies, and cumulative frequencies. Which class has the Kgreatest frequency and which has the least frequency? Amount (in dollars) spent on books for a semester 545 224 166 222 338 546 86 470 58 439 539 349 296 64 528 458 438 40 375 253 241 459 261 170 449 334 270 169 58 Complete the table, starting with the lowest class limit. Use the minimum data entry as the lower limit of the first class. (Type integers or decimals. Round the class limits to the nearest whole number. Round all other values to the nearest thousandth as needed.) Class Frequency Midpoint Relative Frequency Cumulative Frequency - View an example Get more help - search 2 XPS Activate Windows Clear all Check answer 40F Clear 3:02 AM 2/1/2023 F3 F4 F5 F6 F7 FB F9 FIO FIL F12 Insert HW-Frequency Distributions s K Question 12, 2.1.36 Part 3 of 3 HW Score: 72.43%, 10.86 of 15 points Points: 0.73 of 1 Save The accompanying data set lists the numbers of children of world leaders. Use the data to construct a frequency distribution using six classes and to create a frequency polygon. Describe any patterns. Click the icon to view the data set Data Set Complete the fr Class Numbers of Children 0-2 22 3 5 2 2 1 16 2 1 2 5 5 1 0 2 1 3-5 4 6 0 3 2 5 4 0 6-8 8 6 0 4 3 8 4 6 9-11 13 9 4 3 14 10 11 14 9 15 10 12-14 15-17 Create a freque Asuonbal 16 109 his View an example Get more help re to search F2 P F3 Asuanbai Print Done 12 8 XPS Noutatibar 12 X FIO F9 FB F6 F7 F5 K FH U & % A D requency 16- Activate Windows to Go to Settings Similar question 40F Clear (1) 3:07 AM 2/1/2023 2 FII F12 X Insert Delete PrtScr + Backspace K The accompanying data set lists the numbers of children of world leaders. Use the data to construct a frequency distribution using six classes and to create a frequency polygon Describe any patterns. BEE Click the icon to view the data set. Create a frequency polygon. Choose the correct graph below. A. Frequency 16- 12 4- 0 0 4 8 12 16 Number of Children auenbo B. 16 12- 0 4 8 12 16 Number of Children Describe any patterns. Choose the correct answer below. A The data show that most of the 43 world leaders had fewer than 6 children. *B The data show that most of the 43 world leaders had more than 11 children. OLC. The data show that most of the 43 world leaders had more than 17 children. On The data show that most of the 43 world leaders had fewer than 2 children View an example Get more help - arch XPS OC. D. 16 16 12 Q 12- & 4 0 -4 0 4 8 121620 Number of Children 0 0 4 8 12 16 Number of Children G L Activate Windows Go to Settings to similar qu questi ^ 40F Clear (4) F6 F7 FB F9 FIO FII F12 FY F5 1 X 3:08 AM 2/1/2023 Insert PrtScr uestion list K Describe any patterns. Click the icon to view the data set. ers of children of world leaders. Use the data to construct a frequency distribution using six classes and to create a frequency polygon. Question 8 Question 9 Complete the frequency distribution table below. Use the minimum data entry as the lower limit of the first class. Class 0-2 Frequency Midpoint 15 3-5 13 3 Question 10 6-8 9-11 Question 11 12-14 15-17 5532 7 10 13 16 Question 12 O Question 13 Create a frequency polygon. Choose the correct graph below. A Kourenbor Help me solve this View an example Get more help - Type here to search Esc BID F2 P F3 FL B 16- 12 Abu anbau XPS 16 12- 8 F5 F6 F7 D FB F9 FIO SJ L # M 3 % 25 <6 W E R T Ve 7 * K OD. 16 Mouanbor Activate Windows Go to Settings toSimilar question Windows! 40F Clear (4) 3:08 AM 2/1/2023 FII F12 0 P K Insert Delete PrtScr + Backspa = - Frequency Distributions K Question 10, 2.1.30 Part 8 of 8 > HW Score: 76.44%, 11.47 of 15 points Points: 0.03 of 1 Save Construct a frequency distribution for the given data set using 6 classes. In the table, include the midpoints, relative frequencies, and cumulative frequencies. Which class has the greatest frequency and which has the least frequency? Amount (in dollars) spent on books for a semester 291 123 514 341 269 535 479 215 79 73 285 522 195 462 306 103 144 443 40 70 208 149 490 169 431 472 449 238 293 Complete the lavie, Staluny will die IuWEST LIDSS MIMIL. USE ME MINmum Udla Emy as me wwel mim vi mi mist Glass. (Type integers or decimals. Round the class limits to the nearest whole number. Round all other values to the nearest thousandth as needed.) Class 40-122 Frequency 5 Midpoint 81 Relative Frequency Cumulative 0.172 Frequency 5 123-205 5 164 0.172 10 206 - 288 5 247 0.172 15 289-371 330 0.138 19 372-454 3 413 0.103 22 455 - 537 7 496 0.241 29 Which class has the greatest frequency? The class with the greatest frequency is from 455 to 537 Which class has the least frequency? The class with the least frequency is from 372 to 454 View an example Get more help - o search F2 P F3 F4 XPS Activate Windows Ubito Settings toSimilar question 2:44 AM A 40F Clear ^ (61) 2/1/2023 F5 F6 F7 FB F9 FIO FIL F12 Insert PrtScr Delete KA
Expert Answer:

Posted Date:
Students also viewed these mathematics questions
-
Mike and Linda are a married couple who file jointly and have $100,000 of taxable income. They have three dependent children who are full-time students in 2022. Mike and Linda provided $8,000 of...
-
Current position analysis The following data were taken from the balance sheet of Beatty Company: A. Determine for each yare l (1) the working capita (2) the current ratio, (3) the quick ratio. Round...
-
The essence of decentralization is the use of profit centresa. Do you agree? Explain.
-
The Reno Company manufactures Part No. 498 for use in its production cycle. The cost per unit for 20,000 units of Part No. 498 is as follows: The Tray Company has offered to sell 20,000 units of Part...
-
Normal and abnormal spoilage in units. The following data, in physical units, describe a grinding process for January: Inspection occurs at the 100% completion stage. Normal spoilage is 5% of the...
-
2 2 u = 7x-7y V = -14 xy + 3x +Z+xz W = 7 xx-y+x
-
Explain assembly language program with the help of an example, which displays the Bio-data of a student comprising of following data; name, f-name, roll-no, semester, last-GPA, department,...
-
mework B K Question 6, EF11-20 (similar to) Part 1 of 5 County Company had the following partially completed payroll register. (Click the icon to view the partial payroll register.) Read the...
-
An airplane performing a trick flies directly upwards at 80.7 m/s, then cuts their engine and freefalls until they are 171.1 m below their initial starting point. Determine the plane's final velocity
-
James is planing an investment strategy for a four-year period, which the goal of having the largest possible amount of cash on hand after the four years. He has some revenue from a combination of an...
-
To provide the pulse of energy needed for an intense bass, some car stereo systems add capacitors. One system uses a 1.6F capacitor charged to 24 V , double the normal 12 V provided by the car's...
-
Omega Co. has annual sales of $250,000, costs of goods sold of $168,000, and assets of $335,000. Accounts receivable are $82,600. What is the receivables turnover?
-
How can performance appraisals be administered properly to help both the organization and employees?
-
In Exercises, find the equation of the tangent line at the given point on each curve. 2y 2 - x = 4; (16, 2)

Study smarter with the SolutionInn App