

International Tele-Space Corporation (ITSC) has two divisions, Telecommunication Services and Aerospace. As of the end of its
Question:
International Tele-Space Corporation (ITSC) has two divisions, Telecommunication Services and Aerospace. As of the end of its fiscal year on August 31, 2007, ITSC had 37 million shares outstanding with today’s market price of $50.00 and a P/E ratio of 18.50 times. ITSC has $184 million bonds on its balance sheet and the bonds have been rated AA with trading price at their face value. The Company pays the interest payment at the rate of T-bond rate plus the spread based on its bond rating. The current beta for the Company is 1.30 with income tax rate of 35%.
New Investment Opportunity
The Company has won a 10-year government contract to produce the latest model of secret space weapon. To accomplish this, ITSC has established a wholly owned division, Space Industrial Complex (SIC), for the production.
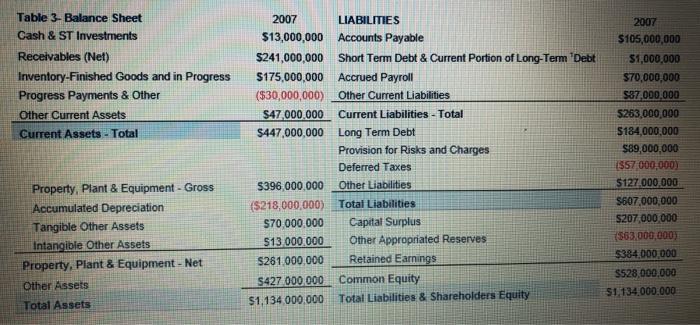
The new division will require a $100 million investment. ITSC has already funded $20 million from its internal funds for this investment and is seeking to determine whether the remaining funds should come from its 2007 income or finance it with all equity or a combination of new debt and equity. The Company is also uncertain about the impact of new debt on its bond rating and capital structure, and would like to know which of the following capital structures (debt-equity ratio) as shown in Table-1 would result in highest value for the investment and shareholders.
- What is the current EPS?
- What are the EPS for each proposed capital structure?
- What is the current interest coverage ratio?
- What are the interest coverage ratio for each proposed capital structure?
- What is the current cost of equity and WACC?
- What are the weighted average costs of capitals (WACC) for each proposed capital structure?
| Shares Outstanding | 37M | Table 1 - Relationship Between Spread, Bond Rating, and Capital Structure | Operating Income | $4,000,000 | ||||
| Market price | $ 50.00 | D/E | Spread | Rating | Earnings Before Interest & Taxes (EBIT) | $169,571,154 | ||
| P/E | 18.5 | 0.00% | 0.75% | AAA | Interest Expense On Debt | $15,725,000 | ||
| Bonds payable | 184M | 5.00% | 1.00% | AAA | Pretax Income | $153,846,154 | ||
| Bonds Rating | AA | 10.00% | 1.50% | AA | Income Taxes | $53,846,154 | ||
| beta | 1.3 | 25.00% | 2.00% | A | Net Income After Taxes | $100,000,000 | ||
| Tax Rate | 35% | 50.00% | 5.75% | B+ | ||||
| 75.00% | 13.00% | CC | ||||||
| Table 4- Income Statement | 2007 | ||||
| Net Sales or Revenues | $1,634,571,154 | Table 5 Market Information | |||
| Cost of Goods Sold | ($1,102,000,000) | Securities | Treasuries | ||
| Depreciation, Depletion & Amortization | ($35,000,000) | Bills | Bonds | ||
| Gross Income | $497,571,154 | Yields: in 2007 | 5% | 7% | |
| Selling, General & Admin Expenses | $324,000,000 | Market Risk Premium | 8% | 6% | |
Expert Answer:
ANSWER Earnings per percentage EPS is the portion of an agencys profit allocated to every outstanding percentage of common inventory EPS for an enterprise with favored and not unusual inventory net pr... View the full answer


Statistics The Art and Science of Learning from Data
ISBN: 978-0321755940
3rd edition
Authors: Alan Agresti, Christine A. Franklin
