

Inventory/Quantity Discount Model Data Enter the data in the shaded area. The minimum quantity is the...
Fantastic news! We've Found the answer you've been seeking!
Question:
Transcribed Image Text:
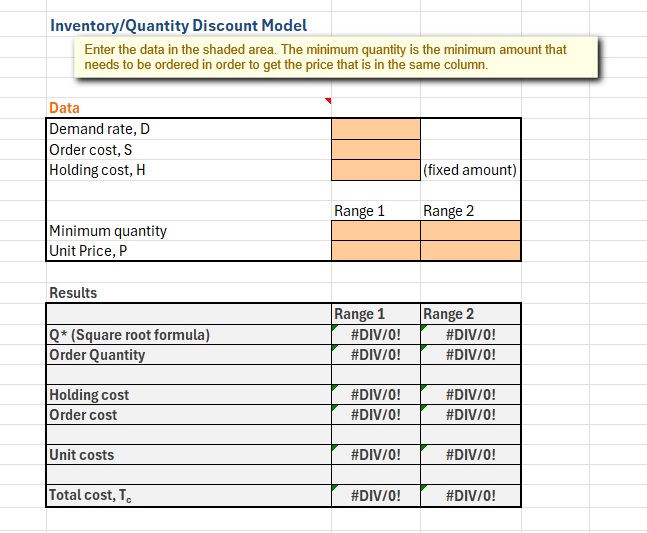
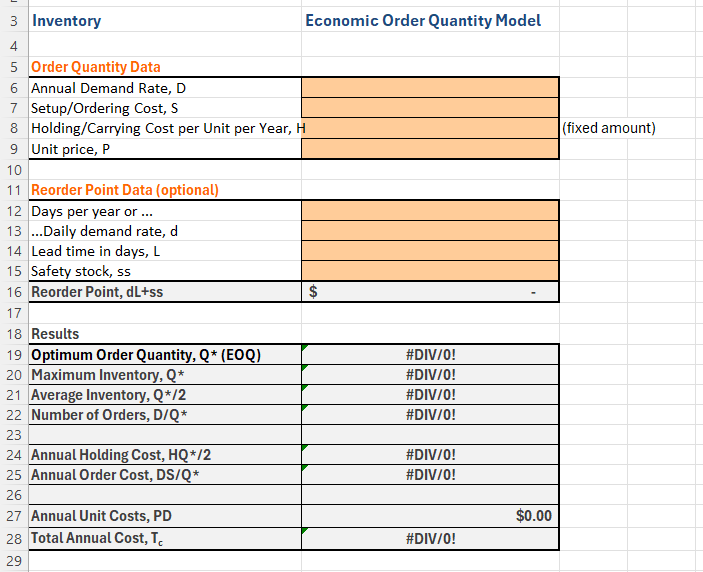
Inventory/Quantity Discount Model Data Enter the data in the shaded area. The minimum quantity is the minimum amount that needs to be ordered in order to get the price that is in the same column. Demand rate, D Order cost, S Holding cost, H (fixed amount) Range 1 Range 2 Minimum quantity Unit Price, P Results Range 1 Range 2 Q* (Square root formula) #DIV/0! #DIV/O! Order Quantity #DIV/O! #DIV/O! Holding cost #DIV/O! #DIV/O! Order cost #DIV/O! #DIV/0! Unit costs #DIV/O! #DIV/0! Total cost, T #DIV/0! #DIV/0! 3 Inventory 4 5 Order Quantity Data 6 Annual Demand Rate, D 7 Setup/Ordering Cost, S 8 Holding/Carrying Cost per Unit per Year, H 9 Unit price, P 10 11 Reorder Point Data (optional) 12 Days per year or ... 13...Daily demand rate, d 14 Lead time in days, L 15 Safety stock, ss 16 Reorder Point, dL+ss 17 18 Results 19 Optimum Order Quantity, Q* (EOQ) 20 Maximum Inventory, Q* Economic Order Quantity Model $ #DIV/O! #DIV/0! 21 Average Inventory, Q*/2 #DIV/O! 22 Number of Orders, D/Q* #DIV/O! 23 24 Annual Holding Cost, HQ*/2 #DIV/O! 25 Annual Order Cost, DS/Q* #DIV/O! 26 27 Annual Unit Costs, PD $0.00 28 Total Annual Cost, T 29 #DIV/O! (fixed amount) Inventory/Quantity Discount Model Data Enter the data in the shaded area. The minimum quantity is the minimum amount that needs to be ordered in order to get the price that is in the same column. Demand rate, D Order cost, S Holding cost, H (fixed amount) Range 1 Range 2 Minimum quantity Unit Price, P Results Range 1 Range 2 Q* (Square root formula) #DIV/0! #DIV/O! Order Quantity #DIV/O! #DIV/O! Holding cost #DIV/O! #DIV/O! Order cost #DIV/O! #DIV/0! Unit costs #DIV/O! #DIV/0! Total cost, T #DIV/0! #DIV/0! 3 Inventory 4 5 Order Quantity Data 6 Annual Demand Rate, D 7 Setup/Ordering Cost, S 8 Holding/Carrying Cost per Unit per Year, H 9 Unit price, P 10 11 Reorder Point Data (optional) 12 Days per year or ... 13...Daily demand rate, d 14 Lead time in days, L 15 Safety stock, ss 16 Reorder Point, dL+ss 17 18 Results 19 Optimum Order Quantity, Q* (EOQ) 20 Maximum Inventory, Q* Economic Order Quantity Model $ #DIV/O! #DIV/0! 21 Average Inventory, Q*/2 #DIV/O! 22 Number of Orders, D/Q* #DIV/O! 23 24 Annual Holding Cost, HQ*/2 #DIV/O! 25 Annual Order Cost, DS/Q* #DIV/O! 26 27 Annual Unit Costs, PD $0.00 28 Total Annual Cost, T 29 #DIV/O! (fixed amount)
Expert Answer:

Posted Date:
Students also viewed these finance questions
-
What are the three main ways in which interest groups use the courts to affect public policy? Discuss one example of a successful use of the courts by an interest group.
-
Discuss how lean systems might apply to a fast-food hamburger stand. How will it have to be modified to deal with daily demand variation?
-
Apex Trucking purchased a truck for $ 100,000 on January 1, 2020. The useful life of the truck was estimated to be either five years or 200,000 miles. Salvage value was estimated at $20,000. Over the...
-
The 2014 financial statements of LVMH Moet Hennessey-Louis Vuitton S.A. are presented in Appendix C of this book. LVMH is a Paris-based holding company and one of the worlds largest and best-known...
-
The manager of Perrottis Pizza collects data concerning customer complaints about delivery. Pizza arrives late, or the wrong pizza is delivered. Problem Frequency Topping stuck to box...
-
Preble Company manufactures one product. Its variable manufacturing overhead is applied to production based on direct labor-hours and its standard cost card per unit is as follows: Direct material: 5...
-
2.2 Kagiso is a training and development specialist at a large talent management consulting company in South Africa. He was approached by the CEO of a mining company in Phalaborwa to present a...
-
Bond A has 4 years left to maturity and Bond B has 8 years left to maturity. They both have a 6% coupon rate, pays semiannually, and yield is 5%. Calculate the percentage change in the price of each...
-
Why should we classify costs as relevant and irrelevant? Give examples of relevant and irrelevant costs and discuss how this classification helps management to make a selection between available...
-
A company forecasts free cash flow in year one will be RM1 million and free cash flow in year 2 will be RM4 million. After the second year, free cash flow will grow at a constant rate of 5 percent...
-
Explain the role of marketing to an organisation and what the relationship is betweenmarketing strategy and corporate strategy. Describe how a marketing strategy can lead to competitive advantages,...
-
In general, what is an option and what differentiates it from other types of financial securities? What are some examples of options commonly encountered in the world of investment and finance?
-
The principle of redundancy is used when system reliability is improved through redundant or backup components. Assume that a student's alarm clock has a 12.3% daily failure rate. Complete parts (a)...
-
Which of the following streaming TV devices does not involve use of a remote controller? A) Google Chromecast B) Apple TV C) Amazon Fire TV D) Roku
-
Piper Consulting Company incurred the following during 2019: Calculate prime cost and conversion cost for Piper Consulting Company during 2019. Direct labor.. Overhead Selling expenses Administrative...
-
At December 31, 2019, the end of its fiscal year, Lederman Manufacturing Corporation collected the following data for 2019: Prepare a schedule of cost of goods manufactured and sold for Lederman...
-
Sydney Company reported the following amounts for October: Use Excel to prepare a schedule of cost of goods manufactured for October. Beginning raw materials inventory. Beginning work-in-process...

Study smarter with the SolutionInn App