

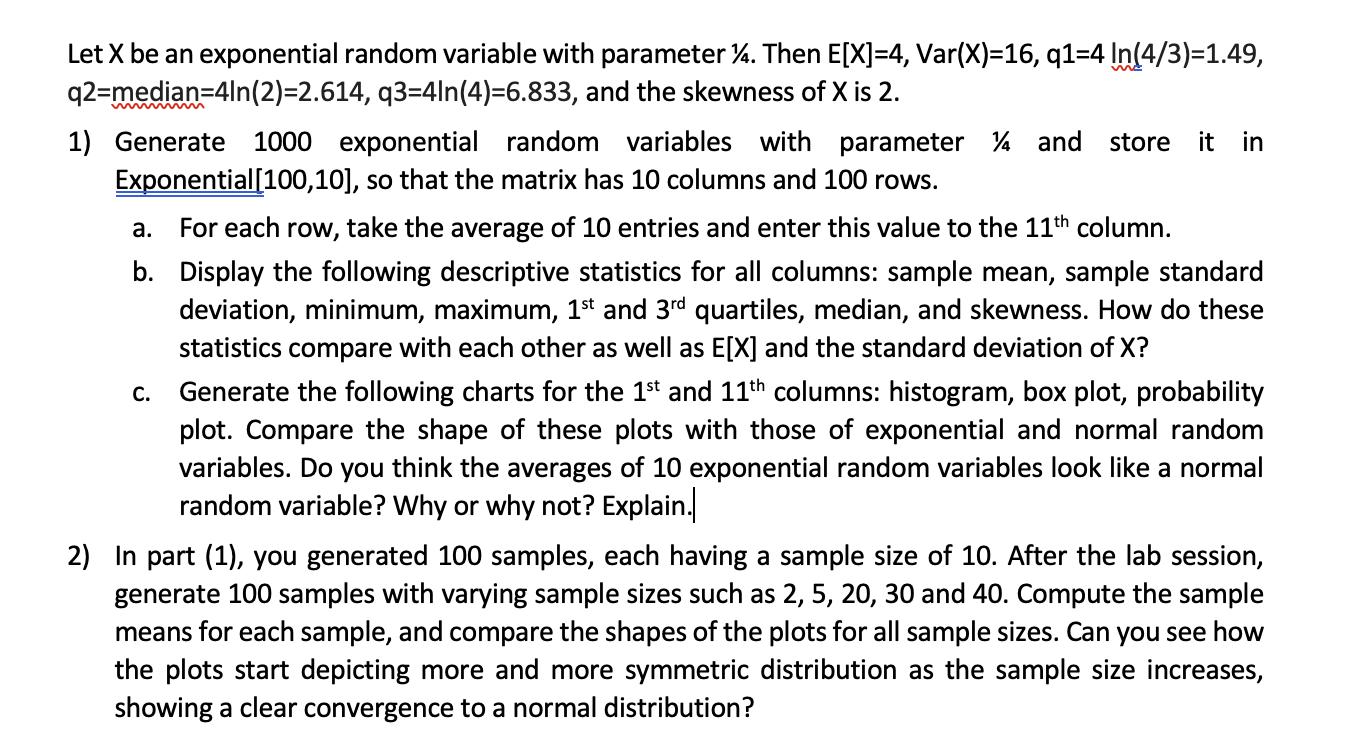
Let X be an exponential random variable with parameter 14. Then E[X]=4, Var(X)=16, q1=4 In(4/3)=1.49, q2=median=4ln(2)=2.614,...
Fantastic news! We've Found the answer you've been seeking!
Question:
Expert Answer:
The question youve presented is related to statistics and involves generating random samples from an exponential distribution calculating descriptive statistics creating visual plots for analysis and ... View the full answer

Related Book For 

Introduction to Probability
ISBN: 978-0716771098
1st edition
Authors: Mark Daniel Ward, Ellen Gundlach
Posted Date:
