

Load PhaseData.csv into your script. Row 1 is the experimental temperature data (x-axis values) and Row...
Fantastic news! We've Found the answer you've been seeking!
Question:
Transcribed Image Text:
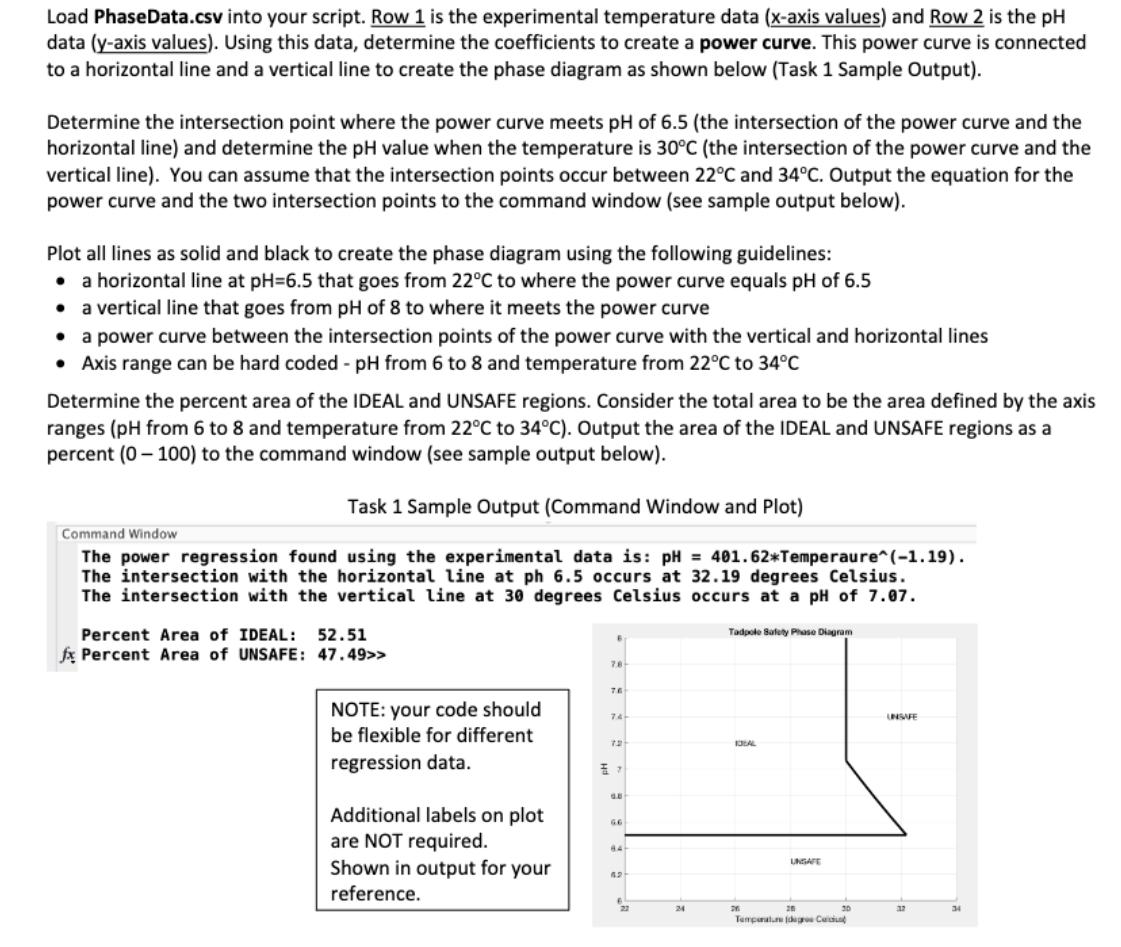
Load PhaseData.csv into your script. Row 1 is the experimental temperature data (x-axis values) and Row 2 is the pH data (y-axis values). Using this data, determine the coefficients to create a power curve. This power curve is connected to a horizontal line and a vertical line to create the phase diagram as shown below (Task 1 Sample Output). Determine the intersection point where the power curve meets pH of 6.5 (the intersection of the power curve and the horizontal line) and determine the pH value when the temperature is 30C (the intersection of the power curve and the vertical line). You can assume that the intersection points occur between 22C and 34C. Output the equation for the power curve and the two intersection points to the command window (see sample output below). Plot all lines as solid and black to create the phase diagram using the following guidelines: a horizontal line at pH=6.5 that goes from 22C to where the power curve equals pH of 6.5 a vertical line that goes from pH of 8 to where it meets the power curve a power curve between the intersection points of the power curve with the vertical and horizontal lines Axis range can be hard coded - pH from 6 to 8 and temperature from 22C to 34C Determine the percent area of the IDEAL and UNSAFE regions. Consider the total area to be the area defined by the axis ranges (pH from 6 to 8 and temperature from 22C to 34C). Output the area of the IDEAL and UNSAFE regions as a percent (0-100) to the command window (see sample output below). Task 1 Sample Output (Command Window and Plot) Command Window The power regression found using the experimental data is: pH = 401.62*Temperaure^(-1.19). The intersection with the horizontal line at ph 6.5 occurs at 32.19 degrees Celsius. The intersection with the vertical line at 30 degrees Celsius occurs at a pH of 7.07. Percent Area of IDEAL: 52.51 fx Percent Area of UNSAFE: 47.49>> NOTE: your code should be flexible for different regression data. Additional labels on plot are NOT required. Shown in output for your reference. 7.8 76 74 72 4.8 84 42 27 24 Tadpole Safety Phase Diagram IDEAL UNGATE 20 20 Temperature (degro Cu 30 UNSAFE 32 34 Load PhaseData.csv into your script. Row 1 is the experimental temperature data (x-axis values) and Row 2 is the pH data (y-axis values). Using this data, determine the coefficients to create a power curve. This power curve is connected to a horizontal line and a vertical line to create the phase diagram as shown below (Task 1 Sample Output). Determine the intersection point where the power curve meets pH of 6.5 (the intersection of the power curve and the horizontal line) and determine the pH value when the temperature is 30C (the intersection of the power curve and the vertical line). You can assume that the intersection points occur between 22C and 34C. Output the equation for the power curve and the two intersection points to the command window (see sample output below). Plot all lines as solid and black to create the phase diagram using the following guidelines: a horizontal line at pH=6.5 that goes from 22C to where the power curve equals pH of 6.5 a vertical line that goes from pH of 8 to where it meets the power curve a power curve between the intersection points of the power curve with the vertical and horizontal lines Axis range can be hard coded - pH from 6 to 8 and temperature from 22C to 34C Determine the percent area of the IDEAL and UNSAFE regions. Consider the total area to be the area defined by the axis ranges (pH from 6 to 8 and temperature from 22C to 34C). Output the area of the IDEAL and UNSAFE regions as a percent (0-100) to the command window (see sample output below). Task 1 Sample Output (Command Window and Plot) Command Window The power regression found using the experimental data is: pH = 401.62*Temperaure^(-1.19). The intersection with the horizontal line at ph 6.5 occurs at 32.19 degrees Celsius. The intersection with the vertical line at 30 degrees Celsius occurs at a pH of 7.07. Percent Area of IDEAL: 52.51 fx Percent Area of UNSAFE: 47.49>> NOTE: your code should be flexible for different regression data. Additional labels on plot are NOT required. Shown in output for your reference. 7.8 76 74 72 4.8 84 42 27 24 Tadpole Safety Phase Diagram IDEAL UNGATE 20 20 Temperature (degro Cu 30 UNSAFE 32 34
Expert Answer:

Related Book For 

Posted Date:
Students also viewed these databases questions
-
In using the bolt cutter shown, a worker applies two 300-N forces to the handles. Determine the magnitude of the forces exerted by the cutter on the bolt. 300 N 12 mm 24 mm E 24 mm 460 mm 96 mm 300 N...
-
Extend Tables 3.2 and 3.3 to include times of fall of 6 to 10 s, assuming no air resistance. Table 3.2 Time of Fall (seconds) _____________Velocity Acquired (meters/second)...
-
Thirteen internists in the Midwest are randomly selected, and each internist is asked to report last year's income. The incomes obtained (in thousands of dollars) are 152, 144, 162, 154, 146, 241,...
-
Describe the differences between black box and white box component modeling.
-
The European Division of Worldwide Reference Corporation produces a pocket dictionary containing popular phrases in six European languages. Annual budget data for the coming year follow. Projected...
-
Assume that ABC Insurance Company has purchased from QS Reinsurance Company a quota share treaty with a $500,000 limit and a retention of 30 percent and a cession of 70 percent. ABC has written...
-
The Production manager of the Good Time Wine Rack Company is retiring and the Managing Director is looking to replace her. You are preparing a work schedule as youare hoping to be offeredthe position...
-
Conduct a macroeconomic analysis of the Canadian Liberal Party's bid for power in the September 20th, 2021 Federal Election. They made specific promises and assessed the economic impact. Promise 1:...
-
Air enters a compressor at \(0.2 \mathrm{Mpa}\) and \(30^{\circ} \mathrm{C}\) having a volume of \(2 \mathrm{~m}^{3} / \mathrm{kg}\) is compressed to 1 Mpa isothermally. Calculate: (i) work down,...
-
You just learned about the basics of human resources. Consider how this key aspect of management relates to other areas of business. How would policies and the reputation of the human resources...
-
What is refrigeration? What is refrigeration effect? Explain window air conditioner with neat sketch.
-
Find the mass moment of inertia of a hollow cylinder about its axis passing through the centroid.
-
How confident are you that the protections in place for whistle-blowers are adequate?
-
Costa Services, Inc., has $ 8,100 cash on hand on March 1. The company requires a minimum cash balance of $ 7,300. March cash collections are $ 548,500. Total cash payments for March are $ 572,670....
-
The MIT Sloan School of Management is one of the leading business schools in the U.S. The following table contains the tuition data for the masters program in the Sloan School of Management. a. Use...
-
A coil with a resistance of and an inductance of 0.15 H is connected to a 120-V, 60-Hz source. (a) Is the phase angle of this circuit (1) positive, (2) zero, or (3) negative? Why? (b) What is the...
-
What are the peak and rms voltages of a 120-V ac line and a 240-V ac line?
-
Uranium-238 undergoes alpha decay as follows: (a) Would you expect the Q value to be (1) positive, (2) negative, or (3) zero? Why? (b) Find the Q value. (238.050 786u) (234043583u)(4.002 603u)
-
True or False: Annual worth analysis is the most popular DCF measure of economic worth.
-
Consider a palletizer at a bottling plant that has a first cost of \($150,000,\) operating and maintenance costs of \($17,500\) per year, and an estimated net salvage value of \($25,000\) at the end...
-
True or False: Unless non-monetary considerations dictate otherwise, choose the mutually exclusive investment alternative that has the greatest annual worth over the planning horizon.

Study smarter with the SolutionInn App