

Moody diagrams are plots that engineers use to relate friction factors (f) and Reynolds numbers (Re)....
Fantastic news! We've Found the answer you've been seeking!
Question:

Transcribed Image Text:
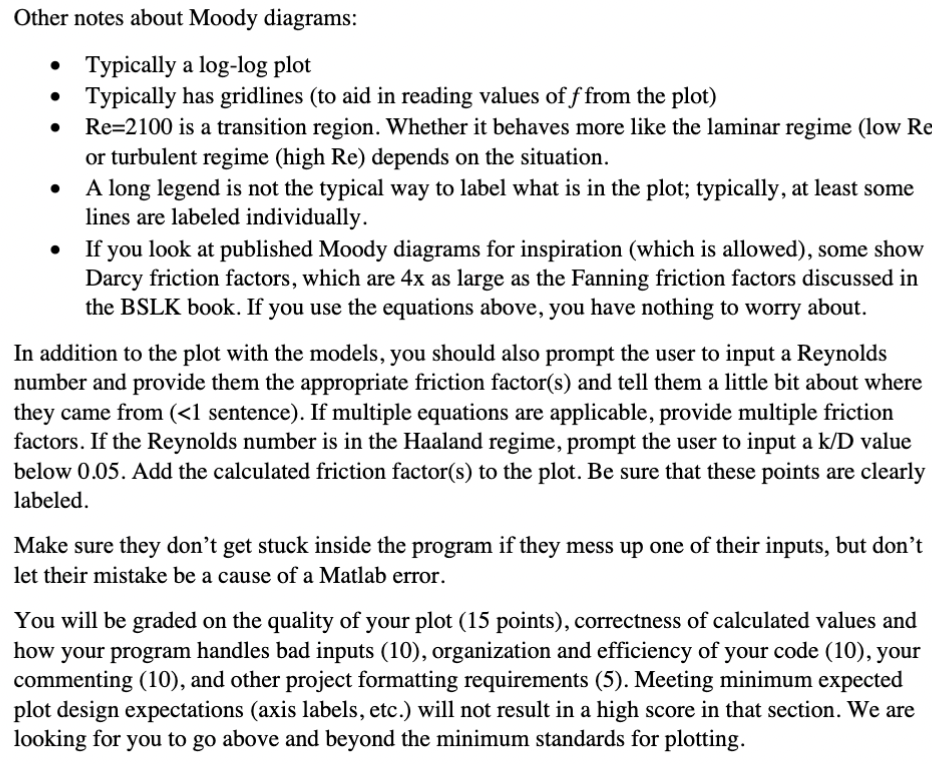
Moody diagrams are plots that engineers use to relate friction factors (f) and Reynolds numbers (Re). Friction factors are a measure of the resistance to flow in a pipe (it's much more complex than this simple idea, which you'll learn about in 326 and 324), and Reynolds number is a description of flow in a pipe. A low friction factor means that there is little resistance to flow in a pipe, and a high friction factor means that the pipe has a lot of resistance to flow. A low Reynolds number means that flow is smooth and slow (laminar), and a high Reynold's number means that the flow is fast and hectic (turbulent). In addition to the flow impacting the friction factor, the pipe material can impact the friction factor. A rough pipe (high relative roughness, k/D) will cause more resistance to flow than a smooth pipe (low relative roughness k/D). Determining Reynolds number is typically quite straightforward for engineers. Determining friction factors is often done by looking at Moody diagrams. Even though engineers often will look at Moody diagrams and read values from the plot, these diagrams are developed from equations. A list of equations is below : Laminar equation: Blasius equation: f 1 f = 16 Re 0.0791 Re4' Re 2100 Prandtl equation (only for smooth pipe where k/D=0): 1 4.0 log0 (Re) - 0.4, f Haaland model (for non-smooth pipe up to k/D=0.05) 2100 Re 105 = -3.6 log10 + 101 6.9 (k/D9 Re 3.7 2300 Re 4 x 10⁶ 4 x 10⁴ < Re 108 You may notice that some of these models have overlapping regions; engineers have to decide which model they want to use! For project 2, you need to generate a Moody diagram that includes each of these models. The user should not need to resize the plot to see everything clearly. Select at least 5 different k/D values in the allowed range for the Haaland model. Other notes about Moody diagrams: Typically a log-log plot Typically has gridlines (to aid in reading values off from the plot) Re=2100 is a transition region. Whether it behaves more like the laminar regime (low Re or turbulent regime (high Re) depends on the situation. A long legend is not the typical way to label what is in the plot; typically, at least some lines are labeled individually. If you look at published Moody diagrams for inspiration (which is allowed), some show Darcy friction factors, which are 4x as large as the Fanning friction factors discussed in the BSLK book. If you use the equations above, you have nothing to worry about. In addition to the plot with the models, you should also prompt the user to input a Reynolds number and provide them the appropriate friction factor(s) and tell them a little bit about where they came from ( <1 sentence). If multiple equations are applicable, provide multiple friction factors. If the Reynolds number is in the Haaland regime, prompt the user to input a k/D value below 0.05. Add the calculated friction factor(s) to the plot. Be sure that these points are clearly labeled. Make sure they don't get stuck inside the program if they mess up one of their inputs, but don't let their mistake be a cause of a Matlab error. You will be graded on the quality of your plot (15 points), correctness of calculated values and how your program handles bad inputs (10), organization and efficiency of your code (10), your commenting (10), and other project formatting requirements (5). Meeting minimum expected plot design expectations (axis labels, etc.) will not result in a high score in that section. We are looking for you to go above and beyond the minimum standards for plotting. Moody diagrams are plots that engineers use to relate friction factors (f) and Reynolds numbers (Re). Friction factors are a measure of the resistance to flow in a pipe (it's much more complex than this simple idea, which you'll learn about in 326 and 324), and Reynolds number is a description of flow in a pipe. A low friction factor means that there is little resistance to flow in a pipe, and a high friction factor means that the pipe has a lot of resistance to flow. A low Reynolds number means that flow is smooth and slow (laminar), and a high Reynold's number means that the flow is fast and hectic (turbulent). In addition to the flow impacting the friction factor, the pipe material can impact the friction factor. A rough pipe (high relative roughness, k/D) will cause more resistance to flow than a smooth pipe (low relative roughness k/D). Determining Reynolds number is typically quite straightforward for engineers. Determining friction factors is often done by looking at Moody diagrams. Even though engineers often will look at Moody diagrams and read values from the plot, these diagrams are developed from equations. A list of equations is below : Laminar equation: Blasius equation: f 1 f = 16 Re 0.0791 Re4' Re 2100 Prandtl equation (only for smooth pipe where k/D=0): 1 4.0 log0 (Re) - 0.4, f Haaland model (for non-smooth pipe up to k/D=0.05) 2100 Re 105 = -3.6 log10 + 101 6.9 (k/D9 Re 3.7 2300 Re 4 x 10⁶ 4 x 10⁴ < Re 108 You may notice that some of these models have overlapping regions; engineers have to decide which model they want to use! For project 2, you need to generate a Moody diagram that includes each of these models. The user should not need to resize the plot to see everything clearly. Select at least 5 different k/D values in the allowed range for the Haaland model. Other notes about Moody diagrams: Typically a log-log plot Typically has gridlines (to aid in reading values off from the plot) Re=2100 is a transition region. Whether it behaves more like the laminar regime (low Re or turbulent regime (high Re) depends on the situation. A long legend is not the typical way to label what is in the plot; typically, at least some lines are labeled individually. If you look at published Moody diagrams for inspiration (which is allowed), some show Darcy friction factors, which are 4x as large as the Fanning friction factors discussed in the BSLK book. If you use the equations above, you have nothing to worry about. In addition to the plot with the models, you should also prompt the user to input a Reynolds number and provide them the appropriate friction factor(s) and tell them a little bit about where they came from ( <1 sentence). If multiple equations are applicable, provide multiple friction factors. If the Reynolds number is in the Haaland regime, prompt the user to input a k/D value below 0.05. Add the calculated friction factor(s) to the plot. Be sure that these points are clearly labeled. Make sure they don't get stuck inside the program if they mess up one of their inputs, but don't let their mistake be a cause of a Matlab error. You will be graded on the quality of your plot (15 points), correctness of calculated values and how your program handles bad inputs (10), organization and efficiency of your code (10), your commenting (10), and other project formatting requirements (5). Meeting minimum expected plot design expectations (axis labels, etc.) will not result in a high score in that section. We are looking for you to go above and beyond the minimum standards for plotting.
Expert Answer:

Related Book For 

Applied Regression Analysis and Other Multivariable Methods
ISBN: 978-1285051086
5th edition
Authors: David G. Kleinbaum, Lawrence L. Kupper, Azhar Nizam, Eli S. Rosenberg
Posted Date:
Students also viewed these mechanical engineering questions
-
Image transcription text Module 5 Discussion A' Instructions: This discussion will be completed in two parts, and will give you an opportunity to reect upon this week's content and to interact with...
-
Conversational yet professional tone 1. Your vacation request was approved. 2 . Please adhere to the signs and wash your hands thoroughly! 3. All employees are herewith instructed to return the...
-
The following are excerpts from the 2015 financial statements of Renault, a large French automobile manufacturer. 14 - INVESTMENT IN NISSAN A - Nissan consolidation method Renault's percentage...
-
Lamadec Ltd shares currently sell for $4 per share. The last dividend was $0.30 per share. The dividend is expected to grow at 5%. a) What is the required return on Lamadec shares? b) What is the...
-
A layer of oil flows down a vertical plate as shown in Fig. P4.63 with a velocity of \(\mathbf{V}=\left(V_{0} / h^{2} ight)\left(2 h x-x^{2} ight) \hat{\mathbf{j}}\) where \(V_{0}\) and \(h\) are...
-
During the past week, one of your newly employed payroll associates dropped into your office to ask several questions regarding wage reporting for federal income and social security tax purposes. If...
-
You are a recent hire at a company. Your manager explains that the company has not used budgets previously. She asks you to explain how budgets can be useful to a manufacturing firm. Create a...
-
An item that sells for $145.99 has a sales tax of $10.22. a. Find a mathematical model that gives the amount of sales tax y in terms of the retail price x. b. Use the model to find the sales tax on a...
-
Distinguish between the concepts of motive and intent in the criminal law. Can you cite an instance where, despite good motives, a person would be guilty of a crime?
-
Should the criminal law punish a person whose mere carelessness, as opposed to willfulness, causes harm to another?
-
Name some important similarities and distinctions between the offenses of robbery and extortion.
-
Given the fact that the common-law requirement of intent is not an element of strict liability crimes, what rationale supports legislative enactment of such offenses?
-
Is it fair to assess the same degree of fault and impose the same punishment on an accomplice as on a perpetrator? What rationale supports your conclusion?
-
For best amplification, the Q-point of the transistor should be located- O a, near saturation. O b. near cutoff. Oc where IC is maximum. O d. at halfway between cutoff and saturation.
-
Quadrilateral EFGH is a kite. Find mG. E H <105 G 50 F
-
A random sample of data was collected on residential sales in a large city. The accompanying table shows the selling price (Y, in $ 1,000s), area (X1, in hundreds of square feet), number of bedrooms...
-
For the regression of PCI (Y) on YNG (X) for the African countries considered in Problem 2 in Chapter 12, use the accompanying information to do the following: a. Plot the estimated straight-line and...
-
Consider again the study described in the main body of this chapter concerning the effect of an air pollution episode on pulmonary function measurements (FEV1) taken on each of K= 40 school children...
-
Describe the working of a Carnot cycle.
-
Define thermal efficiency of a heat engine.
-
What are the limitations of Carnot cycle?

Study smarter with the SolutionInn App