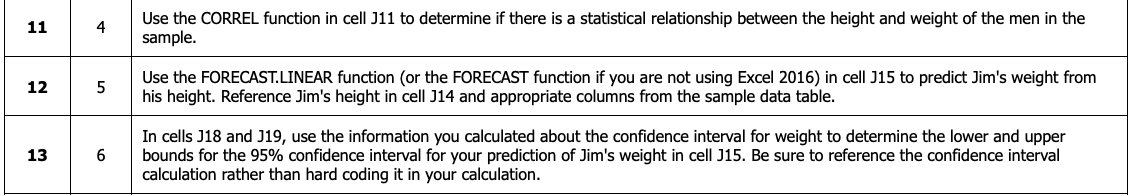
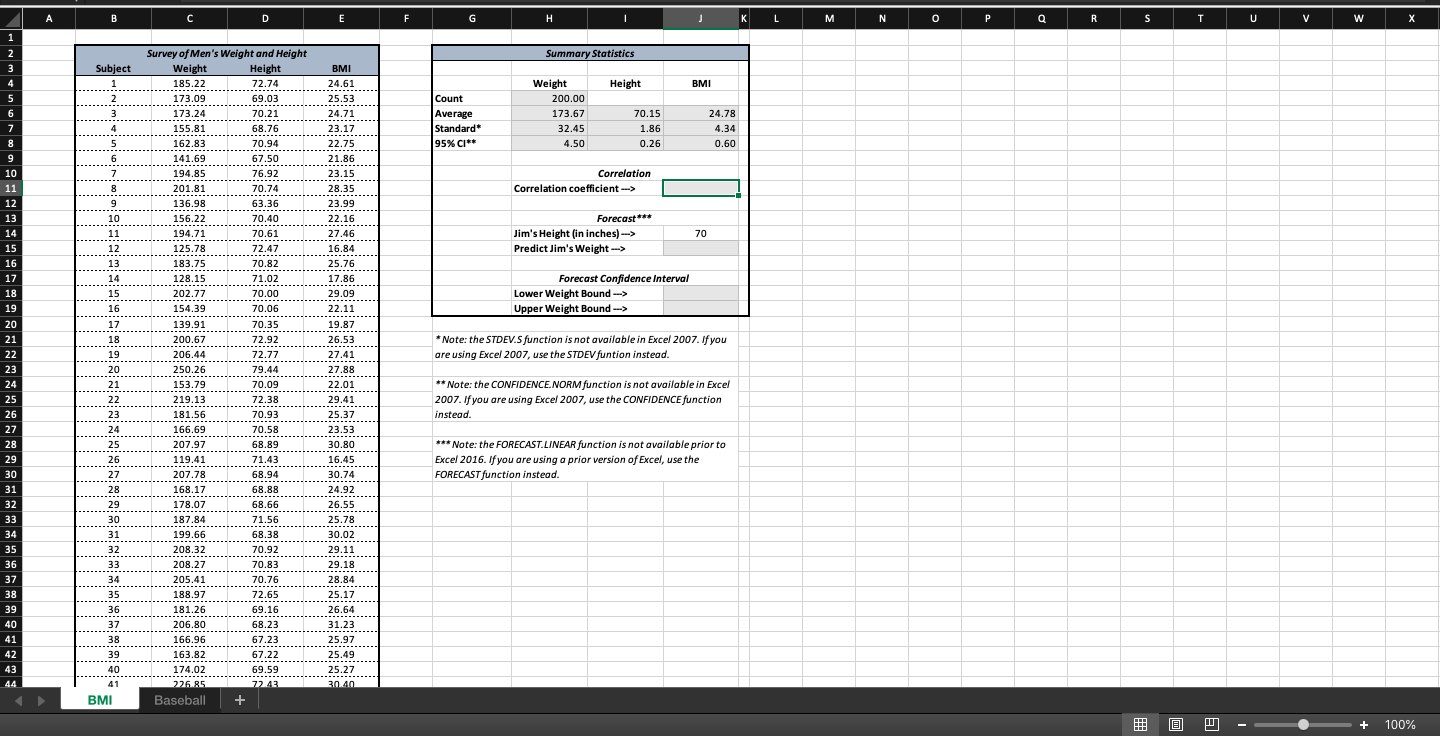
11 12 13 4 5 6 Use the CORREL function in cell J11 to determine if...
Fantastic news! We've Found the answer you've been seeking!
Question:
Transcribed Image Text:
11 12 13 4 5 6 Use the CORREL function in cell J11 to determine if there is a statistical relationship between the height and weight of the men in the sample. Use the FORECAST.LINEAR function (or the FORECAST function if you are not using Excel 2016) in cell J15 to predict Jim's weight from his height. Reference Jim's height in cell J14 and appropriate columns from the sample data table. In cells J18 and J19, use the information you calculated about the confidence interval for weight to determine the lower and upper bounds for the 95% confidence interval for your prediction of Jim's weight in cell J15. Be sure to reference the confidence interval calculation rather than hard coding it in your calculation. 1 2 3 4 5 6 7 8 9 10 11 12 13 14 15 16 17 18 19 20 21 22 23 24 25 26 27 28 29 30 31 32 33 34 35 36 37 38 39 40 41 42 43 44 A B Subject 1 2 3 6 7 8 9 10 11 12 13 14 15 16 .... 17 18 19 20 21 22 23 24 25 26 27 28 29 30 31 22 32 33 34 35 36 37 38 39 40 41 BMI с Survey of Men's Weight and Height Weight Height 185.22 173.09 173.24 155.81 162.83 141.69 194.85 201.81 136.98 156.22 194.71 125.78 183.75 128.15 202.77 154.39 139.91 200.67 206.44 250.26 153.79 219.13 181.56 166.69 207.97 119.41 207.78 168.17 178.07 187.84 199.66 208.32 208.27 205.41 D 188.97 181.26 206.80 166.96 163.82 174.02 226.85 Baseball 72.74 69.03 70.21 68.76 70.94 67.50 76.92 70.74 63.36 70.40 70.61 72.47 70.82 70.82 71.02 70.00 70.06 70.35 72.92 72.77 79.44 70.09 72.38 70.93 70.58 68.89 71.43 68.94 68.88 68.66 71.56 68.38 70.92 70.83 70.76 72.65 69.16 68.23 67.23 67.22 69.59 72.43 E BMI 24.61 25.53 24 71 24.71 23.17 22.75 44000 21.86 23.15 28.35 23.99 22.16 27.46 16.84 25.76 17.86 29.09 23:05 22.11 19.87 26.53 27.41 27.88 22.01 29.41 50000 25.37 23.53 30.80 16.45 HOOR 30.74 24.92 26.55 25.78 30.02 29.11 29.18 28.84 25.17 26.64 31.23 25.97 25.49 25.27 30.40 F Count Average Standard* 95% CI** H Summary Statistics Weight I 200.00 173.67 32.45 4.50 Height 70.15 1.86 0.26 Correlation Correlation coefficient ---> Forecast*** Jim's Height (in inches)---> Predict Jim's Weight ---> Forecast Confidence Interval Lower Weight Bound ---> Upper Weight Bound ---> J BMI 70 24.78 4.34 0.60 *Note: the STDEV.S function is not available in Excel 2007. If you are using Excel 2007, use the STDEV funtion instead. ** Note: the CONFIDENCE.NORM function is not available in Excel 2007. If you are using Excel 2007, use the CONFIDENCE function instead. *** Note: the FORECAST.LINEAR function is not available prior to Excel 2016. If you are using a prior version of Excel, use the FORECAST function instead. K L M N 0 P Q R S 8 T U V W X 100% 11 12 13 4 5 6 Use the CORREL function in cell J11 to determine if there is a statistical relationship between the height and weight of the men in the sample. Use the FORECAST.LINEAR function (or the FORECAST function if you are not using Excel 2016) in cell J15 to predict Jim's weight from his height. Reference Jim's height in cell J14 and appropriate columns from the sample data table. In cells J18 and J19, use the information you calculated about the confidence interval for weight to determine the lower and upper bounds for the 95% confidence interval for your prediction of Jim's weight in cell J15. Be sure to reference the confidence interval calculation rather than hard coding it in your calculation. 1 2 3 4 5 6 7 8 9 10 11 12 13 14 15 16 17 18 19 20 21 22 23 24 25 26 27 28 29 30 31 32 33 34 35 36 37 38 39 40 41 42 43 44 A B Subject 1 2 3 6 7 8 9 10 11 12 13 14 15 16 .... 17 18 19 20 21 22 23 24 25 26 27 28 29 30 31 22 32 33 34 35 36 37 38 39 40 41 BMI с Survey of Men's Weight and Height Weight Height 185.22 173.09 173.24 155.81 162.83 141.69 194.85 201.81 136.98 156.22 194.71 125.78 183.75 128.15 202.77 154.39 139.91 200.67 206.44 250.26 153.79 219.13 181.56 166.69 207.97 119.41 207.78 168.17 178.07 187.84 199.66 208.32 208.27 205.41 D 188.97 181.26 206.80 166.96 163.82 174.02 226.85 Baseball 72.74 69.03 70.21 68.76 70.94 67.50 76.92 70.74 63.36 70.40 70.61 72.47 70.82 70.82 71.02 70.00 70.06 70.35 72.92 72.77 79.44 70.09 72.38 70.93 70.58 68.89 71.43 68.94 68.88 68.66 71.56 68.38 70.92 70.83 70.76 72.65 69.16 68.23 67.23 67.22 69.59 72.43 E BMI 24.61 25.53 24 71 24.71 23.17 22.75 44000 21.86 23.15 28.35 23.99 22.16 27.46 16.84 25.76 17.86 29.09 23:05 22.11 19.87 26.53 27.41 27.88 22.01 29.41 50000 25.37 23.53 30.80 16.45 HOOR 30.74 24.92 26.55 25.78 30.02 29.11 29.18 28.84 25.17 26.64 31.23 25.97 25.49 25.27 30.40 F Count Average Standard* 95% CI** H Summary Statistics Weight I 200.00 173.67 32.45 4.50 Height 70.15 1.86 0.26 Correlation Correlation coefficient ---> Forecast*** Jim's Height (in inches)---> Predict Jim's Weight ---> Forecast Confidence Interval Lower Weight Bound ---> Upper Weight Bound ---> J BMI 70 24.78 4.34 0.60 *Note: the STDEV.S function is not available in Excel 2007. If you are using Excel 2007, use the STDEV funtion instead. ** Note: the CONFIDENCE.NORM function is not available in Excel 2007. If you are using Excel 2007, use the CONFIDENCE function instead. *** Note: the FORECAST.LINEAR function is not available prior to Excel 2016. If you are using a prior version of Excel, use the FORECAST function instead. K L M N 0 P Q R S 8 T U V W X 100%
Expert Answer:
Answer rating: 100% (QA)
Answer 1 The CORREL function in cell J11 is used to determine if there is a statistical relationship ... View the full answer
Related Book For
Business Statistics A Decision Making Approach
ISBN: 9780133021844
9th Edition
Authors: David F. Groebner, Patrick W. Shannon, Phillip C. Fry
Posted Date:
Students also viewed these accounting questions
-
The ER Model for Arkansas, Inc. database is based on the following business rules. - A department hires many employees. Each employee is hired by one department. - An employee is assigned to more...
-
Need help asap with physics questions 1. a) Write down the three lepton conservation laws, taking care to define all the terms. {3} b) For the neutrinos in the following reactions, assign the...
-
NEED ASAP WITH EXPLANATION PLEASE Social insurance exists to: Help solve social problems that results from economic changes beyond the control of both employers and employees Provide a base of...
-
Seeking for information of a specific organization then answer following questions: (1) Give a brief introduction of the chosen organization. (2) Explain the type of the chosen organization. What are...
-
(a) Calculate the price-to-rent ratio on the property. (b) Calculate the present value of after-tax cash flow for the property, assuming that the after-tax cash-flow numbers are $8000 for the first...
-
The electric field at the surface of a charged, solid, copper sphere with radius 0.200 m is 3800 N/c, directed toward the center of the sphere. What is the potential at the center of the sphere, if...
-
Mr. Jenkins, this is typical question: Do you feel that I have treated you fairly in this interview?
-
Coburn (beginning capital, $60,000) and Webb (beginning capital $90,000) are partners. During 2014, the partnership earned net income of $80,000, and Coburn made drawings of $18,000 while Webb made...
-
The 2020 season was expected to be a year of partying at Cedar Fair. Its namesake theme parkCedar Pointreached its 150 th year, and its Knotts Berry Farm was prepared to celebrate its 100 th...
-
Match correct purposes, contents, and users regarding SOC reports. Purposes/Contents/Users a. Easy to read by the general public in a summary format on security, availability, processing integrity,...
-
Consider a stock that currently paid a $4 dividend. In one year, it is expected to pay a $5 dividend. The year after, it will pay $7 for four years. After that, the dividends will grow at a constant...
-
Thanos is a diversified company involved in a wide range of activities in the food takeaways. Take out the following activities during the year. The company purchased a brand on 1 January 2023 for R3...
-
A stock is selling for $18.50. The possible stock prices at the end of 6 months are $22.50 and $15.00. Interest rate is 6.0% and dividend yield is 0%. Construct a replicating portfolio of stock and...
-
9. Corporate AGT Lt Air Ca AssCap Avco Bell Bell BMO BNS BNS Card Tr Cdn Pa Clearn CnCrTr Coke Coupon Mat. date Bid $ Yid% 8.800 6.750 5.400 5.750 Sep 22/25 100.46 8.75 Feb 02/04 94.00 9.09 Sep 04/01...
-
Consider a security of which we expect to pay a constant dividend of $18.49 in perpetuity. Furthermore, its expected rate of return is 20.1%. Using the equation for present value of a perpetuity, we...
-
Find the largest possible value for the rank of A and the smallest possible value for the nullity of A. Ais 4x4 The largest possible value for the rank of Ais The smallest possible value for the...
-
A stock has had returns of 8 percent, 26 percent, 14 percent, 17 percent, 31 percent, and 1 percent over the last six years. What are the arithmetic and geometric average returns for the stock?
-
The National Association of Realtors (NAR) Existing-Home Sales Series provides a measurement of the residential real estate market. On or about the 25th of each month, NAR releases statistics on...
-
A survey by KRC Research for U.S. News reported that 37% of people plan to spend more on eating out after they retire. If eight people are randomly selected, then determine the a. expected number of...
-
The file Online contains a random sample of 48 customers who made purchases last quarter from an online retailer. The file contains information related to the time each customer spent viewing the...
-
Please reflect on and explain the role and usefulness of the concept of SD in relation to the protection of the environment.
-
Has the concept of SD achieved the balance between all three pillars: environmental protection; economic development; and social issues?
-
What, if any, is the normative content of the concept of SD?
Study smarter with the SolutionInn App