

Now that you've learned about hypothesis testing and p-values, you should also be aware that these...
Fantastic news! We've Found the answer you've been seeking!
Question:
Transcribed Image Text:
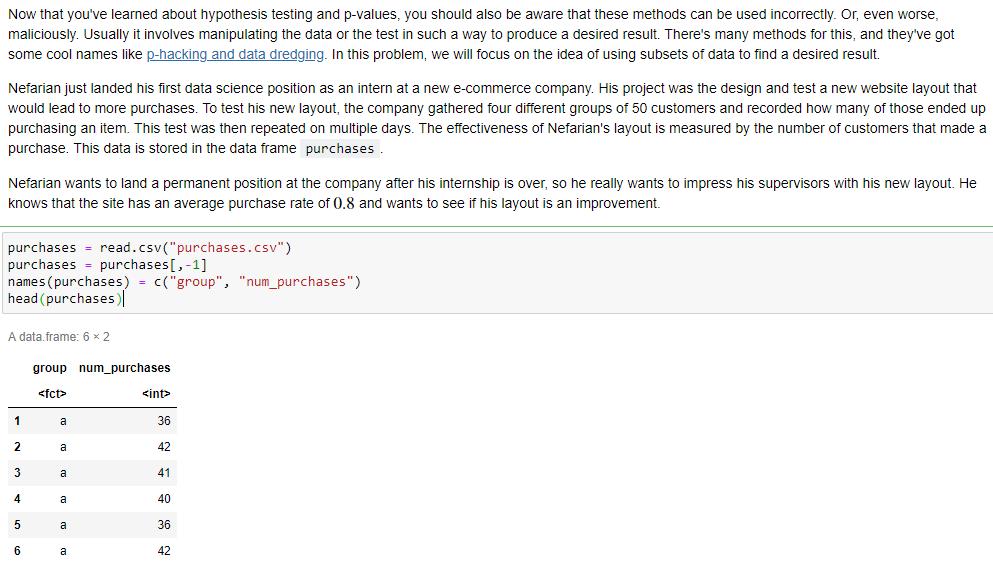
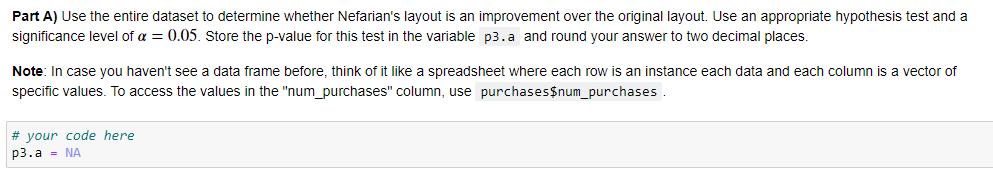
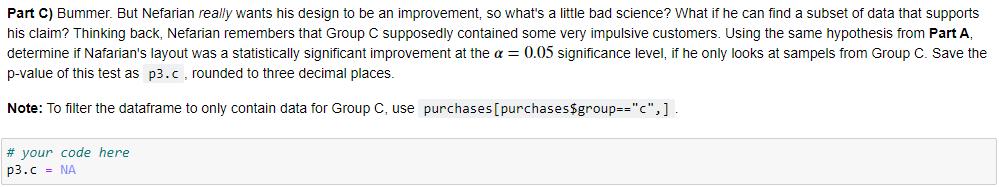
Now that you've learned about hypothesis testing and p-values, you should also be aware that these methods can be used incorrectly. Or, even worse, maliciously. Usually it involves manipulating the data or the test in such a way to produce a desired result. There's many methods for this, and they've got some cool names like p-hacking and data dredging. In this problem, we will focus on the idea of using subsets of data to find a desired result. Nefarian just landed his first data science position as an intern at a new e-commerce company. His project was the design and test a new website layout that would lead to more purchases. To test his new layout, the company gathered four different groups of 50 customers and recorded how many of those ended up purchasing an item. This test was then repeated on multiple days. The effectiveness of Nefarian's layout is measured by the number of customers that made a purchase. This data is stored in the data frame purchases. Nefarian wants to land a permanent position at the company after his internship is over, so he really wants to impress his supervisors with his new layout. He knows that the site has an average purchase rate of 0.8 and wants to see if his layout is an improvement. purchases purchases = purchases[,-1] names (purchases) = c("group", "num_purchases") head (purchases)| read.csv("purchases.csv") A data.frame: 6 x 2 group num_purchases <fct> <int> a 36 2 a 42 a 41 a 40 a 36 a 42 Part A) Use the entire dataset to determine whether Nefarian's layout is an improvement over the original layout. Use an appropriate hypothesis test and a significance level of a = 0.05. Store the p-value for this test in the variable p3.a and round your answer to two decimal places. Note: In case you haven't see a data frame before, think of it like a spreadsheet where each row is an instance each data and each column is a vector of specific values. To access the values in the "num_purchases" column, use purchases$num_purchases . # your code here p3.a = NA Part C) Bummer. But Nefarian really wants his design to be an improvement, so what's a little bad science? What if he can find a subset of data that supports his claim? Thinking back, Nefarian remembers that Group C supposedly contained some very impulsive customers. Using the same hypothesis from Part A, determine if Nafarian's layout was a statistically significant improvement at the a = 0.05 significance level, if he only looks at sampels from Group C. Save the p-value of this test as p3.c, rounded to three decimal places. Note: To filter the dataframe to only contain data for Group C, use purchases[purchases$group=="c",]. # your code here p3.c = NA Now that you've learned about hypothesis testing and p-values, you should also be aware that these methods can be used incorrectly. Or, even worse, maliciously. Usually it involves manipulating the data or the test in such a way to produce a desired result. There's many methods for this, and they've got some cool names like p-hacking and data dredging. In this problem, we will focus on the idea of using subsets of data to find a desired result. Nefarian just landed his first data science position as an intern at a new e-commerce company. His project was the design and test a new website layout that would lead to more purchases. To test his new layout, the company gathered four different groups of 50 customers and recorded how many of those ended up purchasing an item. This test was then repeated on multiple days. The effectiveness of Nefarian's layout is measured by the number of customers that made a purchase. This data is stored in the data frame purchases. Nefarian wants to land a permanent position at the company after his internship is over, so he really wants to impress his supervisors with his new layout. He knows that the site has an average purchase rate of 0.8 and wants to see if his layout is an improvement. purchases purchases = purchases[,-1] names (purchases) = c("group", "num_purchases") head (purchases)| read.csv("purchases.csv") A data.frame: 6 x 2 group num_purchases <fct> <int> a 36 2 a 42 a 41 a 40 a 36 a 42 Part A) Use the entire dataset to determine whether Nefarian's layout is an improvement over the original layout. Use an appropriate hypothesis test and a significance level of a = 0.05. Store the p-value for this test in the variable p3.a and round your answer to two decimal places. Note: In case you haven't see a data frame before, think of it like a spreadsheet where each row is an instance each data and each column is a vector of specific values. To access the values in the "num_purchases" column, use purchases$num_purchases . # your code here p3.a = NA Part C) Bummer. But Nefarian really wants his design to be an improvement, so what's a little bad science? What if he can find a subset of data that supports his claim? Thinking back, Nefarian remembers that Group C supposedly contained some very impulsive customers. Using the same hypothesis from Part A, determine if Nafarian's layout was a statistically significant improvement at the a = 0.05 significance level, if he only looks at sampels from Group C. Save the p-value of this test as p3.c, rounded to three decimal places. Note: To filter the dataframe to only contain data for Group C, use purchases[purchases$group=="c",]. # your code here p3.c = NA Now that you've learned about hypothesis testing and p-values, you should also be aware that these methods can be used incorrectly. Or, even worse, maliciously. Usually it involves manipulating the data or the test in such a way to produce a desired result. There's many methods for this, and they've got some cool names like p-hacking and data dredging. In this problem, we will focus on the idea of using subsets of data to find a desired result. Nefarian just landed his first data science position as an intern at a new e-commerce company. His project was the design and test a new website layout that would lead to more purchases. To test his new layout, the company gathered four different groups of 50 customers and recorded how many of those ended up purchasing an item. This test was then repeated on multiple days. The effectiveness of Nefarian's layout is measured by the number of customers that made a purchase. This data is stored in the data frame purchases. Nefarian wants to land a permanent position at the company after his internship is over, so he really wants to impress his supervisors with his new layout. He knows that the site has an average purchase rate of 0.8 and wants to see if his layout is an improvement. purchases purchases = purchases[,-1] names (purchases) = c("group", "num_purchases") head (purchases)| read.csv("purchases.csv") A data.frame: 6 x 2 group num_purchases <fct> <int> a 36 2 a 42 a 41 a 40 a 36 a 42 Part A) Use the entire dataset to determine whether Nefarian's layout is an improvement over the original layout. Use an appropriate hypothesis test and a significance level of a = 0.05. Store the p-value for this test in the variable p3.a and round your answer to two decimal places. Note: In case you haven't see a data frame before, think of it like a spreadsheet where each row is an instance each data and each column is a vector of specific values. To access the values in the "num_purchases" column, use purchases$num_purchases . # your code here p3.a = NA Part C) Bummer. But Nefarian really wants his design to be an improvement, so what's a little bad science? What if he can find a subset of data that supports his claim? Thinking back, Nefarian remembers that Group C supposedly contained some very impulsive customers. Using the same hypothesis from Part A, determine if Nafarian's layout was a statistically significant improvement at the a = 0.05 significance level, if he only looks at sampels from Group C. Save the p-value of this test as p3.c, rounded to three decimal places. Note: To filter the dataframe to only contain data for Group C, use purchases[purchases$group=="c",]. # your code here p3.c = NA Now that you've learned about hypothesis testing and p-values, you should also be aware that these methods can be used incorrectly. Or, even worse, maliciously. Usually it involves manipulating the data or the test in such a way to produce a desired result. There's many methods for this, and they've got some cool names like p-hacking and data dredging. In this problem, we will focus on the idea of using subsets of data to find a desired result. Nefarian just landed his first data science position as an intern at a new e-commerce company. His project was the design and test a new website layout that would lead to more purchases. To test his new layout, the company gathered four different groups of 50 customers and recorded how many of those ended up purchasing an item. This test was then repeated on multiple days. The effectiveness of Nefarian's layout is measured by the number of customers that made a purchase. This data is stored in the data frame purchases. Nefarian wants to land a permanent position at the company after his internship is over, so he really wants to impress his supervisors with his new layout. He knows that the site has an average purchase rate of 0.8 and wants to see if his layout is an improvement. purchases purchases = purchases[,-1] names (purchases) = c("group", "num_purchases") head (purchases)| read.csv("purchases.csv") A data.frame: 6 x 2 group num_purchases <fct> <int> a 36 2 a 42 a 41 a 40 a 36 a 42 Part A) Use the entire dataset to determine whether Nefarian's layout is an improvement over the original layout. Use an appropriate hypothesis test and a significance level of a = 0.05. Store the p-value for this test in the variable p3.a and round your answer to two decimal places. Note: In case you haven't see a data frame before, think of it like a spreadsheet where each row is an instance each data and each column is a vector of specific values. To access the values in the "num_purchases" column, use purchases$num_purchases . # your code here p3.a = NA Part C) Bummer. But Nefarian really wants his design to be an improvement, so what's a little bad science? What if he can find a subset of data that supports his claim? Thinking back, Nefarian remembers that Group C supposedly contained some very impulsive customers. Using the same hypothesis from Part A, determine if Nafarian's layout was a statistically significant improvement at the a = 0.05 significance level, if he only looks at sampels from Group C. Save the p-value of this test as p3.c, rounded to three decimal places. Note: To filter the dataframe to only contain data for Group C, use purchases[purchases$group=="c",]. # your code here p3.c = NA Now that you've learned about hypothesis testing and p-values, you should also be aware that these methods can be used incorrectly. Or, even worse, maliciously. Usually it involves manipulating the data or the test in such a way to produce a desired result. There's many methods for this, and they've got some cool names like p-hacking and data dredging. In this problem, we will focus on the idea of using subsets of data to find a desired result. Nefarian just landed his first data science position as an intern at a new e-commerce company. His project was the design and test a new website layout that would lead to more purchases. To test his new layout, the company gathered four different groups of 50 customers and recorded how many of those ended up purchasing an item. This test was then repeated on multiple days. The effectiveness of Nefarian's layout is measured by the number of customers that made a purchase. This data is stored in the data frame purchases. Nefarian wants to land a permanent position at the company after his internship is over, so he really wants to impress his supervisors with his new layout. He knows that the site has an average purchase rate of 0.8 and wants to see if his layout is an improvement. purchases purchases = purchases[,-1] names (purchases) = c("group", "num_purchases") head (purchases)| read.csv("purchases.csv") A data.frame: 6 x 2 group num_purchases <fct> <int> a 36 2 a 42 a 41 a 40 a 36 a 42 Part A) Use the entire dataset to determine whether Nefarian's layout is an improvement over the original layout. Use an appropriate hypothesis test and a significance level of a = 0.05. Store the p-value for this test in the variable p3.a and round your answer to two decimal places. Note: In case you haven't see a data frame before, think of it like a spreadsheet where each row is an instance each data and each column is a vector of specific values. To access the values in the "num_purchases" column, use purchases$num_purchases . # your code here p3.a = NA Part C) Bummer. But Nefarian really wants his design to be an improvement, so what's a little bad science? What if he can find a subset of data that supports his claim? Thinking back, Nefarian remembers that Group C supposedly contained some very impulsive customers. Using the same hypothesis from Part A, determine if Nafarian's layout was a statistically significant improvement at the a = 0.05 significance level, if he only looks at sampels from Group C. Save the p-value of this test as p3.c, rounded to three decimal places. Note: To filter the dataframe to only contain data for Group C, use purchases[purchases$group=="c",]. # your code here p3.c = NA Now that you've learned about hypothesis testing and p-values, you should also be aware that these methods can be used incorrectly. Or, even worse, maliciously. Usually it involves manipulating the data or the test in such a way to produce a desired result. There's many methods for this, and they've got some cool names like p-hacking and data dredging. In this problem, we will focus on the idea of using subsets of data to find a desired result. Nefarian just landed his first data science position as an intern at a new e-commerce company. His project was the design and test a new website layout that would lead to more purchases. To test his new layout, the company gathered four different groups of 50 customers and recorded how many of those ended up purchasing an item. This test was then repeated on multiple days. The effectiveness of Nefarian's layout is measured by the number of customers that made a purchase. This data is stored in the data frame purchases. Nefarian wants to land a permanent position at the company after his internship is over, so he really wants to impress his supervisors with his new layout. He knows that the site has an average purchase rate of 0.8 and wants to see if his layout is an improvement. purchases purchases = purchases[,-1] names (purchases) = c("group", "num_purchases") head (purchases)| read.csv("purchases.csv") A data.frame: 6 x 2 group num_purchases <fct> <int> a 36 2 a 42 a 41 a 40 a 36 a 42 Part A) Use the entire dataset to determine whether Nefarian's layout is an improvement over the original layout. Use an appropriate hypothesis test and a significance level of a = 0.05. Store the p-value for this test in the variable p3.a and round your answer to two decimal places. Note: In case you haven't see a data frame before, think of it like a spreadsheet where each row is an instance each data and each column is a vector of specific values. To access the values in the "num_purchases" column, use purchases$num_purchases . # your code here p3.a = NA Part C) Bummer. But Nefarian really wants his design to be an improvement, so what's a little bad science? What if he can find a subset of data that supports his claim? Thinking back, Nefarian remembers that Group C supposedly contained some very impulsive customers. Using the same hypothesis from Part A, determine if Nafarian's layout was a statistically significant improvement at the a = 0.05 significance level, if he only looks at sampels from Group C. Save the p-value of this test as p3.c, rounded to three decimal places. Note: To filter the dataframe to only contain data for Group C, use purchases[purchases$group=="c",]. # your code here p3.c = NA Now that you've learned about hypothesis testing and p-values, you should also be aware that these methods can be used incorrectly. Or, even worse, maliciously. Usually it involves manipulating the data or the test in such a way to produce a desired result. There's many methods for this, and they've got some cool names like p-hacking and data dredging. In this problem, we will focus on the idea of using subsets of data to find a desired result. Nefarian just landed his first data science position as an intern at a new e-commerce company. His project was the design and test a new website layout that would lead to more purchases. To test his new layout, the company gathered four different groups of 50 customers and recorded how many of those ended up purchasing an item. This test was then repeated on multiple days. The effectiveness of Nefarian's layout is measured by the number of customers that made a purchase. This data is stored in the data frame purchases. Nefarian wants to land a permanent position at the company after his internship is over, so he really wants to impress his supervisors with his new layout. He knows that the site has an average purchase rate of 0.8 and wants to see if his layout is an improvement. purchases purchases = purchases[,-1] names (purchases) = c("group", "num_purchases") head (purchases)| read.csv("purchases.csv") A data.frame: 6 x 2 group num_purchases <fct> <int> a 36 2 a 42 a 41 a 40 a 36 a 42 Part A) Use the entire dataset to determine whether Nefarian's layout is an improvement over the original layout. Use an appropriate hypothesis test and a significance level of a = 0.05. Store the p-value for this test in the variable p3.a and round your answer to two decimal places. Note: In case you haven't see a data frame before, think of it like a spreadsheet where each row is an instance each data and each column is a vector of specific values. To access the values in the "num_purchases" column, use purchases$num_purchases . # your code here p3.a = NA Part C) Bummer. But Nefarian really wants his design to be an improvement, so what's a little bad science? What if he can find a subset of data that supports his claim? Thinking back, Nefarian remembers that Group C supposedly contained some very impulsive customers. Using the same hypothesis from Part A, determine if Nafarian's layout was a statistically significant improvement at the a = 0.05 significance level, if he only looks at sampels from Group C. Save the p-value of this test as p3.c, rounded to three decimal places. Note: To filter the dataframe to only contain data for Group C, use purchases[purchases$group=="c",]. # your code here p3.c = NA Now that you've learned about hypothesis testing and p-values, you should also be aware that these methods can be used incorrectly. Or, even worse, maliciously. Usually it involves manipulating the data or the test in such a way to produce a desired result. There's many methods for this, and they've got some cool names like p-hacking and data dredging. In this problem, we will focus on the idea of using subsets of data to find a desired result. Nefarian just landed his first data science position as an intern at a new e-commerce company. His project was the design and test a new website layout that would lead to more purchases. To test his new layout, the company gathered four different groups of 50 customers and recorded how many of those ended up purchasing an item. This test was then repeated on multiple days. The effectiveness of Nefarian's layout is measured by the number of customers that made a purchase. This data is stored in the data frame purchases. Nefarian wants to land a permanent position at the company after his internship is over, so he really wants to impress his supervisors with his new layout. He knows that the site has an average purchase rate of 0.8 and wants to see if his layout is an improvement. purchases purchases = purchases[,-1] names (purchases) = c("group", "num_purchases") head (purchases)| read.csv("purchases.csv") A data.frame: 6 x 2 group num_purchases <fct> <int> a 36 2 a 42 a 41 a 40 a 36 a 42 Part A) Use the entire dataset to determine whether Nefarian's layout is an improvement over the original layout. Use an appropriate hypothesis test and a significance level of a = 0.05. Store the p-value for this test in the variable p3.a and round your answer to two decimal places. Note: In case you haven't see a data frame before, think of it like a spreadsheet where each row is an instance each data and each column is a vector of specific values. To access the values in the "num_purchases" column, use purchases$num_purchases . # your code here p3.a = NA Part C) Bummer. But Nefarian really wants his design to be an improvement, so what's a little bad science? What if he can find a subset of data that supports his claim? Thinking back, Nefarian remembers that Group C supposedly contained some very impulsive customers. Using the same hypothesis from Part A, determine if Nafarian's layout was a statistically significant improvement at the a = 0.05 significance level, if he only looks at sampels from Group C. Save the p-value of this test as p3.c, rounded to three decimal places. Note: To filter the dataframe to only contain data for Group C, use purchases[purchases$group=="c",]. # your code here p3.c = NA
Expert Answer:
Answer rating: 100% (QA)
Ans Hypothesis Test The purchase 3 ie p3 is 41 p341 A... View the full answer

Related Book For 

Posted Date:
Students also viewed these accounting questions
-
You are working as an intern at Coral Gables Products, a privately owned manufacturing company. Shortly after you read Chapter 13 in this book, you got into a discussion with the Chief Financial...
-
A business is prospering in such a way that its total (accumulated) profit after t years is 1000t2 dollars. (a) How much did the business make during the third year (between t = 2 and t = 3)? (b)...
-
A tennis ball is struck in such a way that it leaves the racket with a speed of 4.87 m/s in the horizontal direction. When the ball hits the court, it is a horizontal distance of 1.95 m from the...
-
(8) (Non circular cylinder) A solid right (noncircular) cylinder has its base the R in the xy-plane and is bounded above by is 22-y + +5 5 * (x + y) dx dy paraboloid 2= x + y . The cylinder's volume....
-
An actuary at a mid-sized insurance company is examining the sales performance of the companys sales force. She has data on the average size of the policy ($) written in two consecutive years by 200...
-
Following are several account balances taken from the records of Karson and Reilly as of December 31, 2018. A few asset accounts have been omitted here. All revenues, expenses, and dividend...
-
Explain the difference between multiple and simple inheritance and provide one example of each.
-
After careful comparison shopping, Dustin Creamer decides to buy a new Toyota Camry. With some options added, the car has a price of $23,558including plates and taxes. Because he cant afford to pay...
-
The Cole Corporation has provided the following account balances: Account Amount Cash $20,000 Short-term Investments 5,000 Accounts Receivable 6,000 Supplies 7,000 Long-term Notes Receivable 3,000...
-
East Hill Home Healthcare Services was organized on January 1, 2014, by four friends. Each organizer invested $10,000 in the company and, in turn, was issued 8,000 shares of $1.00 par value stock. To...
-
Explain data definition language (DDL). How is it different from data manipulation language (DML)?
-
Clad corporation and Stellar corporation both report on a calendar year basis. Clad merged into Stellar on June 30 Year N. Clad had an allowable net operating loss carryover of $270,000. Stellar's...
-
Sample speeches and lectures with audio and video clips Brochures or programs from exhibits and shows Proposals and other written documents prepared on the job Names and contact information for...
-
A patient in the post-surgical period is received in the recovery room. Which part of the estimate should be a priority for the nursing staff? A patient in the post-surgical period is received in the...
-
Harold discovers a material misstatement while auditing a client's accounts payable. The manger on the job tells Harold to ignore the error so that the client does not get upset. Harold wants to be...
-
What is an explanation for the amount of the Caldwells' refund or balance due?
-
3 VTV In has the following financial statements for 3021 Sales VTY 2021 fame Statement Les Cost of goods sold Less Depreciation Less Interest paid Taxable income $25,800.00 15,600 00 6.000.00...
-
Open Text Corporation provides a suite of business information software products. Exhibit 10-9 contains Note 10 from the companys 2013 annual report detailing long-term debt. Required: a. Open Text...
-
An attorney and member of the New York Bar Association became actively involved with international environmental issues. She proposed, developed, and presented a program that was presented under the...
-
A single mother who suffered from depression was transferred to an office assistant position at a university. The transfer entailed a six-month probationary period. A professor at the university was...
-
In response to reports of drug use and sales by employees at one of its auto plants, Ford enlisted the services of a security firm. Investigators from the firm posed as plant employees. They mingled...
-
In the 1970s, Special Electric Company brokered the sale of crocidolite asbestos, which is the most toxic form of asbestos, to Johns- Manville Corporation. Special Electric never held possession of...
-
On January 2, 2018, The Register, a science and technology news site based in Britain, published an article revealing the existence of two major bugs leaving virtually all computers and smartphones...
-
Plaintiffs W. O. and J. C. Lucy had wanted to purchase Ferguson Farm from the Zehmers for at least eight years. One night, Lucy stopped by the establishment the Zehmers operated and said that he bet...

Study smarter with the SolutionInn App