Answered step by step
Verified Expert Solution
Question
1 Approved Answer
One of the Directors on the Fresh team noticed internally that we are seeing strong sales growth for Fresh, and in the Produce department.

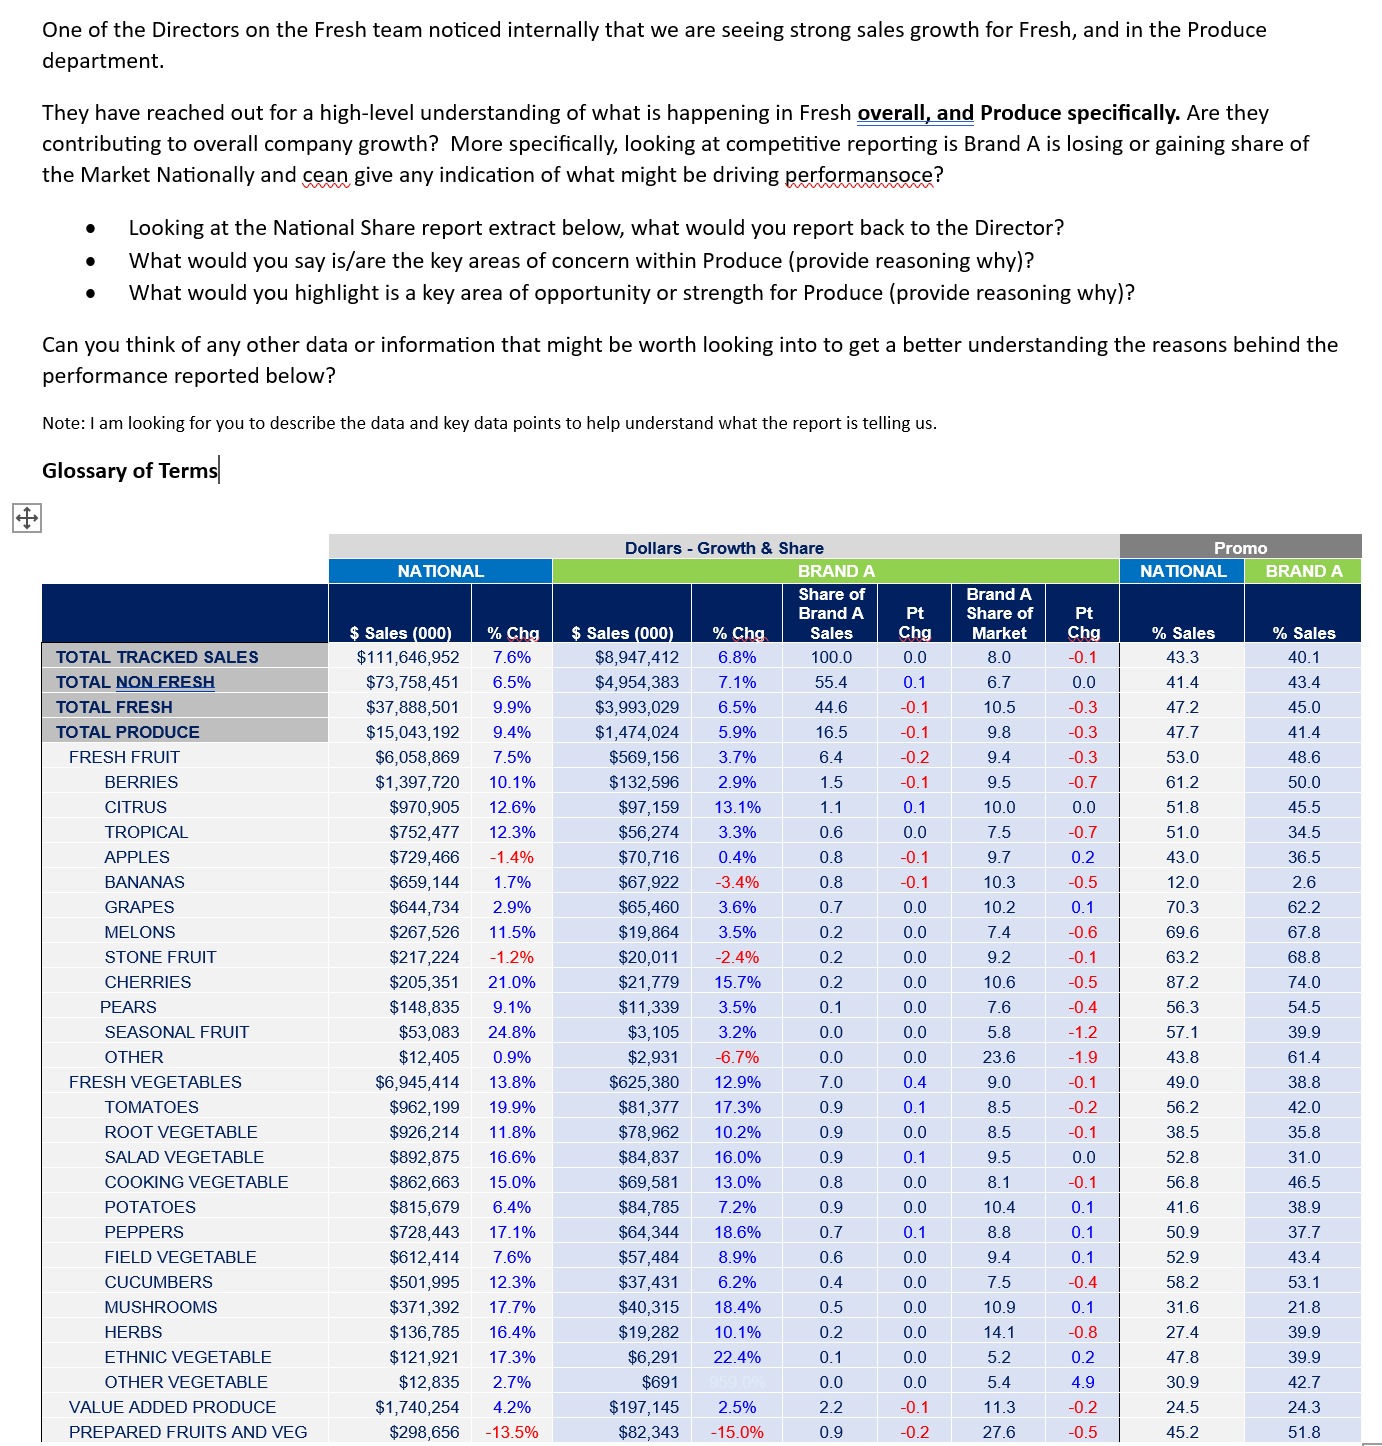
One of the Directors on the Fresh team noticed internally that we are seeing strong sales growth for Fresh, and in the Produce department. They have reached out for a high-level understanding of what is happening in Fresh overall, and Produce specifically. Are they contributing to overall company growth? More specifically, looking at competitive reporting is Brand A is losing or gaining share of the Market Nationally and cean give any indication of what might be driving performansoce? Looking at the National Share report extract below, what would you report back to the Director? What would you say is/are the key areas of concern within Produce (provide reasoning why)? What would you highlight is a key area of opportunity or strength for Produce (provide reasoning why)? Can you think of any other data or information that might be worth looking into to get a better understanding the reasons behind the performance reported below? Note: I am looking for you to describe the data and key data points to help understand what the report is telling us. Glossary of Terms + Dollars - Growth & Share NATIONAL BRAND A Promo NATIONAL BRAND A Share of Brand A Pt Brand A Share of Pt TOTAL TRACKED SALES TOTAL NON FRESH TOTAL FRESH TOTAL PRODUCE FRESH FRUIT BERRIES $ Sales (000) $111,646,952 $73,758,451 $37,888,501 9.9% $15,043,192 9.4% % Chg 7.6% 6.5% $ Sales (000) $8,947,412 % Chg Sales Chg Market Chg % Sales % Sales 6.8% 100.0 0.0 8.0 -0.1 43.3 40.1 $4,954,383 7.1% 55.4 0.1 6.7 0.0 41.4 43.4 $3,993,029 6.5% 44.6 -0.1 10.5 -0.3 47.2 45.0 $1,474,024 5.9% 16.5 -0.1 9.8 -0.3 47.7 41.4 $6,058,869 7.5% $1,397,720 10.1% $569,156 3.7% 6.4 -0.2 9.4 -0.3 53.0 48.6 $132,596 2.9% 1.5 -0.1 9.5 -0.7 61.2 50.0 CITRUS $970,905 12.6% $97,159 13.1% 1.1 0.1 10.0 0.0 51.8 45.5 TROPICAL $752,477 12.3% $56,274 3.3% 0.6 0.0 7.5 -0.7 51.0 34.5 APPLES $729,466 -1.4% $70,716 0.4% 0.8 -0.1 9.7 0.2 43.0 36.5 BANANAS $659,144 1.7% $67,922 -3.4% 0.8 -0.1 10.3 -0.5 12.0 2.6 GRAPES $644,734 2.9% $65,460 3.6% 0.7 0.0 10.2 0.1 70.3 62.2 MELONS $267,526 11.5% $19,864 3.5% 0.2 0.0 7.4 -0.6 69.6 67.8 STONE FRUIT $217,224 -1.2% $20,011 -2.4% 0.2 0.0 9.2 -0.1 63.2 68.8 CHERRIES $205,351 21.0% $21,779 15.7% 0.2 0.0 10.6 -0.5 87.2 74.0 PEARS $148,835 9.1% $11,339 3.5% 0.1 0.0 7.6 -0.4 56.3 54.5 SEASONAL FRUIT OTHER FRESH VEGETABLES TOMATOES ROOT VEGETABLE SALAD VEGETABLE COOKING VEGETABLE $53,083 24.8% $12,405 0.9% $6,945,414 $962,199 19.9% $926,214 11.8% $892,875 16.6% $862,663 15.0% $3,105 3.2% 0.0 0.0 5.8 -1.2 57.1 39.9 $2,931 -6.7% 0.0 0.0 23.6 -1.9 43.8 61.4 13.8% $625,380 12.9% 7.0 0.4 9.0 -0.1 49.0 38.8 $81,377 17.3% 0.9 0.1 8.5 -0.2 56.2 42.0 $78,962 10.2% 0.9 0.0 8.5 -0.1 38.5 35.8 $84,837 16.0% 0.9 0.1 9.5 0.0 52.8 31.0 $69,581 13.0% 0.8 0.0 8.1 -0.1 56.8 46.5 POTATOES $815,679 6.4% $84,785 7.2% 0.9 0.0 10.4 0.1 41.6 38.9 PEPPERS $728,443 17.1% $64,344 18.6% 0.7 0.1 8.8 0.1 50.9 37.7 FIELD VEGETABLE $612,414 7.6% $57,484 8.9% 0.6 0.0 9.4 0.1 52.9 43.4 CUCUMBERS $501,995 12.3% $37,431 6.2% 0.4 0.0 7.5 -0.4 58.2 53.1 MUSHROOMS $371,392 17.7% $40,315 18.4% 0.5 0.0 10.9 0.1 31.6 21.8 HERBS ETHNIC VEGETABLE OTHER VEGETABLE VALUE ADDED PRODUCE PREPARED FRUITS AND VEG $136,785 16.4% $121,921 17.3% $12,835 2.7% $1,740,254 4.2% $298,656 -13.5% $19,282 10.1% 0.2 0.0 14.1 -0.8 27.4 39.9 $6,291 22.4% 0.1 0.0 5.2 0.2 47.8 39.9 $691 $197,145 0.0 0.0 5.4 4.9 30.9 42.7 2.5% 2.2 -0.1 11.3 -0.2 24.5 24.3 $82,343 -15.0% 0.9 -0.2 27.6 -0.5 45.2 51.8
Step by Step Solution
There are 3 Steps involved in it
Step: 1

Get Instant Access to Expert-Tailored Solutions
See step-by-step solutions with expert insights and AI powered tools for academic success
Step: 2

Step: 3

Ace Your Homework with AI
Get the answers you need in no time with our AI-driven, step-by-step assistance
Get Started


