

Page > of 3 MP 4: Lorenz Curve, Gini Index, Robin Hood Index Economists have long...
Fantastic news! We've Found the answer you've been seeking!
Question:
Transcribed Image Text:
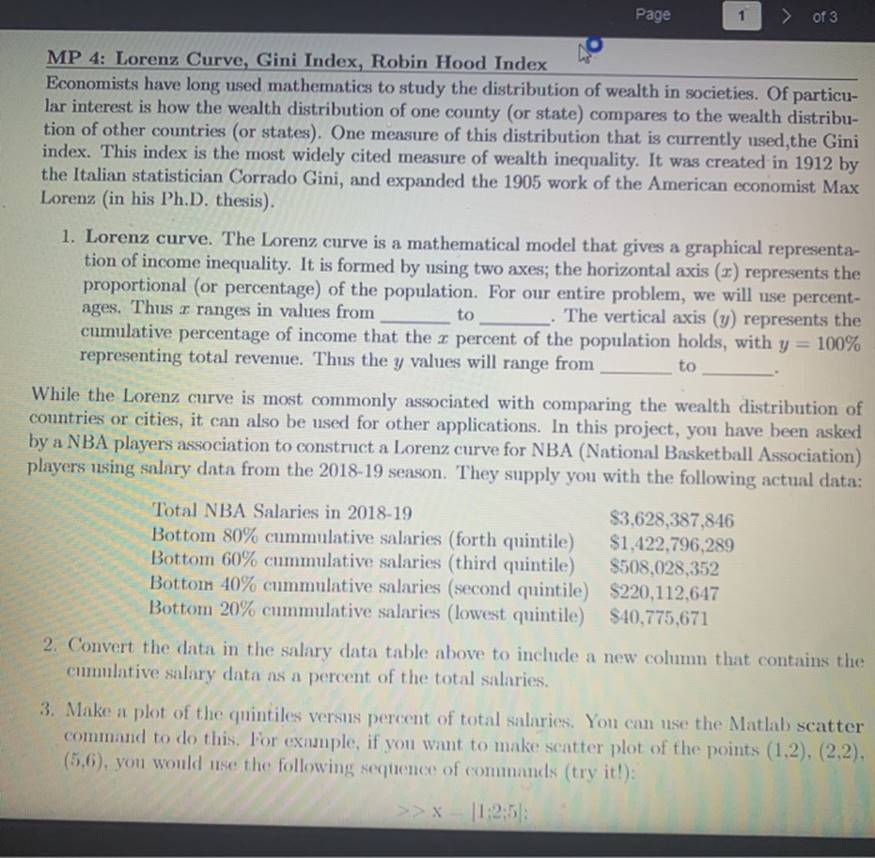
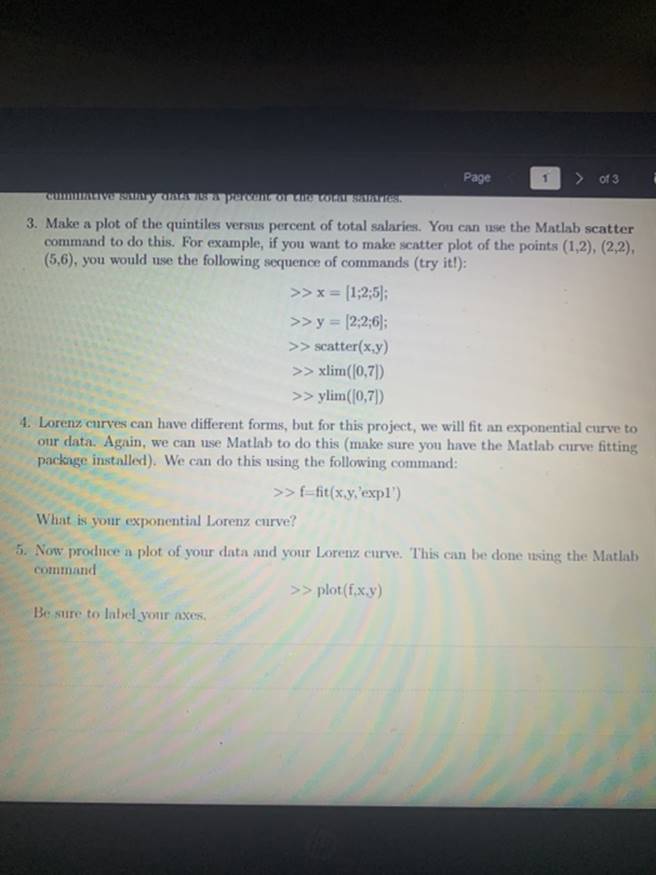
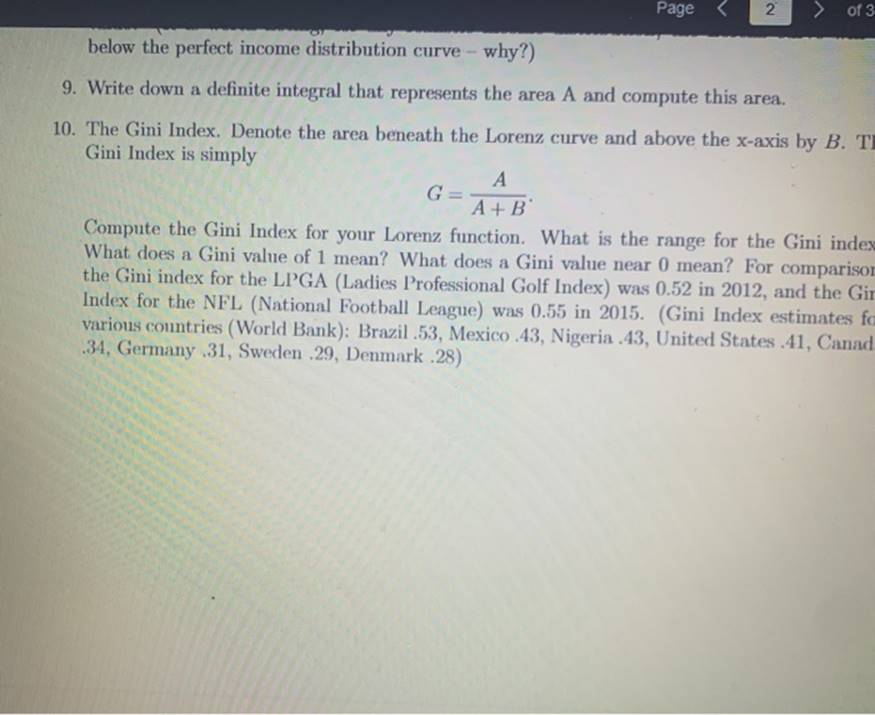
Page > of 3 MP 4: Lorenz Curve, Gini Index, Robin Hood Index Economists have long used mathematics to study the distribution of wealth in societies. Of particu- lar interest is how the wealth distribution of one county (or state) compares to the wealth distribu- tion of other countries (or states). One measure of this distribution that is currently used,the Gini index. This index is the most widely cited measure of wealth inequality. It was created in 1912 by the Italian statistician Corrado Gini, and expanded the 1905 work of the American economist Max Lorenz (in his Ph.D. thesis). 1. Lorenz curve. The Lorenz curve is a mathematical model that gives a graphical representa- tion of income inequality. It is formed by using two axes; the horizontal axis (r) represents the proportional (or percentage) of the population. For our entire problem, we will use percent- ages. Thus r ranges in values from cumulative percentage of income that the I percent of the population holds, with y = 100% representing total revenue. Thus the y values will range from to . The vertical axis (y) represents the to While the Lorenz curve is most commonly associated with comparing the wealth distribution of countries or cities, it can also be used for other applications. In this project, you have been asked by a NBA players association to construct a Lorenz curve for NBA (National Basketball Association) players using salary data from the 2018-19 season. They supply you with the following actual data: Total NBA Salaries in 2018-19 Bottom 80% cummulative salaries (forth quintile) Bottom 60% cummulative salaries (third quintile) Bottom 40% cummulative salaries (second quintile) $220,112,647 Bottom 20% cmmulative salaries (lowest quintile) $40,775,671 $3,628,387,846 $1,422,796,289 $508,028,352 2. Convert the data in the salary data table above to include a new column that contains the cumulative salary data as a percent of the total salaries. 3. Make a plot of the quintiles versus percent of total salaries. You can use the Matlab scatter command to do this. For example, if you want to make scatter plot of the points (1,2), (2,2), (5,6), you would use the following sequence of commands (try it!): |1:2:5: Page > of 3 cumativer ary daS8 a percen or the COrar salarrtes 3. Make a plot of the quintiles versus percent of total salaries. You can use the Matlab scatter command to do this. For example, if you want to make scatter plot of the points (1,2), (2,2), (5,6), you would use the following sequence of commands (try it!): >> x = [1;2;5); >> y = [2:2,6); >> scatter(x,y) >> xlim((0,7|) >> ylim((0,7)) 4. Lorenz curves can have different forms, but for this project, we will fit an exponential curve to our data. Again, we can use Matlab to do this (make sure you have the Matlab curve fitting package installed). We can do this using the following command: >>f-fit(x.y,'expl') What is your exponential Lorenz curve? 5. Now produce a plot of your data and your Lorenz curve. This can be done using the Matlab command >> plot(f.x.y) Be sure to label your axes, Page < 2 > of 3 below the perfect income distribution curve - why?) 9. Write down a definite integral that represents the area A and compute this area. 10. The Gini Index. Denote the area beneath the Lorenz curve and above the x-axis by B. TI Gini Index is simply A A+B Compute the Gini Index for your Lorenz function. What is the range for the Gini index What does a Gini value of 1 mean? What does a Gini value near 0 mean? For comparisor the Gini index for the LPGA (Ladies Professional Golf Index) was 0.52 in 2012, and the Gir Index for the NFL (National Football League) was 0.55 in 2015. (Gini Index estimates fo various countries (World Bank): Brazil .53, Mexico .43, Nigeria 43, United States 41, Canad. 34, Germany .31, Sweden .29, Denmark .28) Page > of 3 MP 4: Lorenz Curve, Gini Index, Robin Hood Index Economists have long used mathematics to study the distribution of wealth in societies. Of particu- lar interest is how the wealth distribution of one county (or state) compares to the wealth distribu- tion of other countries (or states). One measure of this distribution that is currently used,the Gini index. This index is the most widely cited measure of wealth inequality. It was created in 1912 by the Italian statistician Corrado Gini, and expanded the 1905 work of the American economist Max Lorenz (in his Ph.D. thesis). 1. Lorenz curve. The Lorenz curve is a mathematical model that gives a graphical representa- tion of income inequality. It is formed by using two axes; the horizontal axis (r) represents the proportional (or percentage) of the population. For our entire problem, we will use percent- ages. Thus r ranges in values from cumulative percentage of income that the I percent of the population holds, with y = 100% representing total revenue. Thus the y values will range from to . The vertical axis (y) represents the to While the Lorenz curve is most commonly associated with comparing the wealth distribution of countries or cities, it can also be used for other applications. In this project, you have been asked by a NBA players association to construct a Lorenz curve for NBA (National Basketball Association) players using salary data from the 2018-19 season. They supply you with the following actual data: Total NBA Salaries in 2018-19 Bottom 80% cummulative salaries (forth quintile) Bottom 60% cummulative salaries (third quintile) Bottom 40% cummulative salaries (second quintile) $220,112,647 Bottom 20% cmmulative salaries (lowest quintile) $40,775,671 $3,628,387,846 $1,422,796,289 $508,028,352 2. Convert the data in the salary data table above to include a new column that contains the cumulative salary data as a percent of the total salaries. 3. Make a plot of the quintiles versus percent of total salaries. You can use the Matlab scatter command to do this. For example, if you want to make scatter plot of the points (1,2), (2,2), (5,6), you would use the following sequence of commands (try it!): |1:2:5: Page > of 3 cumativer ary daS8 a percen or the COrar salarrtes 3. Make a plot of the quintiles versus percent of total salaries. You can use the Matlab scatter command to do this. For example, if you want to make scatter plot of the points (1,2), (2,2), (5,6), you would use the following sequence of commands (try it!): >> x = [1;2;5); >> y = [2:2,6); >> scatter(x,y) >> xlim((0,7|) >> ylim((0,7)) 4. Lorenz curves can have different forms, but for this project, we will fit an exponential curve to our data. Again, we can use Matlab to do this (make sure you have the Matlab curve fitting package installed). We can do this using the following command: >>f-fit(x.y,'expl') What is your exponential Lorenz curve? 5. Now produce a plot of your data and your Lorenz curve. This can be done using the Matlab command >> plot(f.x.y) Be sure to label your axes, Page < 2 > of 3 below the perfect income distribution curve - why?) 9. Write down a definite integral that represents the area A and compute this area. 10. The Gini Index. Denote the area beneath the Lorenz curve and above the x-axis by B. TI Gini Index is simply A A+B Compute the Gini Index for your Lorenz function. What is the range for the Gini index What does a Gini value of 1 mean? What does a Gini value near 0 mean? For comparisor the Gini index for the LPGA (Ladies Professional Golf Index) was 0.52 in 2012, and the Gir Index for the NFL (National Football League) was 0.55 in 2015. (Gini Index estimates fo various countries (World Bank): Brazil .53, Mexico .43, Nigeria 43, United States 41, Canad. 34, Germany .31, Sweden .29, Denmark .28)
Expert Answer:
Answer rating: 100% (QA)
1 To construct a Lorenz curve for NBA players using the salary data provided we need to calculate th... View the full answer

Related Book For 

College Mathematics For Business Economics, Life Sciences, And Social Sciences
ISBN: 978-0134674148
14th Edition
Authors: Raymond Barnett, Michael Ziegler, Karl Byleen, Christopher Stocker
Posted Date:
Students also viewed these accounting questions
-
The data in the following table describe the distribution of wealth in a country: (A) Use quadratic regression to find the equation of a Lorenz curve for the data. (B) Use the regression equation and...
-
In this problem we will use Figure to estimate the expected return on the stock market. To estimate the expected return, we will create a list of possible returns and we will assign a probability to...
-
In this problem we will use Fig to estimate the expected return on the stock market. To estimate the expected return, we will create a list of possible returns and we will assign a probability to...
-
Verify that (x, y) = tan 1 y/x is harmonic using both the rectangular and polar expressions for .
-
Central Manufacturing produces custom- made kitchen cabinets. This is a medium- sized, family- owned corporation with approximately 150 employees. Joe Starr has been the president for the past 5...
-
In September 2023, suppose FedEx had the following characteristics: Stock price = $250/share Shares outstanding = 256 million Net Debt (debt - cash) = $13.7 billion Equity beta = 1.40 i. Using this...
-
A derivative security of European style with expiration in 1 year has this payoff: \(\max (0, \min (3 K-S, S-K))\), where \(K=10\) is the strike price and \(S\) is the price of the underlying stock...
-
On January 1, 2011, Gless Textiles issued $12 million of 9%, 10-year convertible bonds at 101. The bonds pay interest on June 30 and December 31. Each $1,000 bond is convertible into 40 shares of...
-
Do process costing and job order costing both maintain perpetual invetories?
-
Required - Please submit the following two documents: 1. Using Excel, submit the following: i. ii. Calculate Rashmika's minimum net income for tax purposes in accordance with the ordering provisions...
-
Process water of density 1000 kg.m-3 and viscosity 0.001 N.s.m-2 containing spherical particles with a diameter of 30 m and a density of 2800 kg.m-3 are to be separated in a continuously operated...
-
1. Why does Peter Alfandary state that globalization is a myth? 2. How does Peter Alfandary support his view that Village Life still rules? 3. Peter Alfandary provides two primary reasons for the...
-
What is an account payable? What transactions result in the recognition of an account payable?
-
Consider and discuss the potential areas that a new ethical purchasing policy needs to address. These include: a) the rationale for why Fat-E should have a corporate ethical policy, b) who the policy...
-
investment banking to your local college. Definitions and purpose. Roles they play for corporations. The risks they take and why they make so much money? How an LBO or private equity ownership change...
-
Do you think that the experts recommendations will be sufficient to get most of the administrators to fill out the rating forms properly? Why? Why not? What additional actions (if any) do you think...
-
Using the table of linear attenuation coefficients provided below, calculate the thickness of iron and lead required to attenuate narrow, collimated, monochromatic beams of 0.1 MeV and 1.0 MeV gamma...
-
Explain why each of the following is either a private good or a public good: traffic lights, in line skates, a city park, a chicken salad sandwich, a tennis racket, national defense, a coastal...
-
In Problem discuss the validity of each statement. If the statement is true, explain why. If not, give a counter example. Vx? = |x|for all real numbers x
-
A mailing service states that a rectangular package shall have the sum of its length and girth not to exceed 120 inches (see the figure on page 838). What are the dimensions of the largest (in...
-
Using the table of probabilities shown Find P(R Z). X Y Z Totals S .10 .25 .15 .50 T .05 .20 .02 .27 R .05 .15 .03 .23 Totals .20 .60 .20 1.00
-
What are the key differences between financing entrepreneurial and established companies?
-
What steps are needed to show that entrepreneurial finance is beneficial to the economy at large?
-
What are the main challenges that entrepreneurs and investors face at the four steps of the funding cycle, as described in the FIRE framework?

Study smarter with the SolutionInn App