

Question: Part 2 7. Go to Resonance Tubes (Lab) and after reading the short description, click Begin. https://www.thephysicsaviary.com/Physics/Programs/Labs/ResonanceTubeLab/ 8. This will bring up an image on
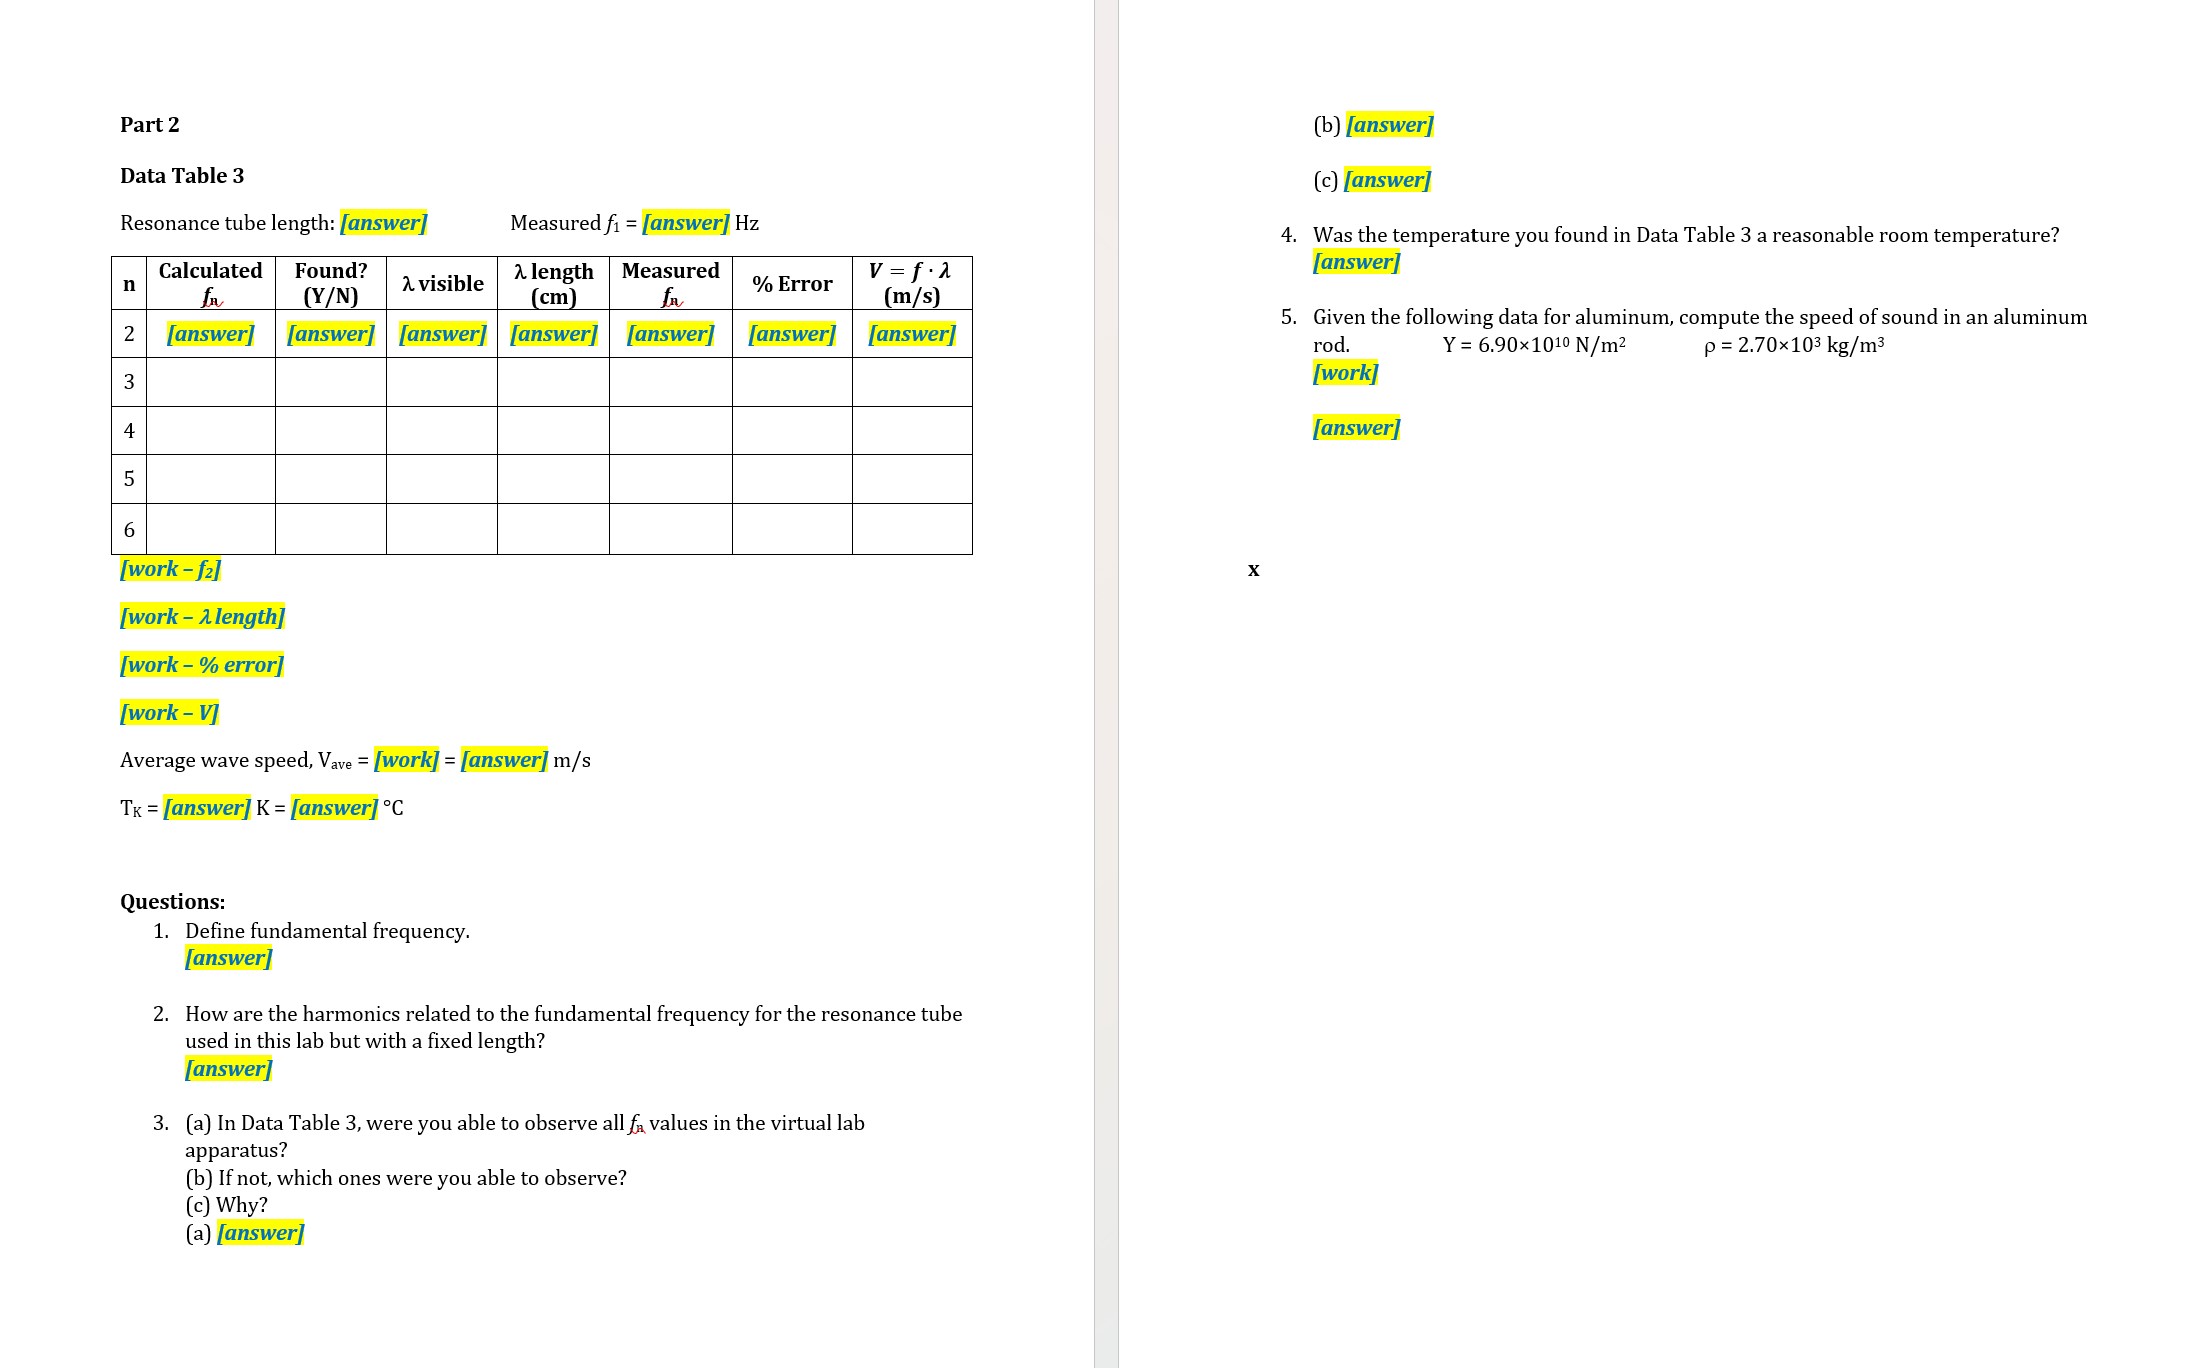
Part 2 7. Go to Resonance Tubes (Lab) and after reading the short description, click Begin. https://www.thephysicsaviary.com/Physics/Programs/Labs/ResonanceTubeLab/ 8. This will bring up an image on the top of a frequency generator. The window shows the generated frequency. Next to it is the Scan button and the Power button. Below these is a Range Selection switch. Below the frequency generator is an image of a resonance tube with one end close with a cap and the other end open. The open end is next to the speaker. 9. Click on Activate Grid. Measure the resonance tube length and record in Data Table 3. 10. If the Frequency Generator is turned off, click on the Power button. Then click Scan. The generator will continue to scan through the frequencies until a standing wave forms. Once it stops, record the frequency as fi in Data Table 3. 11. Calculate the next 5 possible frequencies and record in Data Table 3. 12. Click on the Scan button. If another standing wave forms, it will, again, stop scanning and show the standing wave in the resonance tube. 13. Continue to scan through the rest of the range of frequencies (75 Hz - 250 Hz), recording any standing wave frequencies found in the Measured f column in Data Table 3. Also record to 2 decimal places the fraction (how much) of a single wavelength, 2, visible in the resonance tube and record in the 4th column. Use the wavelength fraction visible to calculate how long a whole, single wavelength would be in cm and record. 14. Were all the calculated frequencies found? In the 3rd column, place a Y if the calculated frequency was found to be a standing wave, and an N if it was not. 15. Click on the Range Selection switch such that the generator can scan through the 250 Hz to 1 kHz range. Repeat steps 13 and 14 for the higher frequency range. 16. Calculate the % Error for the calculated and measured fa values and record in Data Table 3. 17. Calculate and record the wave speed for each observed wavelength. 18. Calculate and record the average wave speed. 19. Calculate and record the temperature of the simulation in both Kelvin and degrees Celsius, using the average wave speed.Part 2 (b) [answer Data Table 3 (c) [answer] Resonance tube length: [answer] Measured f1 = [answer] Hz 4. Was the temperature you found in Data Table 3 a reasonable room temperature? Calculated Found? a length Measured V = f . x answer n (Y/N) visible (cm) % Error (m/s) 5. Given the following data for aluminum, compute the speed of sound in an aluminum 2 [answer] [answer] [answer] [answer] [answer [answer] [answer] rod. Y = 6.90x10¹⁰ N/m2 p = 2.70x10⁵ kg/m 3 [work 4 [answer] 5 6 [work - f2] X [work - 1 length] [work - % error] [work - V Average wave speed, Vave = [work] = [answer] m/s TK = [answer] K = [answer] .C Questions: 1. Define fundamental frequency. [answer 2. How are the harmonics related to the fundamental frequency for the resonance tube used in this lab but with a fixed length? [answer] 3. (a) In Data Table 3, were you able to observe all f. values in the virtual lab apparatus? (b) If not, which ones were you able to observe? (c) Why? (a) [answer]
Step by Step Solution
There are 3 Steps involved in it

Get step-by-step solutions from verified subject matter experts