

take the GE Stock Price and the S&P 500 Index as givens. Just enter the numbers....
Fantastic news! We've Found the answer you've been seeking!
Question:
Transcribed Image Text:
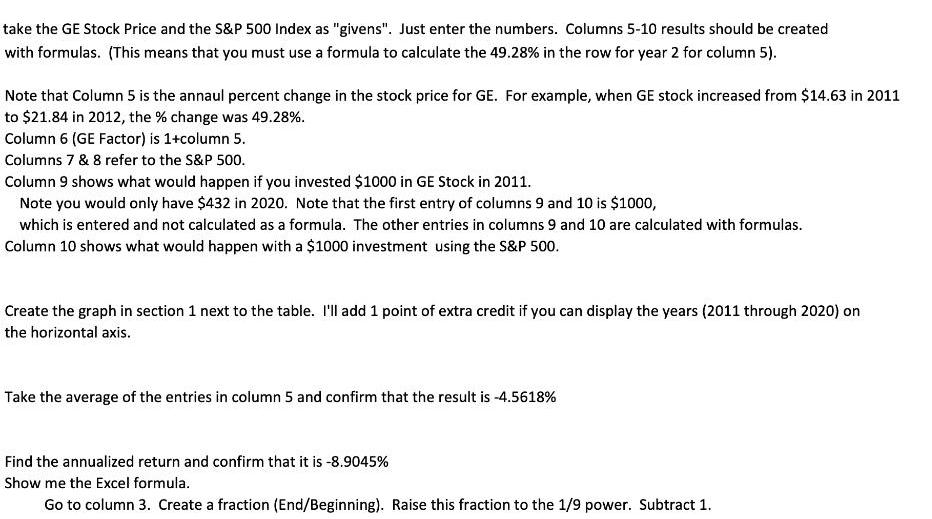
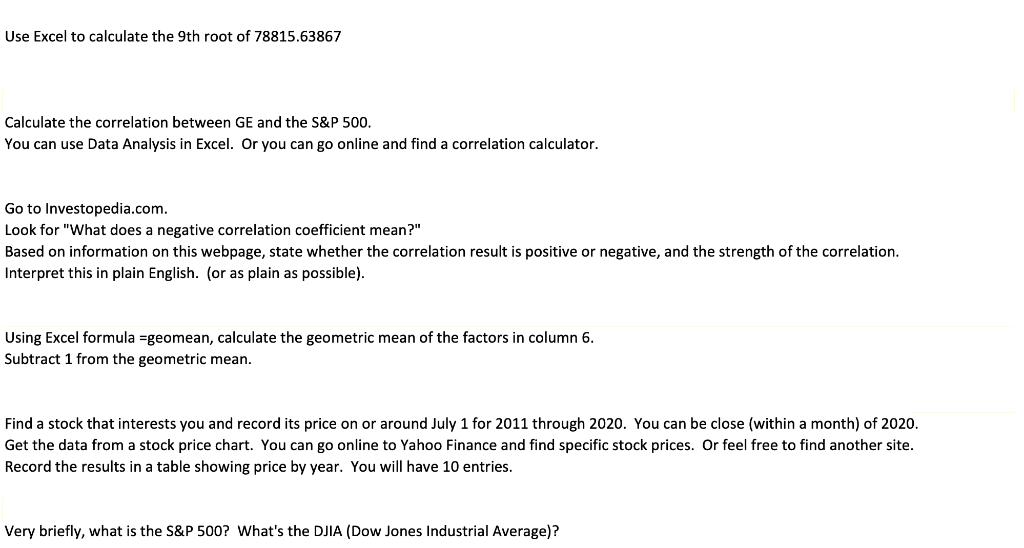
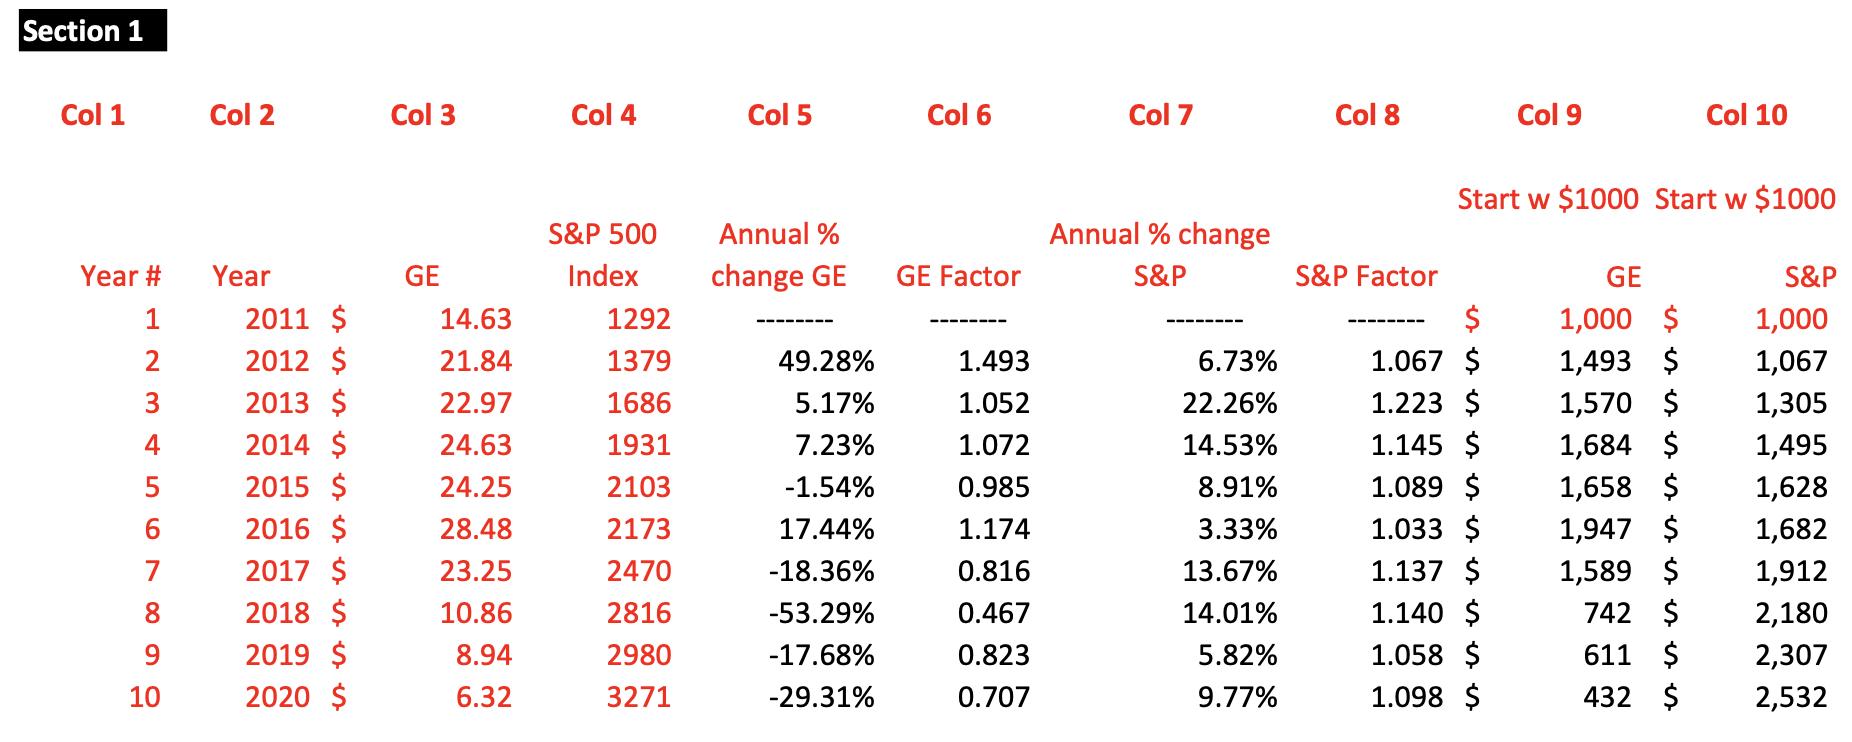
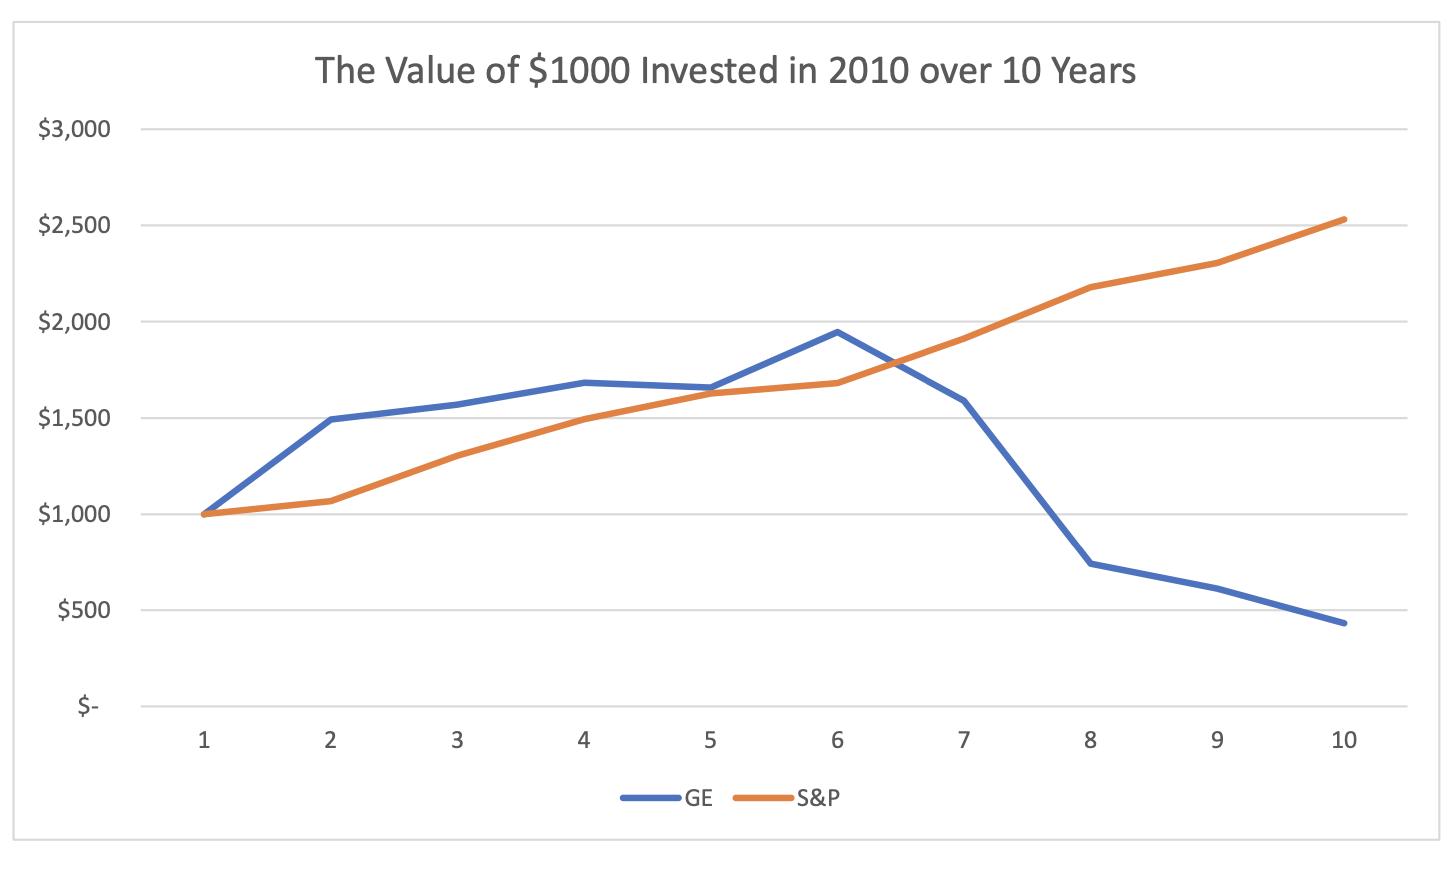
take the GE Stock Price and the S&P 500 Index as "givens". Just enter the numbers. Columns 5-10 results should be created with formulas. (This means that you must use a formula to calculate the 49.28% in the row for year 2 for column 5). Note that Column 5 is the annaul percent change in the stock price for GE. For example, when GE stock increased from $14.63 in 2011 to $21.84 in 2012, the % change was 49.28%. Column 6 (GE Factor) is 1+column 5. Columns 7 & 8 refer to the S&P 500. Column 9 shows what would happen if you invested $1000 in GE Stock in 2011. Note you would only have $432 in 2020. Note that the first entry of columns 9 and 10 is $1000, which is entered and not calculated as a formula. The other entries in columns 9 and 10 are calculated with formulas. Column 10 shows what would happen with a $1000 investment using the S&P 500. Create the graph in section 1 next to the table. I'll add 1 point of extra credit if you can display the years (2011 through 2020) on the horizontal axis. Take the average of the entries in column 5 and confirm that the result is -4.5618% Find the annualized return and confirm that it is -8.9045% Show me the Excel formula. Go to column 3. Create a fraction (End/Beginning). Raise this fraction to the 1/9 power. Subtract 1. Use Excel to calculate the 9th root of 78815.63867 Calculate the correlation between GE and the S&P 500. You can use Data Analysis in Excel. Or you can go online and find a correlation calculator. Go to Investopedia.com. Look for "What does a negative correlation coefficient mean?" Based on information on this webpage, state whether the correlation result is positive or negative, and the strength of the correlation. Interpret this in plain English. (or as plain as possible). Using Excel formula =geomean, calculate the geometric mean of the factors in column 6. Subtract 1 from the geometric mean. Find a stock that interests you and record its price on or around July 1 for 2011 through 2020. You can be close (within a month) of 2020. Get the data from a stock price chart. You can go online to Yahoo Finance and find specific stock prices. Or feel free to find another site. Record the results in a table showing price by year. You will have 10 entries. Very briefly, what is the S&P 500? What's the DJIA (Dow Jones Industrial Average)? Section 1 Col 1 Col 2 Col 3 Col 4 Col 5 Col 6 Col 7 Col 8 Col 9 Col 10 Start w $1000 Start w $1000 S&P 500 Annual % Annual % change Year # Year GE Index change GE GE Factor S&P S&P Factor GE S&P 2011 $ 2$ 1.067 $ 1,000 $ 1,493 $ 1,570 $ 1,684 $ 1,658 $ 1,947 $ 1,589 $ 742 $ 1 14.63 1292 1,000 ---- ---- 2012 $ 2013 $ 2 21.84 1379 49.28% 1.493 6.73% 1,067 3 22.97 1686 5.17% 1.052 22.26% 1.223 $ 1,305 2014 $ 2015 $ 2016 $ 2017 $ 1.145 $ 1.089 $ 1.033 $ 1.137 $ 1.140 $ 1.058 $ 1.098 $ 24.63 1931 7.23% 1.072 14.53% 1,495 24.25 2103 -1.54% 0.985 8.91% 1,628 6. 28.48 2173 17.44% 1.174 3.33% 1,682 7 23.25 2470 -18.36% 0.816 13.67% 1,912 2018 $ 2019 $ 2020 $ 10.86 2816 -53.29% 0.467 14.01% 2,180 9 8.94 2980 -17.68% 0.823 5.82% 611 $ 2,307 10 6.32 3271 -29.31% 0.707 9.77% 432 $ 2,532 The Value of $1000 Invested in 2010 over 10 Years $3,000 $2,500 $2,000 $1,500 $1,000 $500 S. 1 2 3 4 6. 7 8. 9 10 GE S&P take the GE Stock Price and the S&P 500 Index as "givens". Just enter the numbers. Columns 5-10 results should be created with formulas. (This means that you must use a formula to calculate the 49.28% in the row for year 2 for column 5). Note that Column 5 is the annaul percent change in the stock price for GE. For example, when GE stock increased from $14.63 in 2011 to $21.84 in 2012, the % change was 49.28%. Column 6 (GE Factor) is 1+column 5. Columns 7 & 8 refer to the S&P 500. Column 9 shows what would happen if you invested $1000 in GE Stock in 2011. Note you would only have $432 in 2020. Note that the first entry of columns 9 and 10 is $1000, which is entered and not calculated as a formula. The other entries in columns 9 and 10 are calculated with formulas. Column 10 shows what would happen with a $1000 investment using the S&P 500. Create the graph in section 1 next to the table. I'll add 1 point of extra credit if you can display the years (2011 through 2020) on the horizontal axis. Take the average of the entries in column 5 and confirm that the result is -4.5618% Find the annualized return and confirm that it is -8.9045% Show me the Excel formula. Go to column 3. Create a fraction (End/Beginning). Raise this fraction to the 1/9 power. Subtract 1. Use Excel to calculate the 9th root of 78815.63867 Calculate the correlation between GE and the S&P 500. You can use Data Analysis in Excel. Or you can go online and find a correlation calculator. Go to Investopedia.com. Look for "What does a negative correlation coefficient mean?" Based on information on this webpage, state whether the correlation result is positive or negative, and the strength of the correlation. Interpret this in plain English. (or as plain as possible). Using Excel formula =geomean, calculate the geometric mean of the factors in column 6. Subtract 1 from the geometric mean. Find a stock that interests you and record its price on or around July 1 for 2011 through 2020. You can be close (within a month) of 2020. Get the data from a stock price chart. You can go online to Yahoo Finance and find specific stock prices. Or feel free to find another site. Record the results in a table showing price by year. You will have 10 entries. Very briefly, what is the S&P 500? What's the DJIA (Dow Jones Industrial Average)? Section 1 Col 1 Col 2 Col 3 Col 4 Col 5 Col 6 Col 7 Col 8 Col 9 Col 10 Start w $1000 Start w $1000 S&P 500 Annual % Annual % change Year # Year GE Index change GE GE Factor S&P S&P Factor GE S&P 2011 $ 2$ 1.067 $ 1,000 $ 1,493 $ 1,570 $ 1,684 $ 1,658 $ 1,947 $ 1,589 $ 742 $ 1 14.63 1292 1,000 ---- ---- 2012 $ 2013 $ 2 21.84 1379 49.28% 1.493 6.73% 1,067 3 22.97 1686 5.17% 1.052 22.26% 1.223 $ 1,305 2014 $ 2015 $ 2016 $ 2017 $ 1.145 $ 1.089 $ 1.033 $ 1.137 $ 1.140 $ 1.058 $ 1.098 $ 24.63 1931 7.23% 1.072 14.53% 1,495 24.25 2103 -1.54% 0.985 8.91% 1,628 6. 28.48 2173 17.44% 1.174 3.33% 1,682 7 23.25 2470 -18.36% 0.816 13.67% 1,912 2018 $ 2019 $ 2020 $ 10.86 2816 -53.29% 0.467 14.01% 2,180 9 8.94 2980 -17.68% 0.823 5.82% 611 $ 2,307 10 6.32 3271 -29.31% 0.707 9.77% 432 $ 2,532 The Value of $1000 Invested in 2010 over 10 Years $3,000 $2,500 $2,000 $1,500 $1,000 $500 S. 1 2 3 4 6. 7 8. 9 10 GE S&P
Expert Answer:

Related Book For 
Introduction to Operations and Supply Chain Management
ISBN: 978-0132747325
3rd edition
Authors: Cecil B. Bozarth, Robert B. Handfield
Posted Date:
Students also viewed these programming questions
-
The following gure shows an Excel spreadsheet that calculates weighted X and Y coordinates, based on values for up to ve demand points. Re-create this spreadsheet in Excel. While your formatting does...
-
The following figure shows an Excel spreadsheet that compares total ordering and holding costs for some current order quantity to the same costs for the EOQ and calculates how much could be saved by...
-
Build an Excel spreadsheet for operating expenses. The spreadsheet should clearly display the total operating expenses, other expenses, and total expenses. There are both fixed cost and variable cost...
-
How could a company's "green" policies affect their reputation management and community-building strategies, both positively and negatively?
-
What is boot? What effect does boot have on a like-kind exchange?
-
Reconsider Prob. 253. Assuming a linear pressure increase during the compression, estimate the energy needed to compress the water isothermally. Data from Problem 53. A frictionless piston-cylinder...
-
Using random digit dialing, researchers asked 1090 U.S. adults their level of education. Identify the sampling technique used, and discuss potential sources of bias (if any). Explain.
-
Winter Companys balance sheet at December 31, 2013, is presented below. During January 2014, the following transactions occurred. Winter uses the perpetual inventory method. Jan. 1 Winter accepted a...
-
Bramble Company has two classes of capital stock outstanding: 8%, $20 par preferred and $5 par common. At December 31, 2025, the following accounts were included in stockholders' equity. Preferred...
-
Your company's balance sheet has the followinYour company's balance sheet has the following items (not listed in the correct order): Item Amount Accounts receivable 1,312 Short-term debt 100 Cash 83...
-
Assume you are a member of the Family Research Council and have become increasingly concerned about the drug use by professional sports players. You set up a plan and conduct a survey on how people...
-
Fresh Market opens 300 days a year. The usage of cash register tape is on average about 5 rolls daily (daily demand). Fresh Market pays a flat fee $43 to place an order of cash register tape. It...
-
The sanding department of Wildhorse Furniture Company has the following production and manufacturing cost data for March 2022, the first month of operation. Production: 10,750 units completed and...
-
Kilt Company had the following information for the year: Direct materials used Direct labor incurred (5,000 hours) Actual manufacturing overhead incurred $110,000 $150,000 $166,000 Kilt Company used...
-
One of Swifty Company's activity cost pools is inspection which has estimated overhead costs of $150000. Swifty produces throw rugs (700 inspections) and area rugs (1300 inspections). what amount of...
-
A project under consideration has an internal rate of return of 13% and a beta of 0.6. The risk-free rate is 8%, and the expected rate of return on the market portfolio is 13%. a-1. Calculate the...
-
Using the balance sheet ( top ) and the income statement ( bottom ) , calculate the following ratios ( all years ) and the year - over - year percentage change for # 1 . Days Sale in Receivable # 2 ....
-
A non-charmed baryon has strangeness S = 2 and electric charge Q = 0. What are the possible values of its isospin I and of its third component I z ? What is it usually called if I = 1/2?
-
How does a group technology process resemble a classic batch process? How does it resemble a classic production line? What are the advantages/disadvantages of such a hybrid manufacturing process?
-
Develop two exponential smoothing forecasts for periods 2 through 11. For the rst forecast, use a = 0.2. For the second, use a = 0.7. Assume that your forecast for period 1 was 250. Plot the results....
-
What are the relationships among learning, productivity, and effective capacity? What are the pros and cons of using learning curves to estimate future resource requirements?
-
Colors of fabrics at a clothing store. Determine whether the data are qualitative or quantitative. Explain your reasoning.
-
Weights of bricks at a construction site. Determine whether the data are qualitative or quantitative. Explain your reasoning.
-
Marital statuses mentioned in an employment form. Determine whether the data are qualitative or quantitative. Explain your reasoning.

Study smarter with the SolutionInn App